 "
]
},
{
"cell_type": "markdown",
"metadata": {},
"source": [
"### 13.7 Serial Correlation"
]
},
{
"cell_type": "markdown",
"metadata": {},
"source": [
"지금가지 결과는 다수의 modeling decision에 의해 이루어짐. 가장 오류가 많이 발생하는 원인은 다음과 같다.\n",
"\n",
"* 길이에서 부피로 변환하기 위해 종양이 구 형태라고 가정. 매우 큰 종양일 경우에 부적절.\n",
"* 시뮬레이션 상의 성장 분포는 Zhang의 논문에서 53명의 환자를 대상으로 실험한 데이터에 적합한 연속적 모델을 기반. 샘플수가 많아지면 달라질 수 있음.\n",
"* 성장률 모델은 종양의 단계나 유형을 고려하지 않았으며 Zhang의 논문의 내용을 참조하였음. \"Growth rates in renal tumors of different sizes, subtypes and grades represent a wide range and overlap substantially.\" 샘플수가 많아지면 차이가 드러날 수 있음.\n",
"* 성장률 분포는 종양의 크기와 상관 없다. 아주 작거나 큰 종양의 경우 수혈에 따라 성장이 제한되므로 이 가정을 사용할 수 없음.\n",
"* 시뮬레이션에서 각 시간 구간의 성장률은 앞 구간의 성장률과 무관. 그러나 성장률 간에 연속적 상관관계가 있을 수 있음."
]
},
{
"cell_type": "markdown",
"metadata": {},
"source": [
"첫번째와 마지막 내용이 문제가 될 것 같아, 우선 연속적 상관관계를 파악해보자.\n",
"\n",
"연관 성장 시뮬레이션을 위해, 주어진 Cdf를 사용한 연관 시계열 generator (http://wiki.python.org/moin/)를 작성함.\n",
"1. 가우시안 분포를 사용해 연관값을 생성. 앞의 값을 이용해 다음 값의 분포를 계산.\n",
"2. 각 값을 Gaussian CDF를 사용해 누적 확률로 변환.\n",
"3. 각 누적 확률을 주어진 Cdf를 사용해 연관값으로 변환."
]
},
{
"cell_type": "code",
"execution_count": 16,
"metadata": {
"collapsed": true
},
"outputs": [],
"source": [
"def CorrelatedGenerator(cdf, rho):\n",
" \"\"\"Generates a sequence of values from cdf with correlation.\n",
"\n",
" Generates a correlated standard Gaussian series, then transforms to\n",
" values from cdf\n",
"\n",
" cdf: distribution to choose from\n",
" rho: target coefficient of correlation\n",
" \"\"\"\n",
" x = random.gauss(0, 1)\n",
" yield Transform(x)\n",
" sigma = math.sqrt(1 - rho**2);\n",
" while True:\n",
" x = random.gauss(x * rho, sigma)\n",
" yield Transform(x)"
]
},
{
"cell_type": "markdown",
"metadata": {},
"source": [
"x: Gaussian; Transform: converts to the desired distribution"
]
},
{
"cell_type": "markdown",
"metadata": {},
"source": [
"cdf 모양에 따라, 변환 시 정보 손실이 있을 수 있으므로 실제 상관관계는 rho보다 낮을 수 있음. 예를 들어 rho=0.4인 성장률 분포에서 10,000개의 값을 생성할 때 실제 상관관계는 0.37이지만, 실제 상관관계를 추측해 봤을 때 이 정도면 충분히 근접.\n",
"\n",
"MakeSequence에서 인수로 초기값을 취함. 이 인터페이스는 다른 반복 함수를 사용해서 동작하도록 한다."
]
},
{
"cell_type": "code",
"execution_count": 17,
"metadata": {
"collapsed": true
},
"outputs": [],
"source": [
"#Add from 'kidney.py'\n",
"\n",
"def UncorrelatedGenerator(cdf, _rho=None):\n",
" \"\"\"Generates a sequence of values from cdf with no correlation.\n",
"\n",
" Ignores rho, which is accepted as a parameter to provide the\n",
" same interface as CorrelatedGenerator\n",
"\n",
" cdf: distribution to choose from\n",
" rho: ignored\n",
" \"\"\"\n",
" while True:\n",
" x = cdf.Random()\n",
" yield x\n"
]
},
{
"cell_type": "code",
"execution_count": 19,
"metadata": {
"collapsed": false
},
"outputs": [
{
"ename": "NameError",
"evalue": "name 'cdf' is not defined",
"output_type": "error",
"traceback": [
"\u001b[0;31m---------------------------------------------------------------------------\u001b[0m",
"\u001b[0;31mNameError\u001b[0m Traceback (most recent call last)",
"\u001b[0;32m
"
]
},
{
"cell_type": "markdown",
"metadata": {},
"source": [
"### 13.7 Serial Correlation"
]
},
{
"cell_type": "markdown",
"metadata": {},
"source": [
"지금가지 결과는 다수의 modeling decision에 의해 이루어짐. 가장 오류가 많이 발생하는 원인은 다음과 같다.\n",
"\n",
"* 길이에서 부피로 변환하기 위해 종양이 구 형태라고 가정. 매우 큰 종양일 경우에 부적절.\n",
"* 시뮬레이션 상의 성장 분포는 Zhang의 논문에서 53명의 환자를 대상으로 실험한 데이터에 적합한 연속적 모델을 기반. 샘플수가 많아지면 달라질 수 있음.\n",
"* 성장률 모델은 종양의 단계나 유형을 고려하지 않았으며 Zhang의 논문의 내용을 참조하였음. \"Growth rates in renal tumors of different sizes, subtypes and grades represent a wide range and overlap substantially.\" 샘플수가 많아지면 차이가 드러날 수 있음.\n",
"* 성장률 분포는 종양의 크기와 상관 없다. 아주 작거나 큰 종양의 경우 수혈에 따라 성장이 제한되므로 이 가정을 사용할 수 없음.\n",
"* 시뮬레이션에서 각 시간 구간의 성장률은 앞 구간의 성장률과 무관. 그러나 성장률 간에 연속적 상관관계가 있을 수 있음."
]
},
{
"cell_type": "markdown",
"metadata": {},
"source": [
"첫번째와 마지막 내용이 문제가 될 것 같아, 우선 연속적 상관관계를 파악해보자.\n",
"\n",
"연관 성장 시뮬레이션을 위해, 주어진 Cdf를 사용한 연관 시계열 generator (http://wiki.python.org/moin/)를 작성함.\n",
"1. 가우시안 분포를 사용해 연관값을 생성. 앞의 값을 이용해 다음 값의 분포를 계산.\n",
"2. 각 값을 Gaussian CDF를 사용해 누적 확률로 변환.\n",
"3. 각 누적 확률을 주어진 Cdf를 사용해 연관값으로 변환."
]
},
{
"cell_type": "code",
"execution_count": 16,
"metadata": {
"collapsed": true
},
"outputs": [],
"source": [
"def CorrelatedGenerator(cdf, rho):\n",
" \"\"\"Generates a sequence of values from cdf with correlation.\n",
"\n",
" Generates a correlated standard Gaussian series, then transforms to\n",
" values from cdf\n",
"\n",
" cdf: distribution to choose from\n",
" rho: target coefficient of correlation\n",
" \"\"\"\n",
" x = random.gauss(0, 1)\n",
" yield Transform(x)\n",
" sigma = math.sqrt(1 - rho**2);\n",
" while True:\n",
" x = random.gauss(x * rho, sigma)\n",
" yield Transform(x)"
]
},
{
"cell_type": "markdown",
"metadata": {},
"source": [
"x: Gaussian; Transform: converts to the desired distribution"
]
},
{
"cell_type": "markdown",
"metadata": {},
"source": [
"cdf 모양에 따라, 변환 시 정보 손실이 있을 수 있으므로 실제 상관관계는 rho보다 낮을 수 있음. 예를 들어 rho=0.4인 성장률 분포에서 10,000개의 값을 생성할 때 실제 상관관계는 0.37이지만, 실제 상관관계를 추측해 봤을 때 이 정도면 충분히 근접.\n",
"\n",
"MakeSequence에서 인수로 초기값을 취함. 이 인터페이스는 다른 반복 함수를 사용해서 동작하도록 한다."
]
},
{
"cell_type": "code",
"execution_count": 17,
"metadata": {
"collapsed": true
},
"outputs": [],
"source": [
"#Add from 'kidney.py'\n",
"\n",
"def UncorrelatedGenerator(cdf, _rho=None):\n",
" \"\"\"Generates a sequence of values from cdf with no correlation.\n",
"\n",
" Ignores rho, which is accepted as a parameter to provide the\n",
" same interface as CorrelatedGenerator\n",
"\n",
" cdf: distribution to choose from\n",
" rho: ignored\n",
" \"\"\"\n",
" while True:\n",
" x = cdf.Random()\n",
" yield x\n"
]
},
{
"cell_type": "code",
"execution_count": 19,
"metadata": {
"collapsed": false
},
"outputs": [
{
"ename": "NameError",
"evalue": "name 'cdf' is not defined",
"output_type": "error",
"traceback": [
"\u001b[0;31m---------------------------------------------------------------------------\u001b[0m",
"\u001b[0;31mNameError\u001b[0m Traceback (most recent call last)",
"\u001b[0;32m "
]
},
{
"cell_type": "markdown",
"metadata": {},
"source": [
"상관관계는 종양 성장의 속도를 구분하므로 나이의 범위는 더 커짐. 낮은 %에서는 차이가 적지만, 95th에서는 6년 이상 차이가 남. 정확한 계산을 위해 실제 연속 상관관계에 대해 더 나은 추정값이 필요하지만, \"15.5cm 길이의 종양이 있다고 했을때 8년 전에 생겼을 확률\"에 대한 답으로 이 모델로 충분함."
]
},
{
"cell_type": "code",
"execution_count": 20,
"metadata": {
"collapsed": true
},
"outputs": [],
"source": [
"# class Cache\n",
"def ProbOlder(self, cm, age):\n",
" \"\"\"Computes the probability of exceeding age, given size.\n",
" cm: size of the tumor; age: age threshold in years.\n",
" \"\"\"\n",
" bucket = CmToBucket(cm)\n",
" cdf = self.ConditionalCdf(bucket)\n",
" p = cdf.Prob(age)\n",
" return 1-p"
]
},
{
"cell_type": "markdown",
"metadata": {},
"source": [
"1) Converts size to a bucket number
"
]
},
{
"cell_type": "markdown",
"metadata": {},
"source": [
"상관관계는 종양 성장의 속도를 구분하므로 나이의 범위는 더 커짐. 낮은 %에서는 차이가 적지만, 95th에서는 6년 이상 차이가 남. 정확한 계산을 위해 실제 연속 상관관계에 대해 더 나은 추정값이 필요하지만, \"15.5cm 길이의 종양이 있다고 했을때 8년 전에 생겼을 확률\"에 대한 답으로 이 모델로 충분함."
]
},
{
"cell_type": "code",
"execution_count": 20,
"metadata": {
"collapsed": true
},
"outputs": [],
"source": [
"# class Cache\n",
"def ProbOlder(self, cm, age):\n",
" \"\"\"Computes the probability of exceeding age, given size.\n",
" cm: size of the tumor; age: age threshold in years.\n",
" \"\"\"\n",
" bucket = CmToBucket(cm)\n",
" cdf = self.ConditionalCdf(bucket)\n",
" p = cdf.Prob(age)\n",
" return 1-p"
]
},
{
"cell_type": "markdown",
"metadata": {},
"source": [
"1) Converts size to a bucket number \n", "2) Gets the Cdf of age conditioned on bucket
\n", "3) Computes the probability that age exceeds the given value" ] }, { "cell_type": "markdown", "metadata": {}, "source": [ "연속 상관관계가 없는 상태에서, 15.5cm의 종양이 8년 전에 생겼을 확률은 0.9999로 거의 확실.\n", "0.4의 상관관계에서는 0.995, 0.8에서는 0.978로 여전히 높다.\n", "\n", "종양이 구형이라는 가정은, 선형 차원의 종양이 15.5cm X 15cm 일 때 이 가정은 별로 유효하지 않음. 이 크기의 종양이 평먼에 가깝다면 동일한 부피의 종양은 6cm의 구형일 것. 부피가 더 작고 상관관계가 0.8일 경우, 종양 나이가 8년 이상이 되었을 확률은 여전히 95%.\n", "\n", "=> 모델링 오차를 고려해도 이렇게 큰 종양이 진단받은 때부터 8년 이내에 생겼을 확률은 매우 낮다." ] }, { "cell_type": "markdown", "metadata": {}, "source": [ "### 13.8 Discussion" ] }, { "cell_type": "markdown", "metadata": {}, "source": [ "Bayes’s theorem 나 Suite class that encapsulates Bayesian updates 사용 안함.\n", "=> 계산의 효율성을 위함. 한번 결합 분포를 계산하면, 베이즈 이론이 필요치 않음." ] }, { "cell_type": "code", "execution_count": null, "metadata": { "collapsed": true }, "outputs": [], "source": [] } ], "metadata": { "kernelspec": { "display_name": "Python 2", "language": "python", "name": "python2" }, "language_info": { "codemirror_mode": { "name": "ipython", "version": 2 }, "file_extension": ".py", "mimetype": "text/x-python", "name": "python", "nbconvert_exporter": "python", "pygments_lexer": "ipython2", "version": "2.7.9" } }, "nbformat": 4, "nbformat_minor": 0 }
 \n",
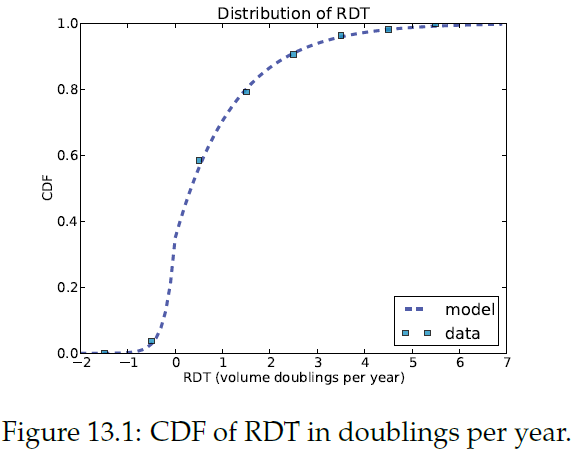
"The positive tail fits an exponential distribution well => a mixture of two exponentials."
]
},
{
"cell_type": "markdown",
"metadata": {},
"source": [
"### 13.2 A simple model"
]
},
{
"cell_type": "markdown",
"metadata": {},
"source": [
"Assumption: tumors grow with a constant doubling time, and that they are three-dimensional in the sense that if the maximum linear measurement doubles, the volume is multiplied by eight. (종양은 doubling time이 일정한 상수이고, 최대 linear 척도가 2배가 되면 부피가 8배가 되는 3차원 형태라고 가정)\n",
"\n",
"The time between his discharge from the military and his diagnosis was 3291 days (about 9 years) (군인이 증상을 보였을 때부터 전역할 때까의 시간은 3291일 이었음).\n",
"\n",
"So my first calculation was, “If this tumor grew at the median rate, how big would it have been at the date of discharge?”\n",
"(종양이 median 비율로 자란다면, 전역할때까지 얼마나 커질까에 대해 먼저 계산함)\n",
"\n",
"The median volume doubling time reported by Zhang et al is 811 days. Assuming 3-dimensional geometry, the doubling time for a linear measure is three times longer.\n",
"(Zhang의 보고에 따르면 median volume의 doubling time은 811일이었음. 종양이 3차원이라 가정할때 linear 척도의 doubling time은 3배가 더 길다)"
]
},
{
"cell_type": "code",
"execution_count": 1,
"metadata": {
"collapsed": false
},
"outputs": [],
"source": [
"import math\n",
"import numpy\n",
"import random\n",
"import sys\n",
"\n",
"import correlation #add correlation.py\n",
"import thinkplot #add thinkplot.py, thinkstat.py\n",
"import matplotlib\n",
"import matplotlib.pyplot as pyplot\n",
"import thinkbayes #add thinkbayes.py"
]
},
{
"cell_type": "code",
"execution_count": 2,
"metadata": {
"collapsed": true
},
"outputs": [],
"source": [
"# Source from http://thinkbayes.com/kidney.py\n",
"\n",
"# time between discharge and diagnosis, in days\n",
"interval = 3291.0\n",
"\n",
"# doubling time in linear measure is doubling time in volume * 3\n",
"dt = 811.0 * 3\n",
"\n",
"# number of doublings since discharge\n",
"doublings = interval / dt\n",
"\n",
"# how big was the tumor at time of discharge (diameter in cm)\n",
"d1 = 15.5\n",
"d0 = d1 / 2.0 ** doublings"
]
},
{
"cell_type": "code",
"execution_count": 3,
"metadata": {
"collapsed": false
},
"outputs": [
{
"data": {
"text/plain": [
"6.069363645997591"
]
},
"execution_count": 3,
"metadata": {},
"output_type": "execute_result"
}
],
"source": [
"d0"
]
},
{
"cell_type": "markdown",
"metadata": {},
"source": [
"So if this tumor formed after the date of discharge, it must have grown substantially faster than the median rate. Therefore I concluded that it is “more likely than not” that this tumor formed before the date of discharge.\n",
"(d0는 약 6cm이므로 전역 이후 생겼다면 median rate 보다 빨리 자란 것 => 종양이 전역 이전에 생겼을 가능성이 높음)"
]
},
{
"cell_type": "markdown",
"metadata": {},
"source": [
"In addition, I computed the growth rate that would be implied if this tumor had formed after the date of discharge. If we assume an initial size of 0.1 cm, we can compute the number of doublings to get to a final size of 15.5 cm:\n",
"\n",
"(종양이 전역 후에 생겼을 경우 성장률을 구해봄. 초기 크기가 0.1cm라고 가정할때 최종 15.5cm가 될때까지 doubling을 얼마나 거쳐야 하는지 계산할 수 있다.)"
]
},
{
"cell_type": "code",
"execution_count": 4,
"metadata": {
"collapsed": false
},
"outputs": [],
"source": [
"# assume an initial linear measure of 0.1 cm\n",
"d0 = 0.1\n",
"d1 = 15.5\n",
"\n",
"# how many doublings would it take to get from d0 to d1\n",
"#doublings = log2(d1 / d0)\n",
"doublings = math.log(d1/d0, 2)\n",
"\n",
"# what linear doubling time does that imply?\n",
"dt = interval / doublings\n",
"\n",
"# compute the volumetric doubling time and RDT(reciprocal doubling time)\n",
"vdt = dt / 3\n",
"rdt = 365 / vdt"
]
},
{
"cell_type": "code",
"execution_count": 5,
"metadata": {
"collapsed": false
},
"outputs": [
{
"data": {
"text/plain": [
"2.420952969849678"
]
},
"execution_count": 5,
"metadata": {},
"output_type": "execute_result"
}
],
"source": [
"rdt"
]
},
{
"cell_type": "markdown",
"metadata": {},
"source": [
"The number of doublings, in linear measure, is 7.3, which implies an RDT of 2.4. In the data from Zhang et al, only 20% of tumors grew this fast during a period of observation. So again, I concluded that is “more likely than not” that the tumor formed prior to the date of discharge.\n",
"\n",
"(Zhang의 논문에 따르면 20%의 종양만이 관측 기간 동안 계산된 속도 정도로 자람. 따라서 전역 이전에 생겼을 가능성이 높음.)\n",
"\n",
"=> a letter explaining my conclusions to the Veterans’ Benefit Administration"
]
},
{
"cell_type": "markdown",
"metadata": {},
"source": [
"#### 13.3 A more general model"
]
},
{
"cell_type": "markdown",
"metadata": {},
"source": [
"Given the size of a tumor at time of diagnosis, it would be most useful to know the probability that the tumor formed before any given date; in other words, the distribution of ages.\n",
"To find it, I run simulations of tumor growth to get the distribution of size conditioned on age. Then we can use a Bayesian approach to get the distribution of age conditioned on size.\n",
"\n",
"(diagnosis 시간별로 종양의 크기가 주어지면, 특정 일자 전에 종양이 생겼을 확률-age의 분포-를 알기가 더 용이함.\n",
"이를 위해 age별로 종양 성장률을 시뮬레이션을 수행한 후, Bayesian 접근법에 따라 크기에 따른 age의 분포를 얻을 수 있음)"
]
},
{
"cell_type": "markdown",
"metadata": {},
"source": [
"The simulation starts with a small tumor and runs these steps:\n",
"\n",
"1. Choose a growth rate from the distribution of RDT. (RDT 분포로부터 성장률을 선택)\n",
"\n",
"2. Compute the size of the tumor at the end of an interval. (구간 끝에 종양의 크기를 계산)\n",
"\n",
"3. Record the size of the tumor at each interval. (각 구간별 종양의 크기를 기록)\n",
"\n",
"4. Repeat until the tumor exceeds the maximum relevant size. (종양 크기가 최대 적합 크기를 초과할 때까지 반복)"
]
},
{
"cell_type": "markdown",
"metadata": {},
"source": [
"초기 크기: 0.3cm로 가정. 이보다 암종이 작으면 외과적으로 수술할 일이 거의 없고 성장으로 인한 혈액 소모가 발생하지 않는다. (http://en.wikipedia.org/wiki/Carcinoma_in_situ)\n",
"\n",
"시간 구간: 데이터 측정 구간 중 중간 시간인 245일 (약 8달)\n",
"\n",
"최고 크기: 20cm (데이터 소스: 1~12cm)\n",
"\n",
"시뮬레이션에서 성장률(growth rate)은 각 구간마다 독립적으로 가정. 이전 구간과 age, size, growth rate는 독립적\n",
"\n",
"
 \n",
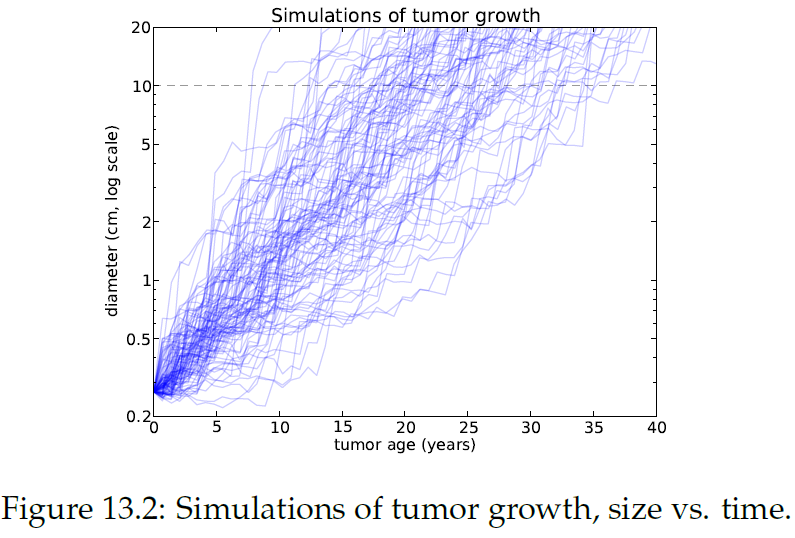
"Figure13.2에서 종양 나이에 따른 종양 크기를 시뮬레이션한 결과를 볼 수 있음. 10cm에서 점선은 이 크기에 대한 종양의 나이 범위를 나타내며, 빠르게 자라는 종양은 8년, 느리게 자라는 종양은 35년 이상이 걸림.\n",
"\n",
"위에서 linear 측정치에 대해 결과를 나타냈지만, 계산은 부피로 한다. 이때 주어진 구의 지름에 대한 부피를 계산하는 방식으로 변환하면 된다."
]
},
{
"cell_type": "markdown",
"metadata": {},
"source": [
"### 13.4 Implementation"
]
},
{
"cell_type": "code",
"execution_count": 6,
"metadata": {
"collapsed": true
},
"outputs": [],
"source": [
"def Volume(diameter, factor=4*math.pi/3):\n",
" \"\"\"Converts a diameter to a volume.\n",
" V = 4/3 pi (d/2)^3\n",
" \"\"\"\n",
" return factor * (diameter/2.0)**3"
]
},
{
"cell_type": "code",
"execution_count": 7,
"metadata": {
"collapsed": false
},
"outputs": [],
"source": [
"# Kernel\n",
"def MakeSequence(rdt_seq, v0=0.01, interval=0.67, vmax=Volume(20.0)):\n",
" \"\"\"Simulate the growth of a tumor.\n",
"\n",
" rdt_seq: sequence of rdts\n",
" v0: initial volume in mL (cm^3)\n",
" interval: timestep in years\n",
" vmax: volume to stop at\n",
"\n",
" Returns: sequence of volumes\n",
" \"\"\"\n",
" seq = v0,\n",
" age = 0\n",
" \n",
" for rdt in rdt_seq:\n",
" age += interval\n",
" final, seq = ExtendSequence(age, seq, rdt, interval)\n",
" if final > vmax:\n",
" break\n",
" \n",
" return seq"
]
},
{
"cell_type": "markdown",
"metadata": {},
"source": [
"rdt_seq: iterator that yields random values from the CDF of growth rate
  "
]
},
{
"cell_type": "markdown",
"metadata": {},
"source": [
"### 13.6 Conditional distributions"
]
},
{
"cell_type": "markdown",
"metadata": {},
"source": [
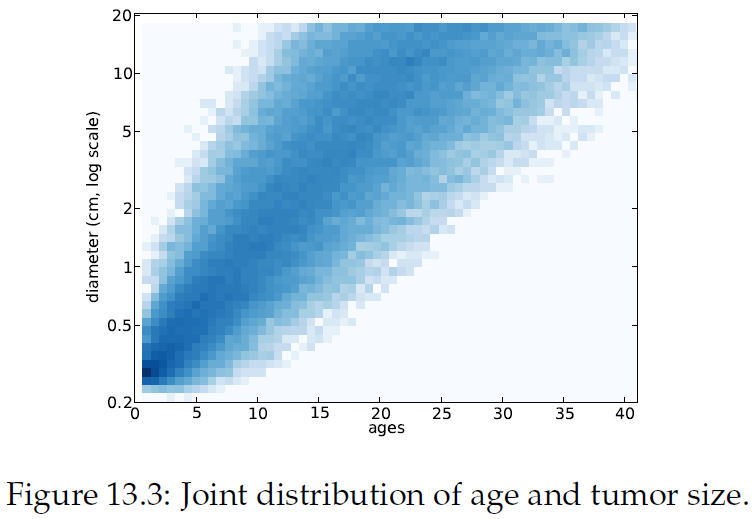
"vertical slice from the joint distribution: distribution of sizes for any given age\n",
"horizontal slice: distribution of ages conditioned on size."
]
},
{
"cell_type": "code",
"execution_count": 13,
"metadata": {
"collapsed": true
},
"outputs": [],
"source": [
"#class Cache: reads the joint distribution and \n",
"#builds the conditional distribution for a given size\n",
"\n",
"def ConditionalCdf(self, bucket):\n",
" pmf = self.joint.Conditional(0, 1, bucket)\n",
" cdf = pmf.MakeCdf()\n",
" return cdf"
]
},
{
"cell_type": "markdown",
"metadata": {},
"source": [
"bucket: integer bucket number corresponding to tumor size\n",
"\n",
"Joint.Conditional: computes the PMF of age conditioned on bucket. \n",
"\n",
"The result is the CDF of age conditioned on bucket.\n",
"\n",
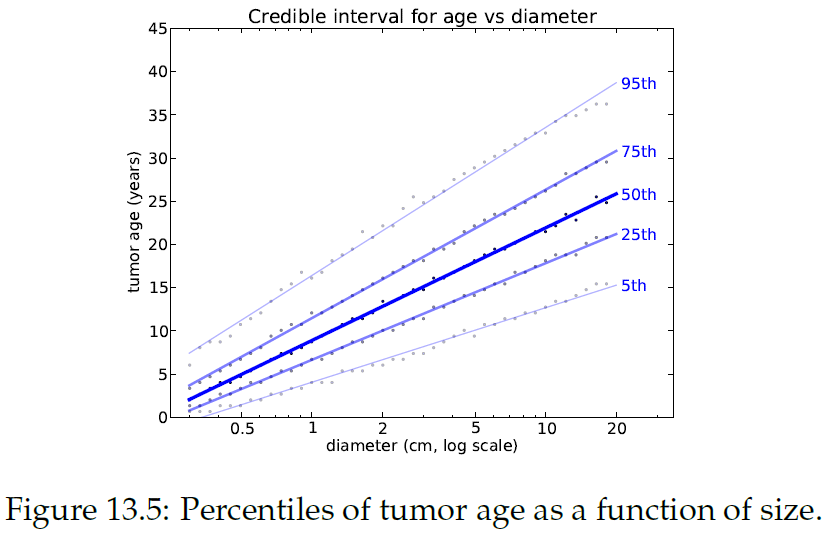
"Figure 13.4 shows several of these CDFs, for a range of sizes. To summarize these distributions, we can compute percentiles as a function of size.\n",
"\n",
"
"
]
},
{
"cell_type": "markdown",
"metadata": {},
"source": [
"### 13.6 Conditional distributions"
]
},
{
"cell_type": "markdown",
"metadata": {},
"source": [
"vertical slice from the joint distribution: distribution of sizes for any given age\n",
"horizontal slice: distribution of ages conditioned on size."
]
},
{
"cell_type": "code",
"execution_count": 13,
"metadata": {
"collapsed": true
},
"outputs": [],
"source": [
"#class Cache: reads the joint distribution and \n",
"#builds the conditional distribution for a given size\n",
"\n",
"def ConditionalCdf(self, bucket):\n",
" pmf = self.joint.Conditional(0, 1, bucket)\n",
" cdf = pmf.MakeCdf()\n",
" return cdf"
]
},
{
"cell_type": "markdown",
"metadata": {},
"source": [
"bucket: integer bucket number corresponding to tumor size\n",
"\n",
"Joint.Conditional: computes the PMF of age conditioned on bucket. \n",
"\n",
"The result is the CDF of age conditioned on bucket.\n",
"\n",
"Figure 13.4 shows several of these CDFs, for a range of sizes. To summarize these distributions, we can compute percentiles as a function of size.\n",
"\n",
"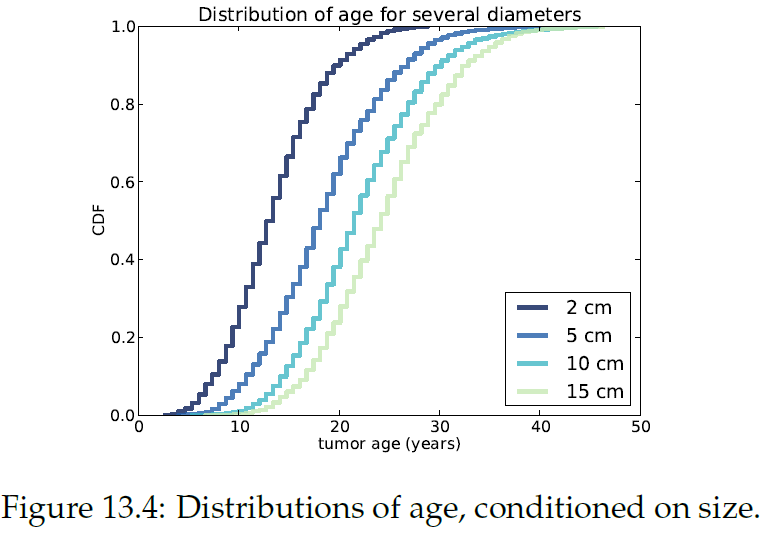 "
]
},
{
"cell_type": "code",
"execution_count": 14,
"metadata": {
"collapsed": true
},
"outputs": [],
"source": [
"def GetBuckets():\n",
" \"\"\"Returns an iterator for the keys in the cache.\"\"\"\n",
" return sequences.iterkeys()"
]
},
{
"cell_type": "code",
"execution_count": 15,
"metadata": {
"collapsed": false
},
"outputs": [
{
"ename": "NameError",
"evalue": "name 'cache' is not defined",
"output_type": "error",
"traceback": [
"\u001b[0;31m---------------------------------------------------------------------------\u001b[0m",
"\u001b[0;31mNameError\u001b[0m Traceback (most recent call last)",
"\u001b[0;32m
"
]
},
{
"cell_type": "code",
"execution_count": 14,
"metadata": {
"collapsed": true
},
"outputs": [],
"source": [
"def GetBuckets():\n",
" \"\"\"Returns an iterator for the keys in the cache.\"\"\"\n",
" return sequences.iterkeys()"
]
},
{
"cell_type": "code",
"execution_count": 15,
"metadata": {
"collapsed": false
},
"outputs": [
{
"ename": "NameError",
"evalue": "name 'cache' is not defined",
"output_type": "error",
"traceback": [
"\u001b[0;31m---------------------------------------------------------------------------\u001b[0m",
"\u001b[0;31mNameError\u001b[0m Traceback (most recent call last)",
"\u001b[0;32m