---
title: "Reproducible science
using 
"
author: Thibaut Jombart
date: "2019-11-19"
output:
ioslides_presentation
---
```{r setup, include=FALSE}
## This code defines the 'verbatim' option for chunks
## which will include the chunk with its header and the
## trailing "```".
require(knitr)
hook_source_def = knit_hooks$get('source')
knit_hooks$set(source = function(x, options){
if (!is.null(options$verbatim) && options$verbatim){
opts = gsub(",\\s*verbatim\\s*=\\s*TRUE\\s*.*$", "", options$params.src)
bef = sprintf('\n\n ```{r %s}\n', opts, "\n")
stringr::str_c(bef, paste(knitr:::indent_block(x, " "), collapse = '\n'), "\n ```\n")
} else {
hook_source_def(x, options)
}
})
```
# On reproducibility
## What is reproducibility in science?
> - ability to reproduce results by a peer
> - requires data, methods, and procedures
> - increasingly, science is supposed to be reproducible
## Why does it not happen, in practice?
Some opinions on whether reproducibility is needed:
> - *Ideally, yes but we don't have time for this.*
> - *If it gets published, yes.*
> - *If it gets published, yes; unless it is in PLoS One...*
> - *No need: I work on my own.*
> - *For others to copy us? You crazy?!*
> - *No way! We rigged the data, the method does not work, and we ran the analyses in Excel.*
## Main obstacles to reproducibility {.columns-2}
 > - lack of time: ultimately, reproducibility is faster
> - fear of plagiarism: low risks in practice
> - internal work, no need to share: almost never true
> - lack of time: ultimately, reproducibility is faster
> - fear of plagiarism: low risks in practice
> - internal work, no need to share: almost never true
> - one good reason: lack of tools to facilitate reproducibility
## You never work alone

Be nice to your future selves!
## Two aspects of reproducibility using 

> - implementing methods as packages
> - making transparent and reproducible analyses
#  eproducibility in practice
## Literate programming
eproducibility in practice
## Literate programming
 > *Let us change our traditional attitude to the construction of programs: instead
of imagining that our main task is to instruct a computer what to do, let us
concentrate rather on explaining to humans what we want
the computer to do.* (Donald E. Knuth, Literate Programming,
1984)
## A data-centred approach to programming
> *Let us change our traditional attitude to the construction of programs: instead
of imagining that our main task is to instruct a computer what to do, let us
concentrate rather on explaining to humans what we want
the computer to do.* (Donald E. Knuth, Literate Programming,
1984)
## A data-centred approach to programming
 ## Literate programming in
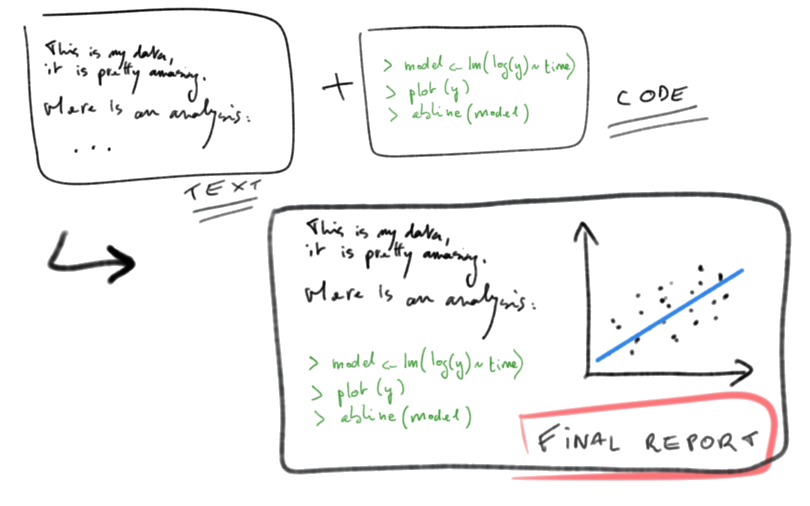
Current workflows use the following equation:
**markdown** (`.md`) + =
**Rmarkdown** (`.Rmd`)
## Literate programming in
Current workflows use the following equation:
**markdown** (`.md`) + =
**Rmarkdown** (`.Rmd`)
Example:
`knitr::knit2html("foo.Rmd")` $\rightarrow$ `foo.html`
`rmarkdown::render("foo.Rmd")` $\rightarrow$ `foo.pdf`
`rmarkdown::render("foo.Rmd")` $\rightarrow$ `foo.doc`
`...`
## **Rmarkdown**: chunks in markdown {.smaller}
```{r chunk-title, ..., verbatim = TRUE, eval = FALSE}
a <- rnorm(1000)
hist(a, col = terrain.colors(15), border = "white", main = "Normal distribution")
```
results in:
```{r rmarkdown, out.width = "80%", fig.width = 12, echo = c(2,3)}
set.seed(1)
a <- rnorm(1000)
hist(a, col = terrain.colors(15), border = "white", main = "Normal distribution")
```
## Formatting outputs
```{r another-chunk-title, ..., verbatim = TRUE, eval = FALSE}
[some R code here]
```
where `...` are options for processing and formatting, e.g:
- `eval` (`TRUE`/`FALSE`): evaluate code?
- `echo` (`TRUE`/`FALSE`): show code input?
- `results` (`"markup"/"hide"/"asis"`): show/format code output
- `message/warning/error`: show messages, warnings, errors?
- `cache` (`TRUE`/`FALSE`): cache analyses?
See [http://yihui.name/knitr/options](http://yihui.name/knitr/options) for details on all options.
## One format, several outputs
**`rmarkdown`** can generate different types of documents:
- standardised reports (`html`, `pdf`)
- journal articles. using the `rticles` package (`.pdf`)
- Tufte handouts (`.pdf`)
- word documents (`.doc`)
- slides for presentations (`html`, `pdf`)
- ...
See: [http://rmarkdown.rstudio.com/gallery.html](http://rmarkdown.rstudio.com/gallery.html).
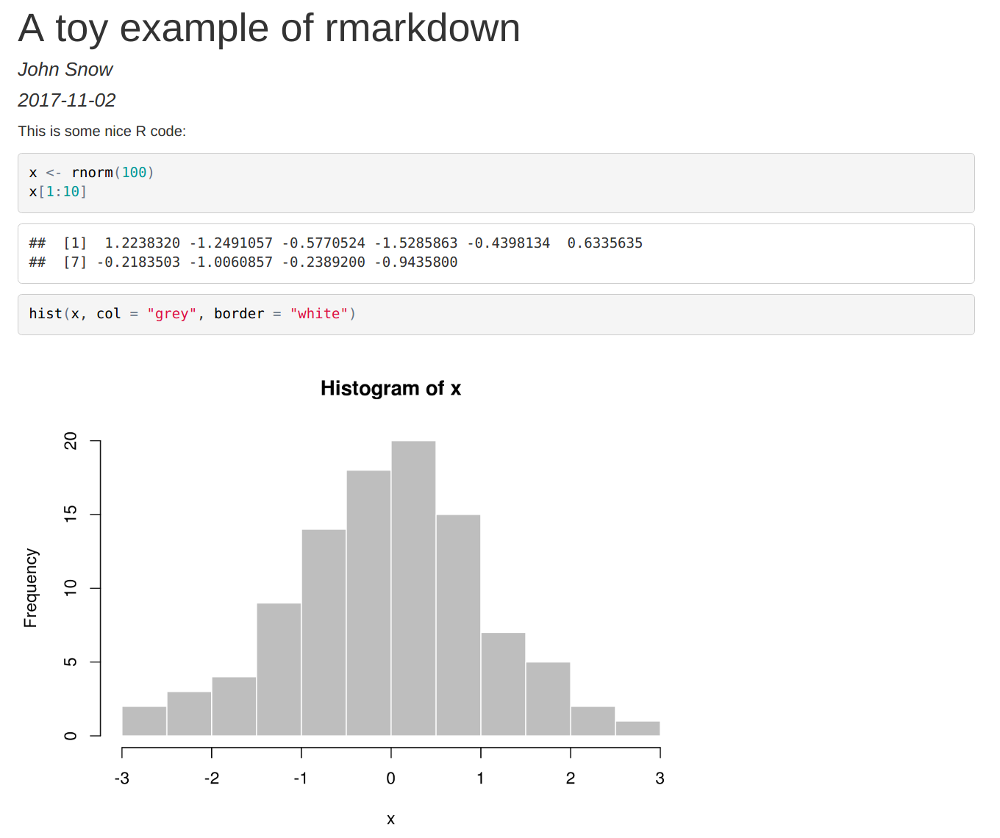
## **`rmarkdown`**: toy example 1/2 {.smaller}
Let us consider the file \texttt{foo.Rmd}:
---
title: "A toy example of rmarkdown"
author: "John Snow"
date: "`r Sys.Date()`"
output: html_document
---

This is some nice R code:
```{r rnorm-example, verbatim = TRUE, eval = FALSE, echo = 2:4}
set.seed(1)
x <- rnorm(100)
x[1:6]
hist(x, col = "grey", border = "white")
```
## **`rmarkdown`**: toy example 1/2 {.smaller}
```{r toy-rmd, eval = FALSE}
rmarkdown::render("foo.Rmd")
```
 # Good practices
## **`rmarkdown`** is just the beginning {.columns-2}
# Good practices
## **`rmarkdown`** is just the beginning {.columns-2}

> - alter your original data
> - have a messy project
> - write non-portable code
> - write horrible code
> - lose work permanently
## How to treat your original data
 > - **do not touch your original data**
> - save it as read-only
> - make copies - you can play with these
> - track the changes made to the original data
## How to avoid messy projects
> - **do not touch your original data**
> - save it as read-only
> - make copies - you can play with these
> - track the changes made to the original data
## How to avoid messy projects
 > - **1 project = 1 folder**
> - subfolders for: data, analyses, figures, manuscripts, ...
> - document the project using a `README` file
> - use the Rstudio projects (if you use Rstudio)
## How to write portable code?
> - **1 project = 1 folder**
> - subfolders for: data, analyses, figures, manuscripts, ...
> - document the project using a `README` file
> - use the Rstudio projects (if you use Rstudio)
## How to write portable code?
 > - avoid absolute paths e.g.:
`my_file <- "C:\project1\data\data.csv"`
> - use the package `here` for portable paths e.g.:
`my_file <- here("data/data.csv")`
> - avoid special characters and spaces in all names e.g.:
`éèçêäÏ*%~!?&`
> - assume case sensitivity:
`FooBar` $\neq$ `foobar` $\neq$ `FOOBAR`
## How to write better code?
 > - name things explicitly
> - settle for one naming convention; `snake_case` is currently recommended for packages
> - document your code using comments (`##`)
> - write simple code, in short sections
> - use current coding standards -- see the `lintr` package
## Example of `lintr`
> - name things explicitly
> - settle for one naming convention; `snake_case` is currently recommended for packages
> - document your code using comments (`##`)
> - write simple code, in short sections
> - use current coding standards -- see the `lintr` package
## Example of `lintr`
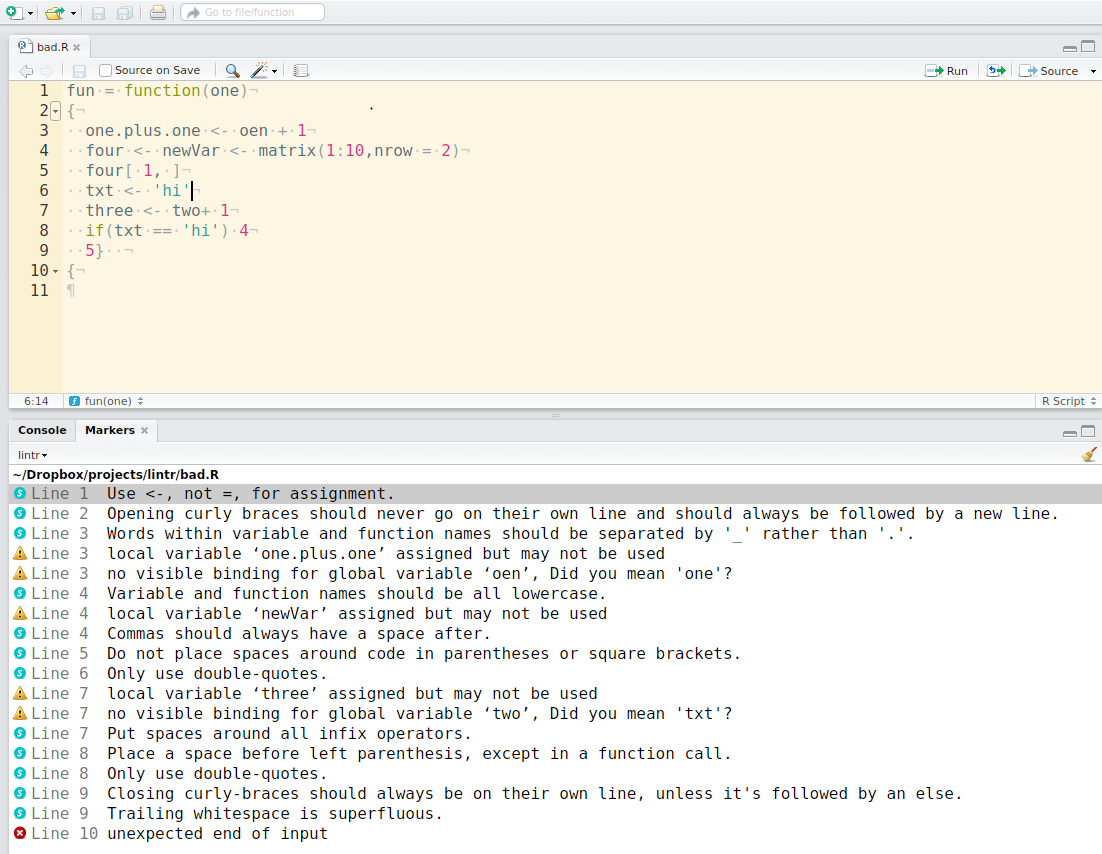
source: [https://github.com/jimhester/lintr](https://github.com/jimhester/lintr)
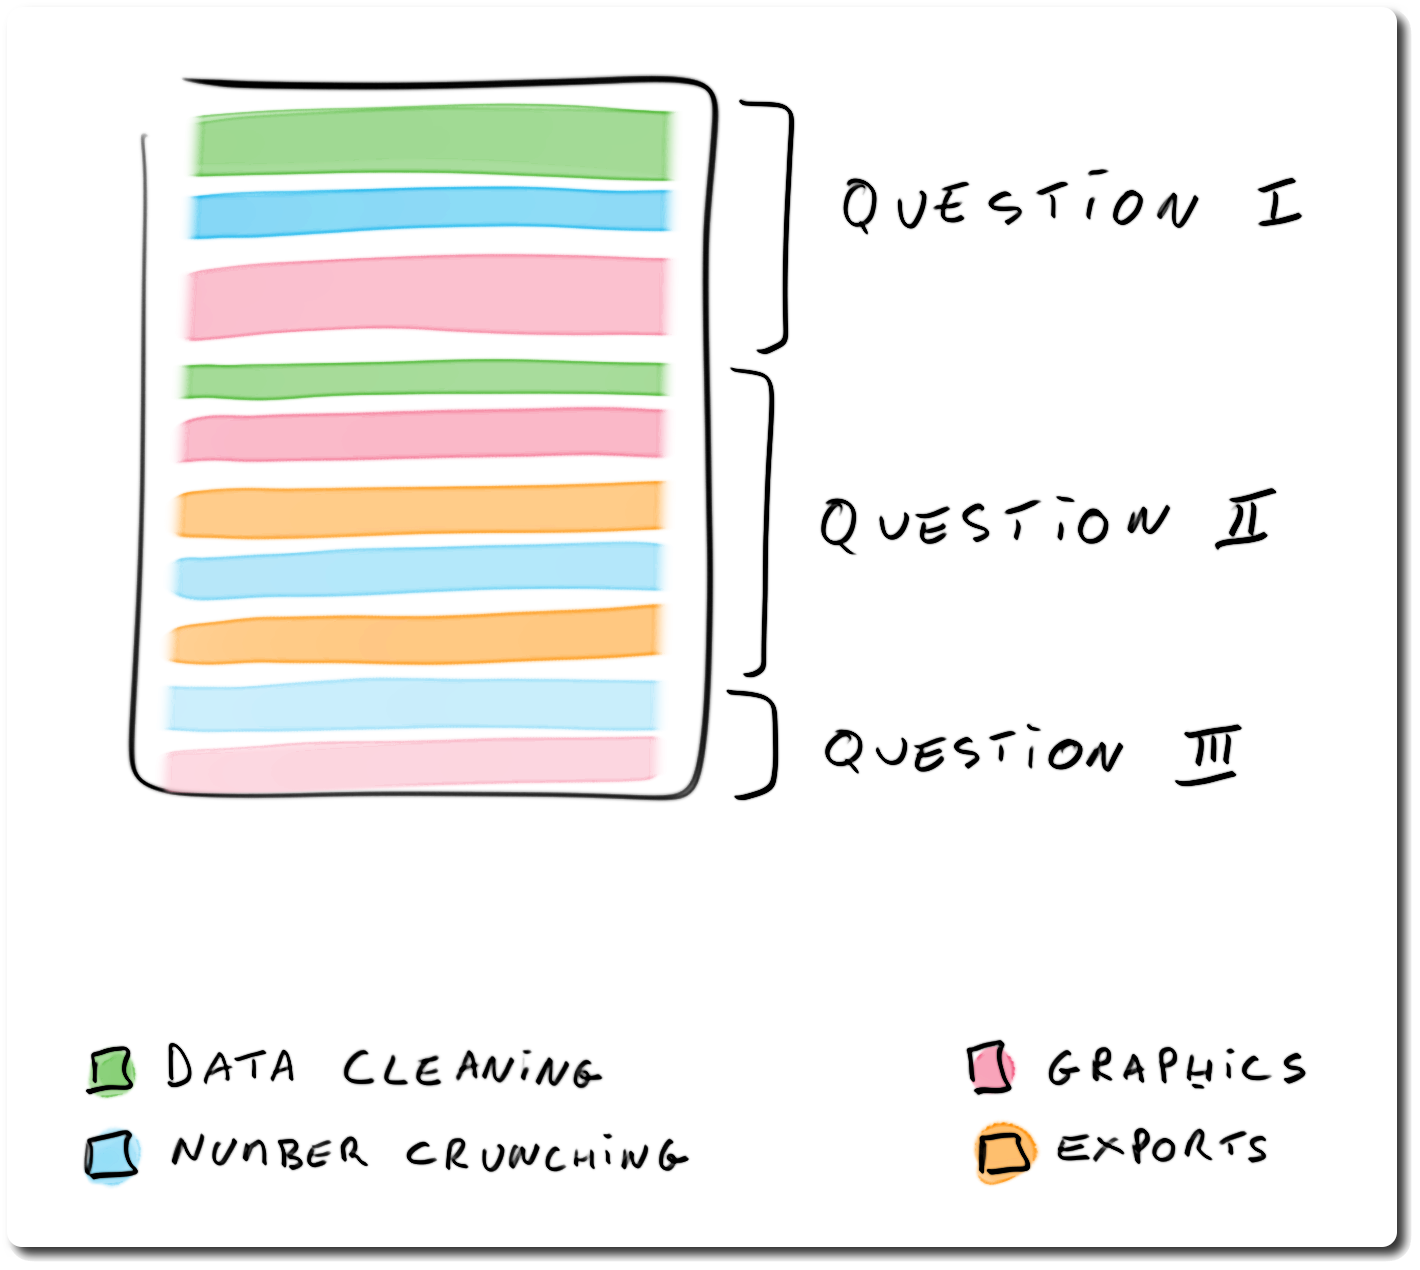
## Structuring analysis reports: question-driven report
> - organised by questions / analysis topics
> - pros: better narrative
> - cons: harder code to follow / review
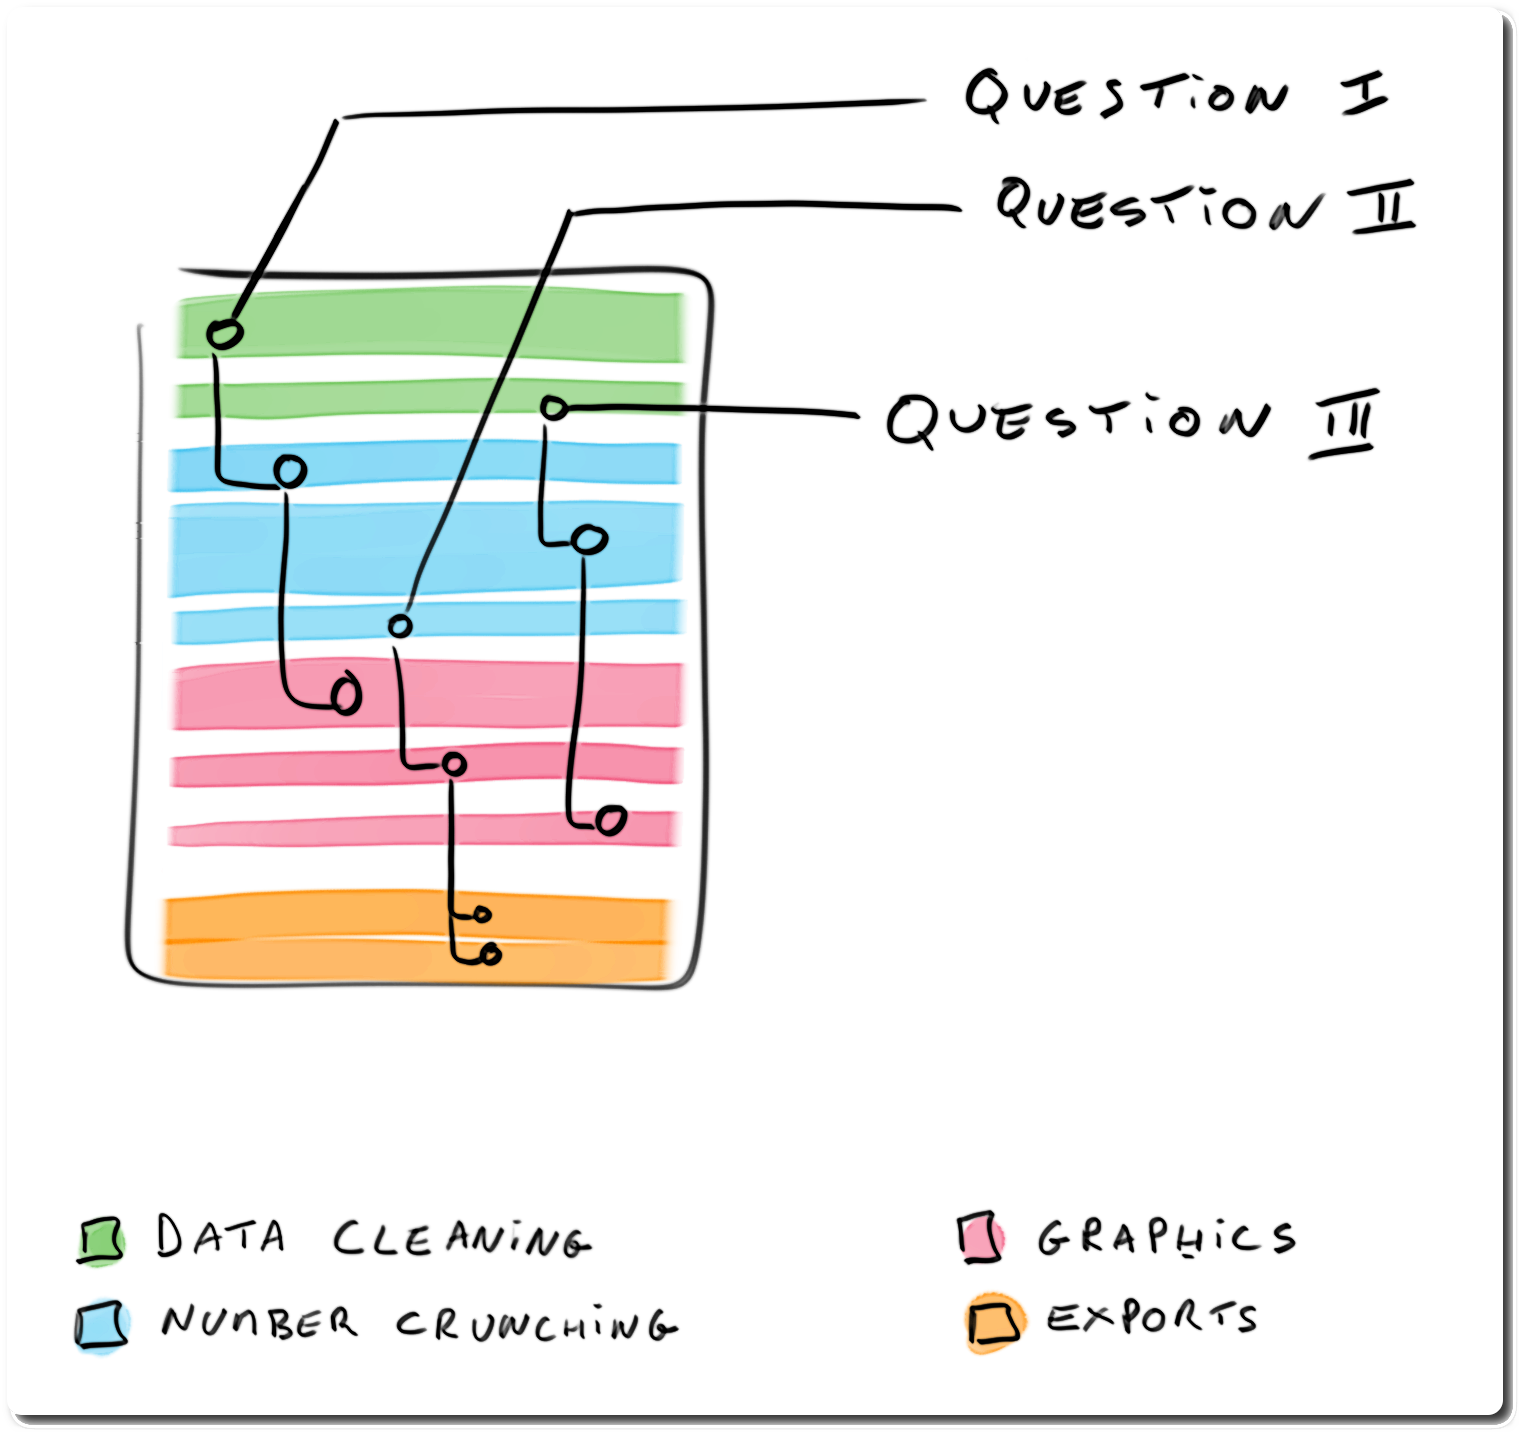
## Structuring analysis reports: code-driven report
> - organised by type of code
> - pros: easier to read / review code
> - cons: narrative harder to follow
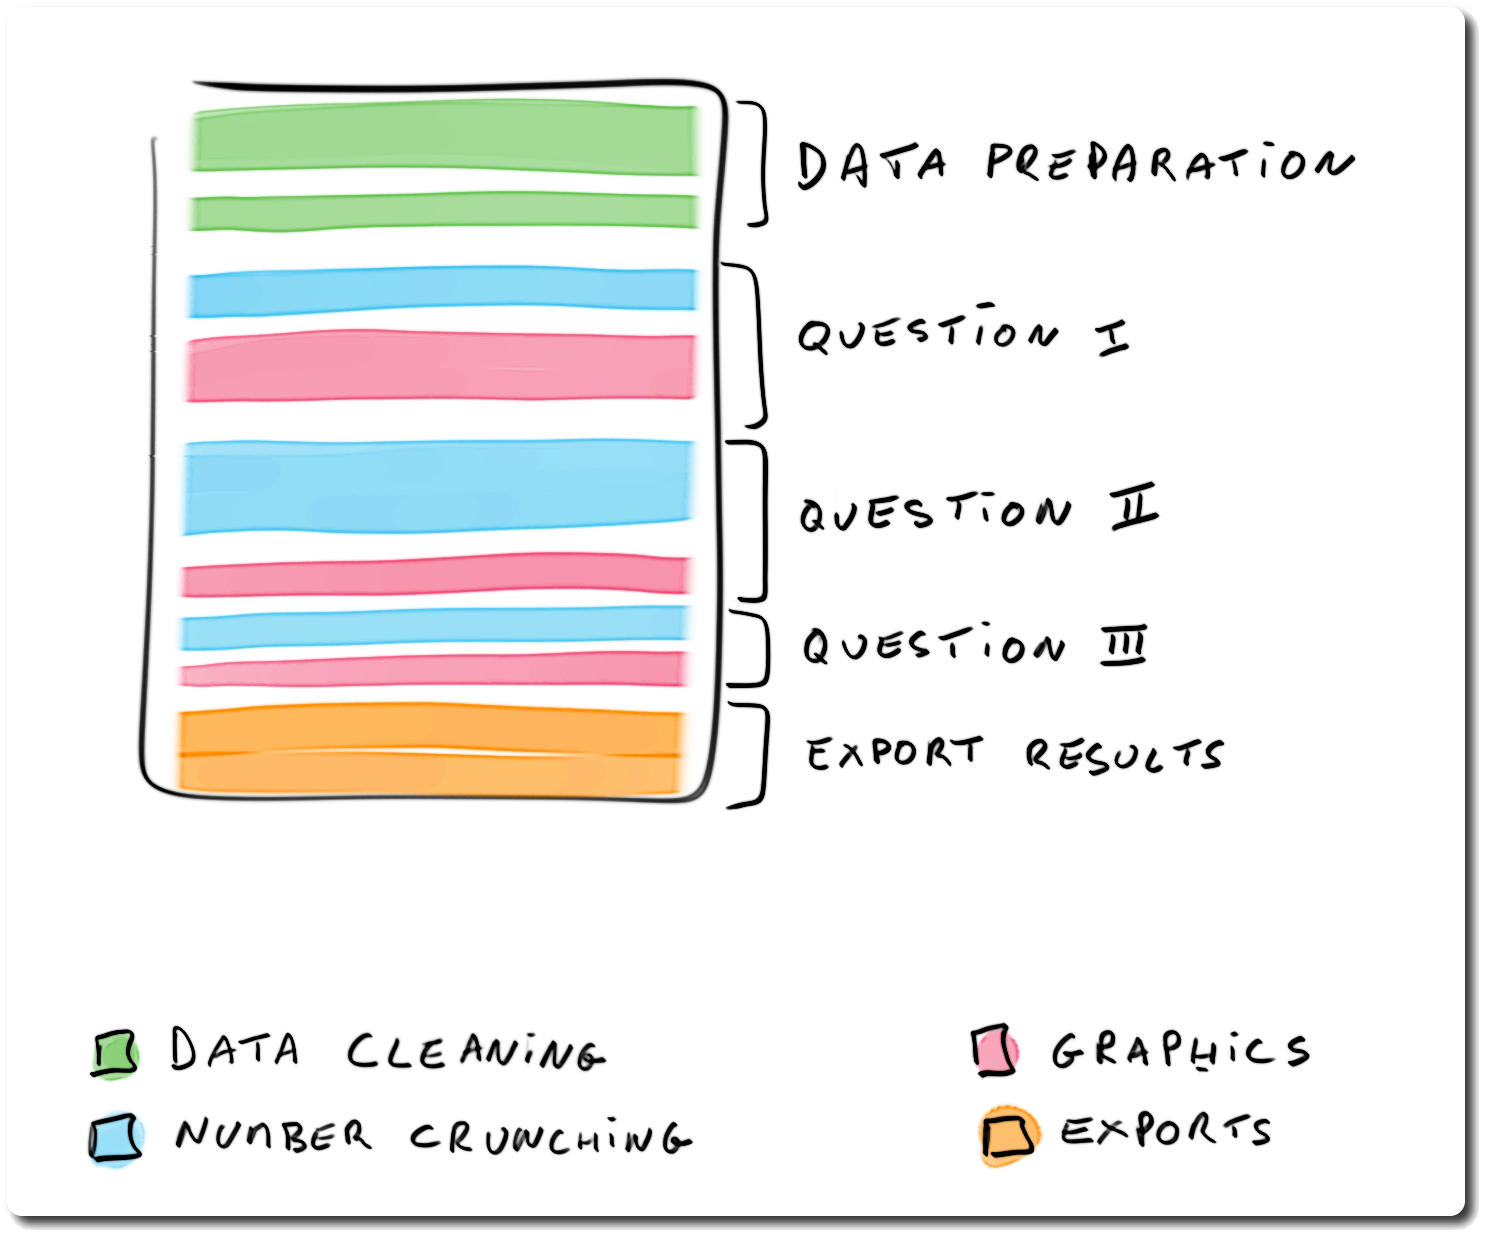
## Structuring analysis reports: hybrid report
> - differentiates **infrastructure** *vs* **analysis** code
> - makes question-specific code *simple*, and *repetitive*
> - pros: narrative and code easier to read
> - cons: harder to design (need frequent re-factoring)
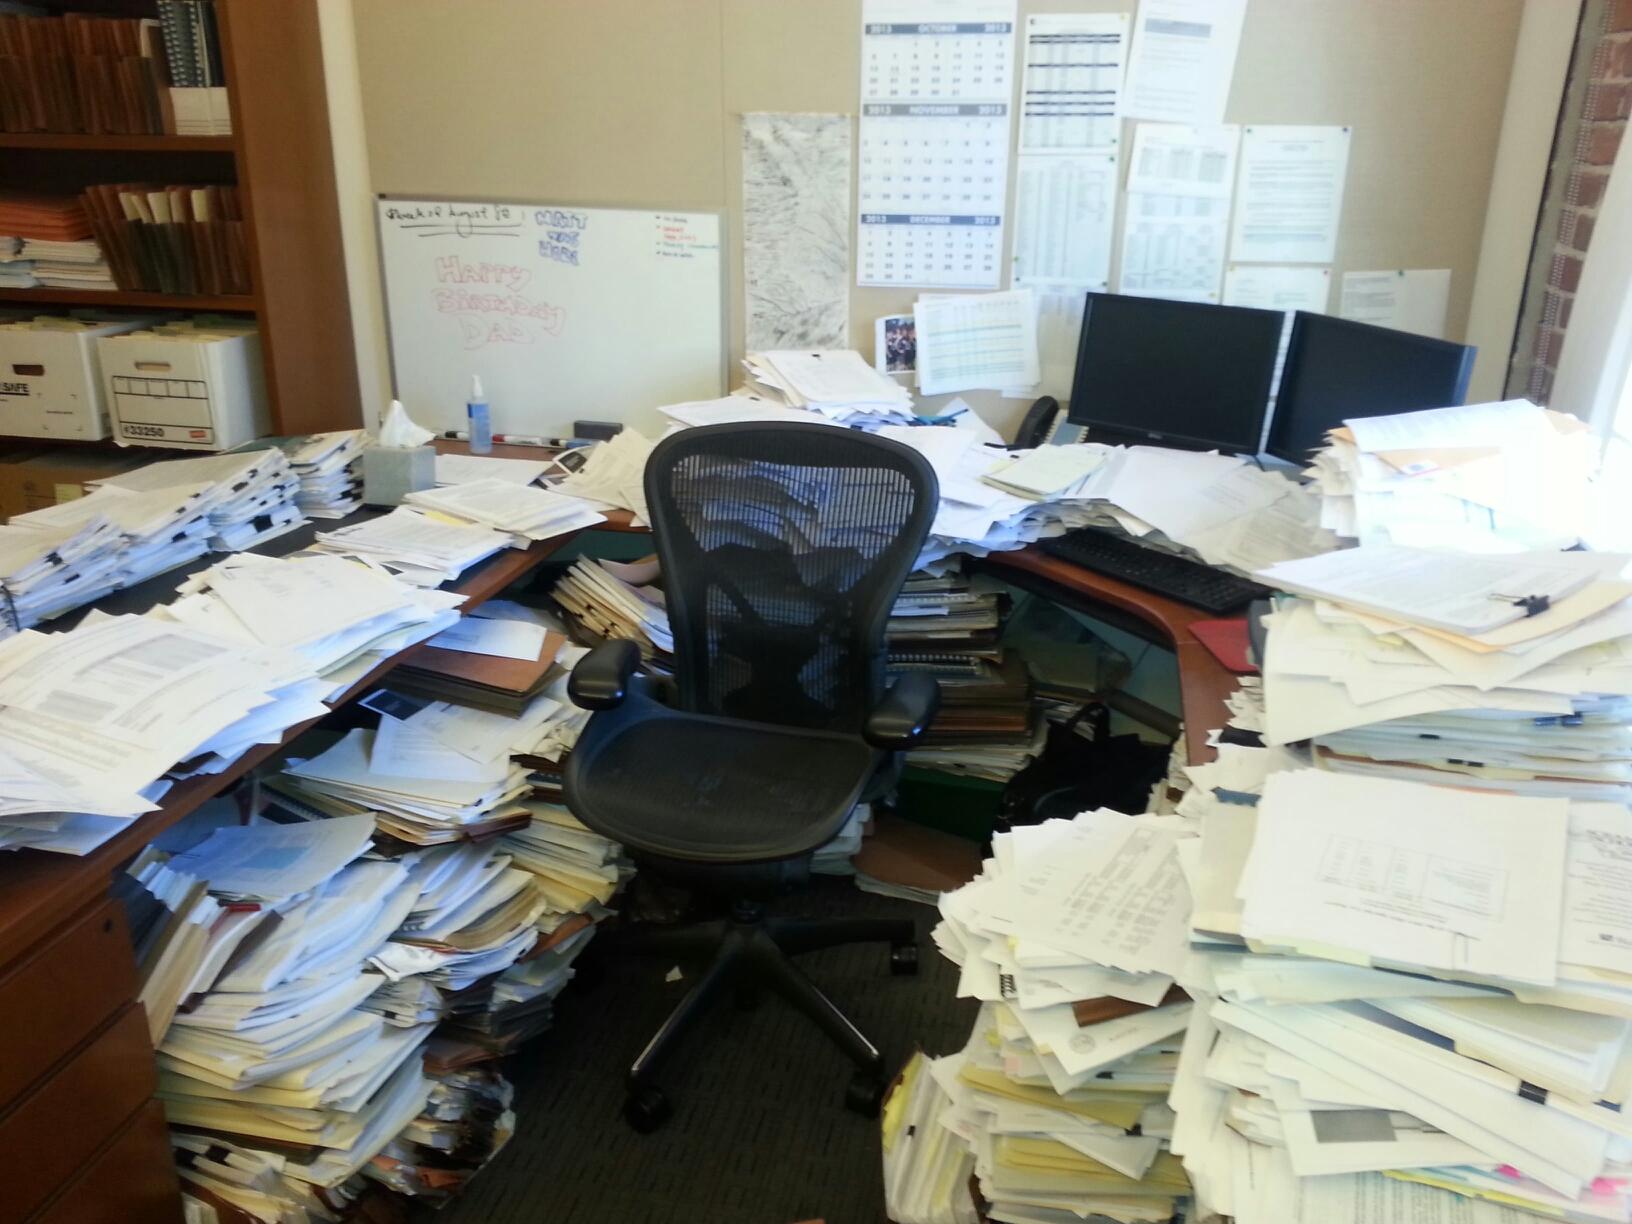
## Do not lose your work!
Because you never know what can happen..
 ## How to avoid losing work?
 > - **never rely on a single computer** to store your work
> - backups are good, syncing with a server is better (e.g. Dropbox)
> - use version numbers to track progress
> - use reportfactory for repeated analysis updates
> - use version control systems (e.g. GIT) for serious
coding projects
## Going further
> - **never rely on a single computer** to store your work
> - backups are good, syncing with a server is better (e.g. Dropbox)
> - use version numbers to track progress
> - use reportfactory for repeated analysis updates
> - use version control systems (e.g. GIT) for serious
coding projects
## Going further

> - check our golden rules for writing analysis reports
> - use report factory templates as starting points
> - use R4epis templates as starting points
##