# rb3  [](https://www.repostatus.org/#active)
[](https://app.codecov.io/gh/wilsonfreitas/rb3?branch=main)
[](https://github.com/ropensci/rb3/actions)
[](https://CRAN.R-project.org/package=rb3)
[](https://cran.r-project.org/package=rb3)
[](https://github.com/ropensci/software-review/issues/534)
## Overview
[B3](https://www.b3.com.br) is the main financial exchange in Brazil,
offering access to trading systems for stocks, futures, options, and
other financial instruments. The `rb3` package provides tools for
downloading, processing, and analyzing market data from B3, including:
- **Stocks & Equities**: Historical price data through COTAHIST files
- **Futures Contracts**: Settlement prices for futures contracts
- **Yield Curves**: Historical yield curves calculated from futures
contracts
- **ETFs & BDRs**: Data for Exchange Traded Funds and Brazilian
Depositary Receipts
- **REITs (FIIs)**: Data for Brazilian Real Estate Investment Trusts
- **Options**: Equity and index options contracts
- **Market Indices**: B3 indices composition and historical data
The package uses webscraping tools to obtain data directly from [B3’s
website](https://www.b3.com.br), making it accessible in R as structured
datasets. These datasets are valuable for financial analysis, academic
research, and investment decision-making.
## Installation
``` r
# From CRAN (stable version)
install.packages("rb3")
# Development version from GitHub
if (!require(devtools)) install.packages("devtools")
devtools::install_github("ropensci/rb3")
```
## Basic Usage
### Downloading Data
Execute the following code to download all data you need to start
working with `rb3`:
``` r
# Set the rb3.cachedir folder - it must be executed before loading rb3 package
options(rb3.cachedir = "/path/to/your/custom/folder")
library(rb3)
library(bizdays)
# download COTAHIST data from 2000 to 2025
fetch_marketdata("b3-cotahist-yearly", year = 2000:2025)
# download futures settlement prices from 2000 to 2025
fetch_marketdata("b3-futures-settlement-prices", refdate = bizseq("2000-01-01", Sys.Date(), "Brazil/B3"))
# download yield curves from 2018 to 2025
fetch_marketdata("b3-reference-rates",
refdate = bizseq("2018-01-01", Sys.Date(), "Brazil/B3"),
curve_name = c("DIC", "DOC", "PRE")
)
# download indexes composition data - it is necessary to execute `indexes_get()`
fetch_marketdata("b3-indexes-composition")
# download current portfolio for all indexes
fetch_marketdata("b3-indexes-current-portfolio", index = indexes_get(), throttle = TRUE)
# download theoretical portfolio for all indexes
fetch_marketdata("b3-indexes-theoretical-portfolio", index = indexes_get(), throttle = TRUE)
# download historical data for all indexes
fetch_marketdata("b3-indexes-historical-data", index = indexes_get(), year = 2000:2025, throttle = TRUE)
```
### Market Data Templates
The `rb3` package uses a template system to standardize the downloading
and processing of different data types. To see available templates:
``` r
library(tidyverse)
library(bizdays)
library(rb3)
# List available templates
list_templates()
#> # A tibble: 9 × 2
#> Template Description
#>
#> 1 b3-bvbg-086 Arquivo de Preços de Mercado - BVBG-086
#> 2 b3-cotahist-daily Cotações Históricas do Pregão de Ações - Arq…
#> 3 b3-cotahist-yearly Cotações Históricas do Pregão de Ações - Arq…
#> 4 b3-futures-settlement-prices Preços de Ajustes Diários de Contratos Futur…
#> 5 b3-indexes-composition Composição dos índices da B3
#> 6 b3-indexes-current-portfolio Carteira teórica corrente dos índices da B3 …
#> 7 b3-indexes-historical-data Dados históricos e estatísticas dos índices …
#> 8 b3-indexes-theoretical-portfolio Carteira Teórica dos índices da B3 com pesos…
#> 9 b3-reference-rates Taxas referenciais
```
### Downloading Market Data
The main function for fetching data is `fetch_marketdata()`, which
downloads data based on a template and parameters:
``` r
# Download yield curve data for specific dates
fetch_marketdata("b3-reference-rates",
refdate = as.Date("2024-01-31"),
curve_name = "PRE"
)
# Download futures settlement prices
fetch_marketdata("b3-futures-settlement-prices",
refdate = as.Date("2024-01-31")
)
# Download yearly COTAHIST files
fetch_marketdata("b3-cotahist-yearly", year = 2023)
```
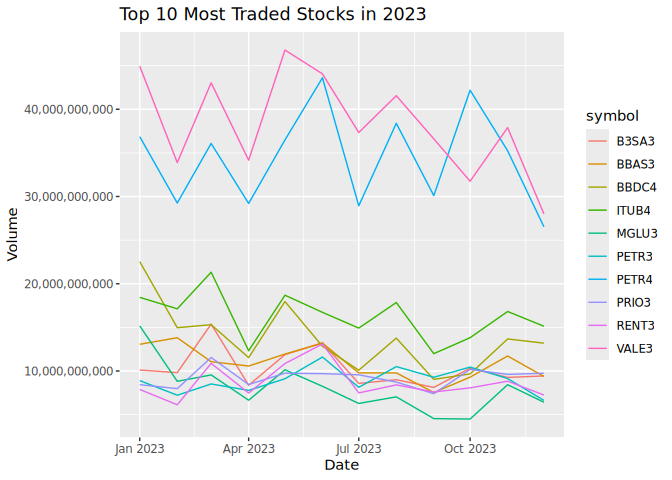
### Working with Historical Equity Data
``` r
# Access the data
ch <- cotahist_get("yearly")
# Filter for stocks
eq <- ch |>
filter(year(refdate) == 2023) |>
cotahist_filter_equity() |>
collect()
```
``` r
# Get top 10 most traded stocks
symbols <- eq |>
group_by(symbol) |>
summarise(volume = sum(volume)) |>
arrange(desc(volume)) |>
head(10) |>
pull(symbol)
# show top 10 most traded stocks
symbols
#> [1] "VALE3" "PETR4" "ITUB4" "BBDC4" "BBAS3" "B3SA3" "PRIO3" "PETR3" "RENT3"
#> [10] "MGLU3"
```
``` r
# Plot the most traded stocks grouped by month
eq |>
filter(symbol %in% symbols) |>
mutate(refdate = floor_date(refdate, "month")) |>
group_by(refdate, symbol) |>
summarise(volume = sum(volume)) |>
# Plot
ggplot(aes(x = refdate, y = volume, color = symbol)) +
geom_line() +
labs(
title = "Top 10 Most Traded Stocks in 2023",
x = "Date",
y = "Volume"
) +
scale_y_continuous(labels = scales::comma)
#> `summarise()` has grouped output by 'refdate'. You can override using the
#> `.groups` argument.
```
[](https://www.repostatus.org/#active)
[](https://app.codecov.io/gh/wilsonfreitas/rb3?branch=main)
[](https://github.com/ropensci/rb3/actions)
[](https://CRAN.R-project.org/package=rb3)
[](https://cran.r-project.org/package=rb3)
[](https://github.com/ropensci/software-review/issues/534)
## Overview
[B3](https://www.b3.com.br) is the main financial exchange in Brazil,
offering access to trading systems for stocks, futures, options, and
other financial instruments. The `rb3` package provides tools for
downloading, processing, and analyzing market data from B3, including:
- **Stocks & Equities**: Historical price data through COTAHIST files
- **Futures Contracts**: Settlement prices for futures contracts
- **Yield Curves**: Historical yield curves calculated from futures
contracts
- **ETFs & BDRs**: Data for Exchange Traded Funds and Brazilian
Depositary Receipts
- **REITs (FIIs)**: Data for Brazilian Real Estate Investment Trusts
- **Options**: Equity and index options contracts
- **Market Indices**: B3 indices composition and historical data
The package uses webscraping tools to obtain data directly from [B3’s
website](https://www.b3.com.br), making it accessible in R as structured
datasets. These datasets are valuable for financial analysis, academic
research, and investment decision-making.
## Installation
``` r
# From CRAN (stable version)
install.packages("rb3")
# Development version from GitHub
if (!require(devtools)) install.packages("devtools")
devtools::install_github("ropensci/rb3")
```
## Basic Usage
### Downloading Data
Execute the following code to download all data you need to start
working with `rb3`:
``` r
# Set the rb3.cachedir folder - it must be executed before loading rb3 package
options(rb3.cachedir = "/path/to/your/custom/folder")
library(rb3)
library(bizdays)
# download COTAHIST data from 2000 to 2025
fetch_marketdata("b3-cotahist-yearly", year = 2000:2025)
# download futures settlement prices from 2000 to 2025
fetch_marketdata("b3-futures-settlement-prices", refdate = bizseq("2000-01-01", Sys.Date(), "Brazil/B3"))
# download yield curves from 2018 to 2025
fetch_marketdata("b3-reference-rates",
refdate = bizseq("2018-01-01", Sys.Date(), "Brazil/B3"),
curve_name = c("DIC", "DOC", "PRE")
)
# download indexes composition data - it is necessary to execute `indexes_get()`
fetch_marketdata("b3-indexes-composition")
# download current portfolio for all indexes
fetch_marketdata("b3-indexes-current-portfolio", index = indexes_get(), throttle = TRUE)
# download theoretical portfolio for all indexes
fetch_marketdata("b3-indexes-theoretical-portfolio", index = indexes_get(), throttle = TRUE)
# download historical data for all indexes
fetch_marketdata("b3-indexes-historical-data", index = indexes_get(), year = 2000:2025, throttle = TRUE)
```
### Market Data Templates
The `rb3` package uses a template system to standardize the downloading
and processing of different data types. To see available templates:
``` r
library(tidyverse)
library(bizdays)
library(rb3)
# List available templates
list_templates()
#> # A tibble: 9 × 2
#> Template Description
#>
#> 1 b3-bvbg-086 Arquivo de Preços de Mercado - BVBG-086
#> 2 b3-cotahist-daily Cotações Históricas do Pregão de Ações - Arq…
#> 3 b3-cotahist-yearly Cotações Históricas do Pregão de Ações - Arq…
#> 4 b3-futures-settlement-prices Preços de Ajustes Diários de Contratos Futur…
#> 5 b3-indexes-composition Composição dos índices da B3
#> 6 b3-indexes-current-portfolio Carteira teórica corrente dos índices da B3 …
#> 7 b3-indexes-historical-data Dados históricos e estatísticas dos índices …
#> 8 b3-indexes-theoretical-portfolio Carteira Teórica dos índices da B3 com pesos…
#> 9 b3-reference-rates Taxas referenciais
```
### Downloading Market Data
The main function for fetching data is `fetch_marketdata()`, which
downloads data based on a template and parameters:
``` r
# Download yield curve data for specific dates
fetch_marketdata("b3-reference-rates",
refdate = as.Date("2024-01-31"),
curve_name = "PRE"
)
# Download futures settlement prices
fetch_marketdata("b3-futures-settlement-prices",
refdate = as.Date("2024-01-31")
)
# Download yearly COTAHIST files
fetch_marketdata("b3-cotahist-yearly", year = 2023)
```
### Working with Historical Equity Data
``` r
# Access the data
ch <- cotahist_get("yearly")
# Filter for stocks
eq <- ch |>
filter(year(refdate) == 2023) |>
cotahist_filter_equity() |>
collect()
```
``` r
# Get top 10 most traded stocks
symbols <- eq |>
group_by(symbol) |>
summarise(volume = sum(volume)) |>
arrange(desc(volume)) |>
head(10) |>
pull(symbol)
# show top 10 most traded stocks
symbols
#> [1] "VALE3" "PETR4" "ITUB4" "BBDC4" "BBAS3" "B3SA3" "PRIO3" "PETR3" "RENT3"
#> [10] "MGLU3"
```
``` r
# Plot the most traded stocks grouped by month
eq |>
filter(symbol %in% symbols) |>
mutate(refdate = floor_date(refdate, "month")) |>
group_by(refdate, symbol) |>
summarise(volume = sum(volume)) |>
# Plot
ggplot(aes(x = refdate, y = volume, color = symbol)) +
geom_line() +
labs(
title = "Top 10 Most Traded Stocks in 2023",
x = "Date",
y = "Volume"
) +
scale_y_continuous(labels = scales::comma)
#> `summarise()` has grouped output by 'refdate'. You can override using the
#> `.groups` argument.
```
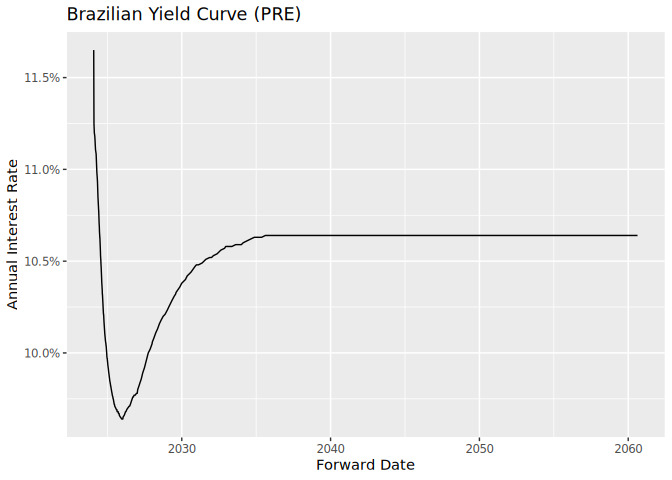
 ### Yield Curve Analysis
``` r
# Get Brazilian nominal yield curve (PRE)
yc_data <- yc_brl_get() |>
filter(refdate == "2024-01-31") |>
collect()
```
``` r
# Plot the yield curve
ggplot(yc_data, aes(x = forward_date, y = r_252)) +
geom_line() +
labs(
title = "Brazilian Yield Curve (PRE)",
x = "Forward Date",
y = "Annual Interest Rate"
) +
scale_y_continuous(labels = scales::percent)
```
### Yield Curve Analysis
``` r
# Get Brazilian nominal yield curve (PRE)
yc_data <- yc_brl_get() |>
filter(refdate == "2024-01-31") |>
collect()
```
``` r
# Plot the yield curve
ggplot(yc_data, aes(x = forward_date, y = r_252)) +
geom_line() +
labs(
title = "Brazilian Yield Curve (PRE)",
x = "Forward Date",
y = "Annual Interest Rate"
) +
scale_y_continuous(labels = scales::percent)
```
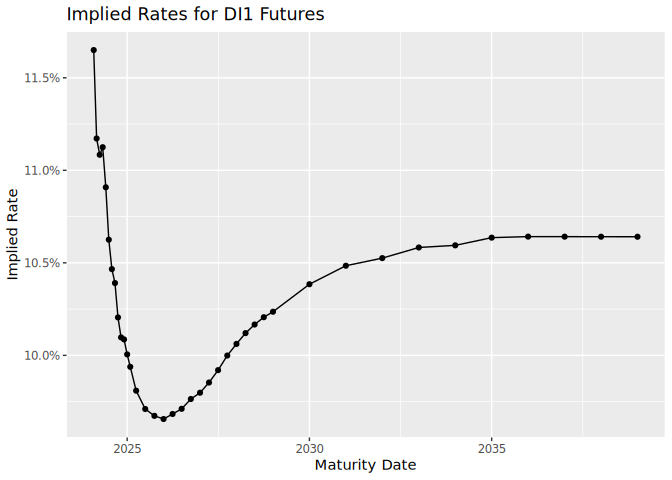
 ### Futures Contracts
``` r
# Get futures settlement prices
futures_data <- futures_get() |>
filter(commodity == "DI1") |>
collect()
```
``` r
# Calculate implied rates
di1_futures <- futures_data |>
mutate(
maturity_date = maturitycode2date(maturity_code),
business_days = bizdays(refdate, maturity_date, "Brazil/ANBIMA"),
implied_rate = (100000 / price)^(252 / business_days) - 1
)
# Plot the implied rates
ggplot(di1_futures, aes(x = maturity_date, y = implied_rate)) +
geom_line() +
geom_point() +
labs(
title = "Implied Rates for DI1 Futures",
x = "Maturity Date",
y = "Implied Rate"
) +
scale_y_continuous(labels = scales::percent)
```
### Futures Contracts
``` r
# Get futures settlement prices
futures_data <- futures_get() |>
filter(commodity == "DI1") |>
collect()
```
``` r
# Calculate implied rates
di1_futures <- futures_data |>
mutate(
maturity_date = maturitycode2date(maturity_code),
business_days = bizdays(refdate, maturity_date, "Brazil/ANBIMA"),
implied_rate = (100000 / price)^(252 / business_days) - 1
)
# Plot the implied rates
ggplot(di1_futures, aes(x = maturity_date, y = implied_rate)) +
geom_line() +
geom_point() +
labs(
title = "Implied Rates for DI1 Futures",
x = "Maturity Date",
y = "Implied Rate"
) +
scale_y_continuous(labels = scales::percent)
```
 ## Documentation
For comprehensive documentation and examples, visit:
- [Package Website](https://ropensci.github.io/rb3/)
- Vignettes (in-depth tutorials):
- [Getting
Started](https://ropensci.github.io/rb3/articles/Getting-started.html)
- [Fetching Historical Equity
Data](https://ropensci.github.io/rb3/articles/Fetching-historical-equity-data.html)
- [Analyzing B3 Index
Data](https://ropensci.github.io/rb3/articles/Fetching-historical-index-data.html)
- [How to Compute Historical Rates from B3 Future
Prices](https://ropensci.github.io/rb3/articles/Fetching-historical-future-rates.html)
- [Fetching B3 Yield
Curves](https://ropensci.github.io/rb3/articles/Fetching-historical-yield-curve.html)
## Citation
If you use `rb3` in your research, please cite it:
To cite rb3 in publications use:
Download and parse public files released by B3 and convert them into
useful formats and data structures common to data analysis
practitioners.
A BibTeX entry for LaTeX users is
@Manual{rb3-package,
title = {Download and Parse Public Data Released by B3 Exchange},
author = {Wilson Freitas and Marcelo Perlin},
year = {2023},
note = {R package version 0.0.8},
url = {https://github.com/ropensci/rb3},
}
## Documentation
For comprehensive documentation and examples, visit:
- [Package Website](https://ropensci.github.io/rb3/)
- Vignettes (in-depth tutorials):
- [Getting
Started](https://ropensci.github.io/rb3/articles/Getting-started.html)
- [Fetching Historical Equity
Data](https://ropensci.github.io/rb3/articles/Fetching-historical-equity-data.html)
- [Analyzing B3 Index
Data](https://ropensci.github.io/rb3/articles/Fetching-historical-index-data.html)
- [How to Compute Historical Rates from B3 Future
Prices](https://ropensci.github.io/rb3/articles/Fetching-historical-future-rates.html)
- [Fetching B3 Yield
Curves](https://ropensci.github.io/rb3/articles/Fetching-historical-yield-curve.html)
## Citation
If you use `rb3` in your research, please cite it:
To cite rb3 in publications use:
Download and parse public files released by B3 and convert them into
useful formats and data structures common to data analysis
practitioners.
A BibTeX entry for LaTeX users is
@Manual{rb3-package,
title = {Download and Parse Public Data Released by B3 Exchange},
author = {Wilson Freitas and Marcelo Perlin},
year = {2023},
note = {R package version 0.0.8},
url = {https://github.com/ropensci/rb3},
}