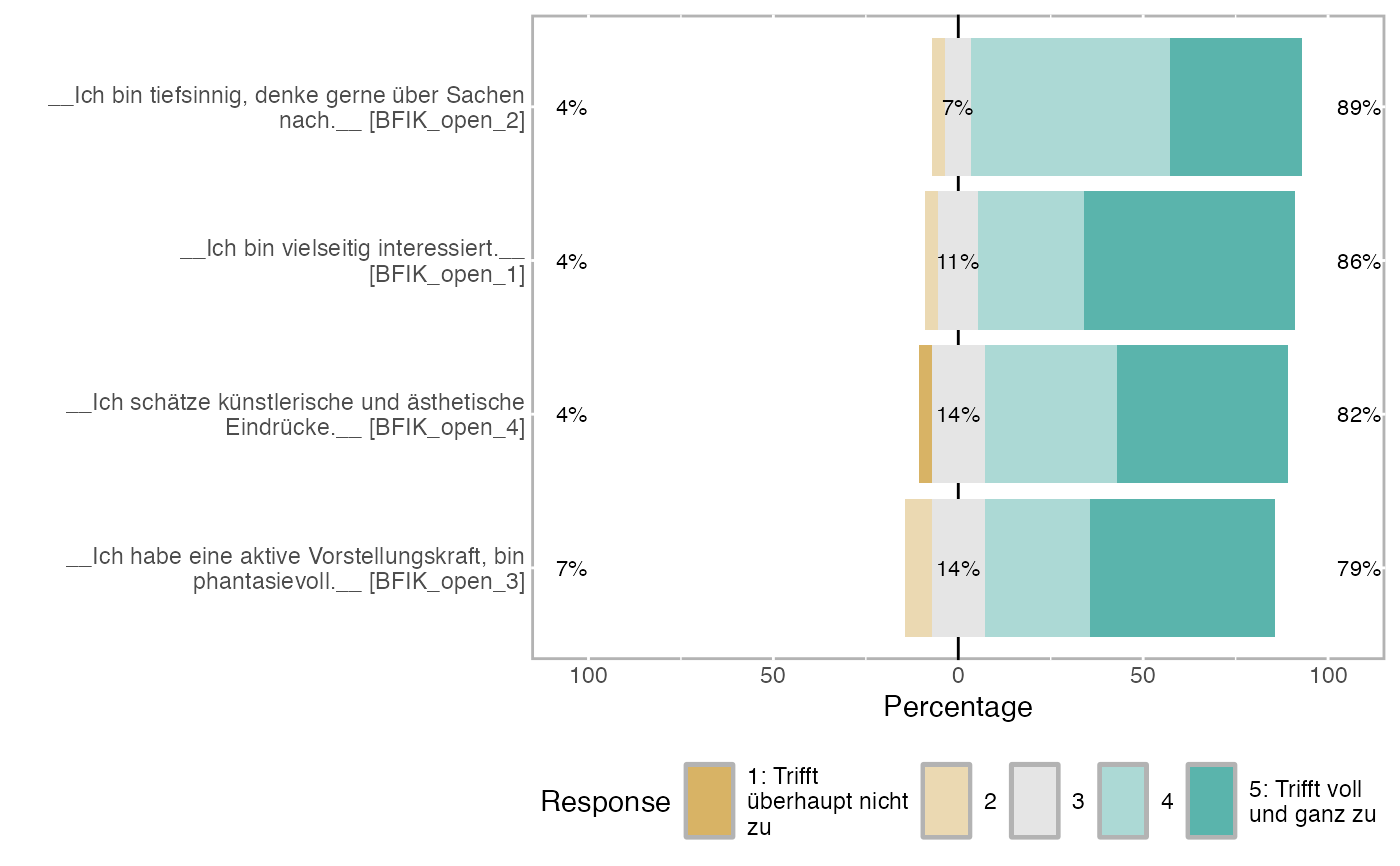
Pass a data.frame containing several items composing one scale, get a
likert::likert() object, which you can plot.
Intelligently makes use of labels and value labels if present.
Examples
data("bfi", package = "codebook")
open_items <- paste0("BFIK_open_",1:4)
suppressWarnings(graphics::plot(likert_from_items(bfi[, open_items])))