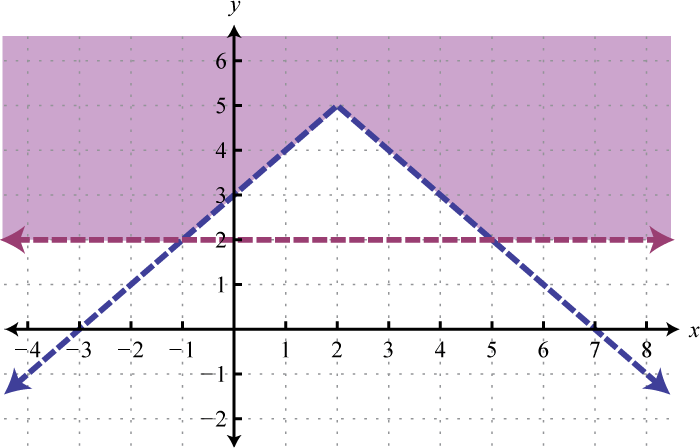
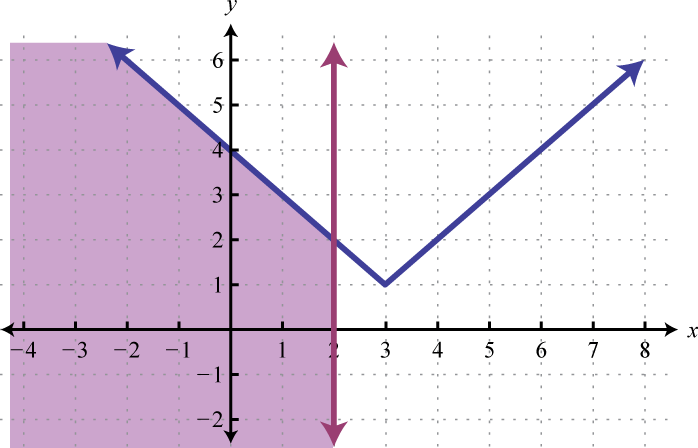
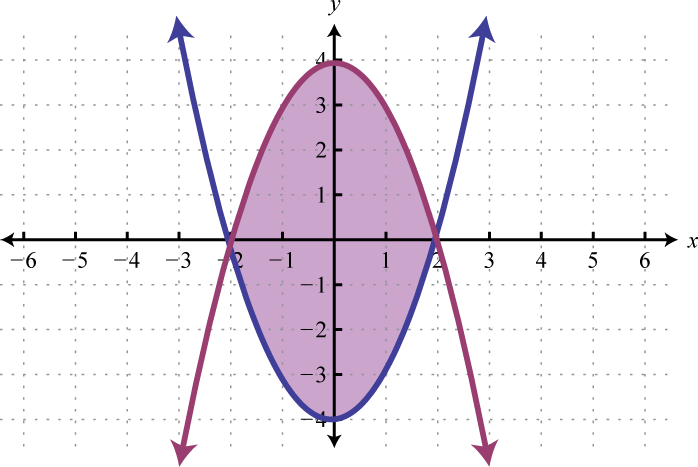
A system of inequalitiesA set of two or more inequalities with the same variables. consists of a set of two or more inequalities with the same variables. The inequalities define the conditions that are to be considered simultaneously. For example,
We know that each inequality in the set contains infinitely many ordered pair solutions defined by a region in a rectangular coordinate plane. When considering two of these inequalities together, the intersection of these sets will define the set of simultaneous ordered pair solutions. When we graph each of the above inequalities separately we have:

And when graphed on the same set of axes, the intersection can be determined.
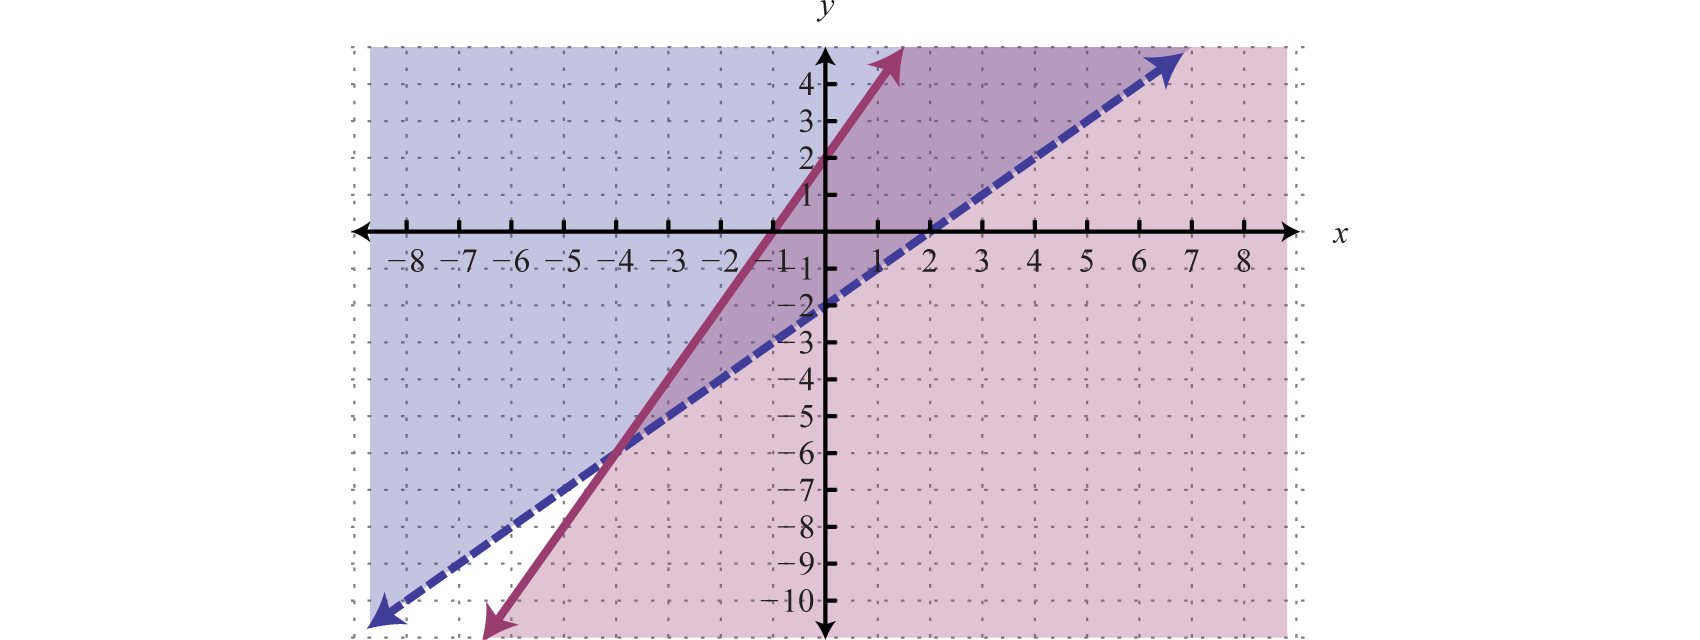
The intersection is shaded darker and the final graph of the solution set will be presented as follows:
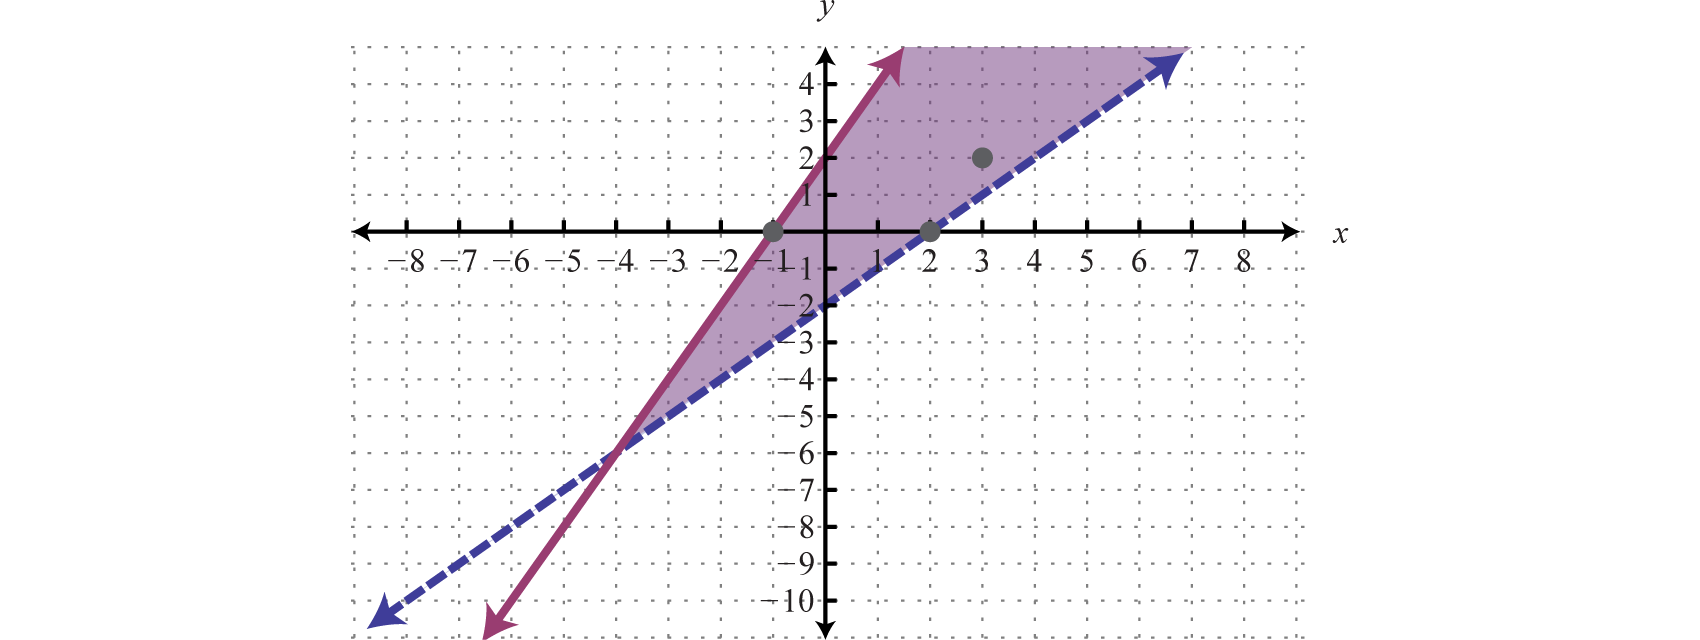
The graph suggests that (3, 2) is a solution because it is in the intersection. To verify this, we can show that it solves both of the original inequalities as follows:
Points on the solid boundary are included in the set of simultaneous solutions and points on the dashed boundary are not. Consider the point (−1, 0) on the solid boundary defined by and verify that it solves the original system:
Notice that this point satisfies both inequalities and thus is included in the solution set. Now consider the point (2, 0) on the dashed boundary defined by and verify that it does not solve the original system:
This point does not satisfy both inequalities and thus is not included in the solution set.
Determine whether or not (−3, 3) is a solution to the following system:
Solution:
Substitute the coordinates of (x, y) = (−3, 3) into both inequalities.
Answer: (−3, 3) is not a solution; it does not satisfy both inequalities.
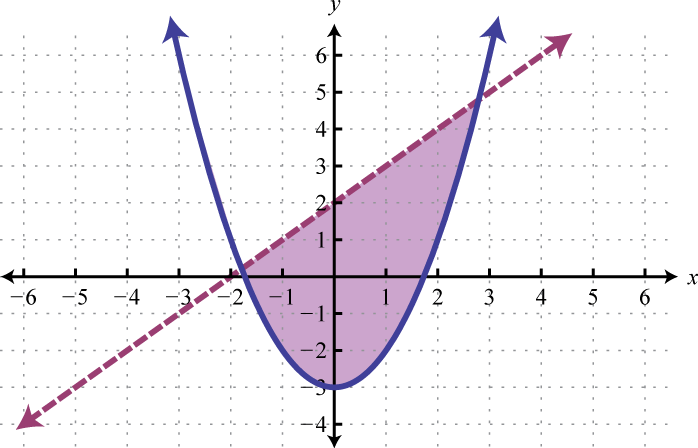
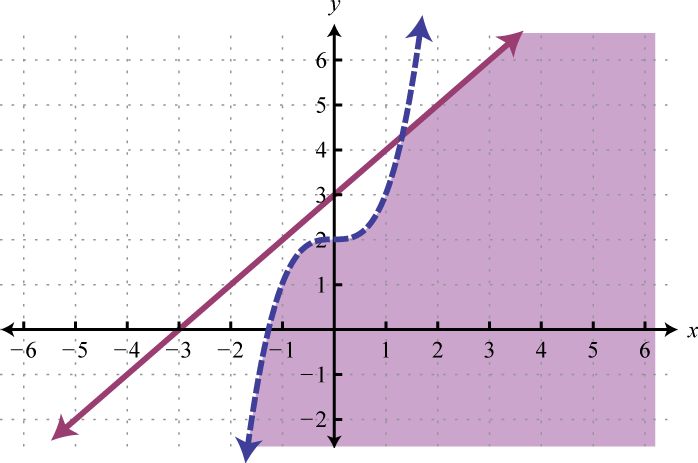
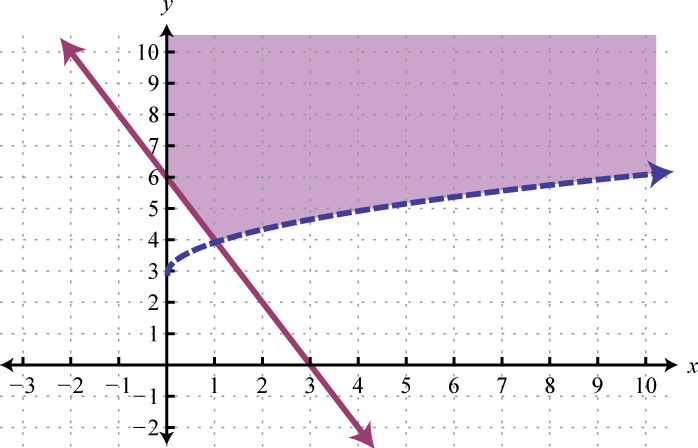
We can graph the solutions of systems that contain nonlinear inequalities in a similar manner. For example, both solution sets of the following inequalities can be graphed on the same set of axes:
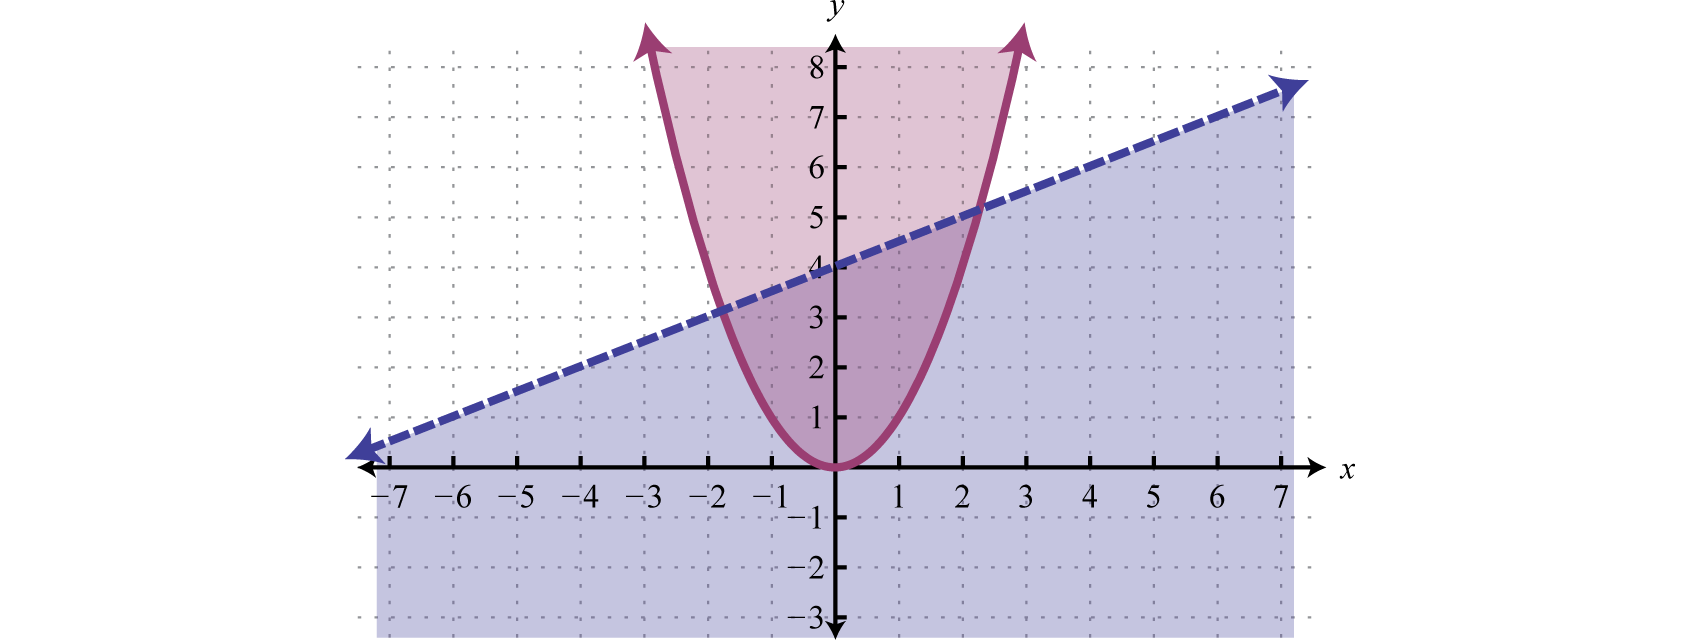
And the intersection of both regions contains the region of simultaneous ordered pair solutions.
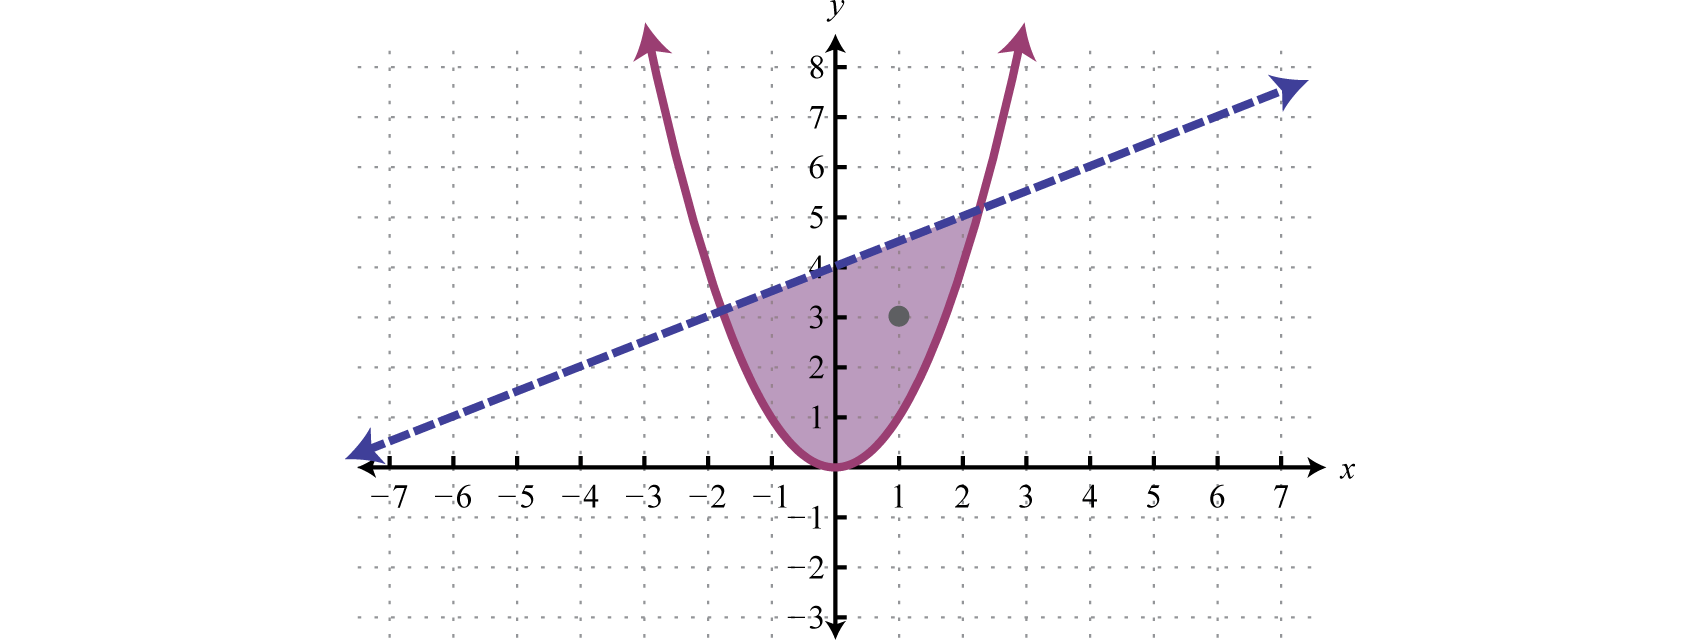
From the graph, we expect the ordered pair (1, 3) to solve both inequalities.
Solutions to a system of inequalities are the ordered pairs that solve all the inequalities in the system. Therefore, to solve these systems we graph the solution sets of the inequalities on the same set of axes and determine where they intersect. This intersection, or overlap, will define the region of common ordered pair solutions.
Graph the solution set: .
Solution:
To facilitate the graphing process, we first solve for y.
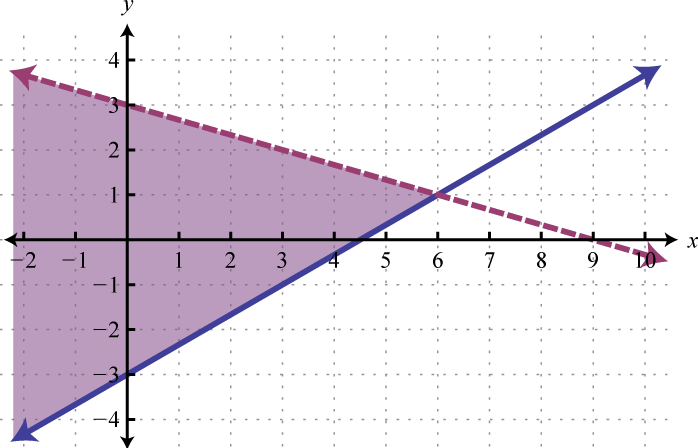
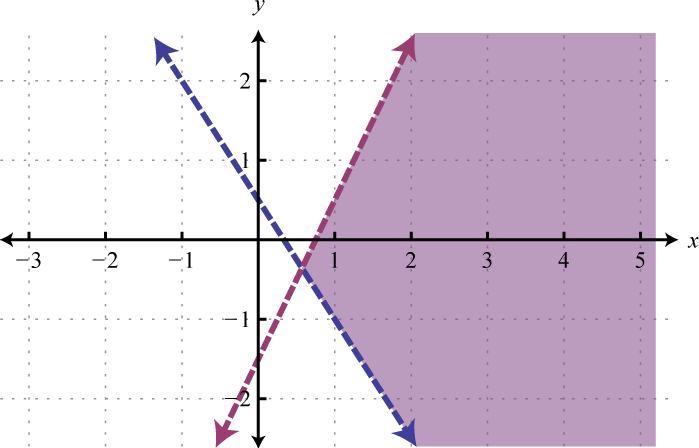
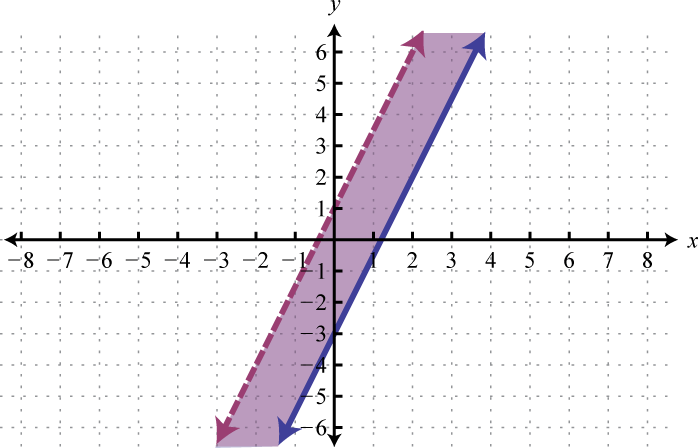
For the first inequality, we use a dashed boundary defined by and shade all points above the line. For the second inequality, we use a solid boundary defined by and shade all points below. The intersection is darkened.
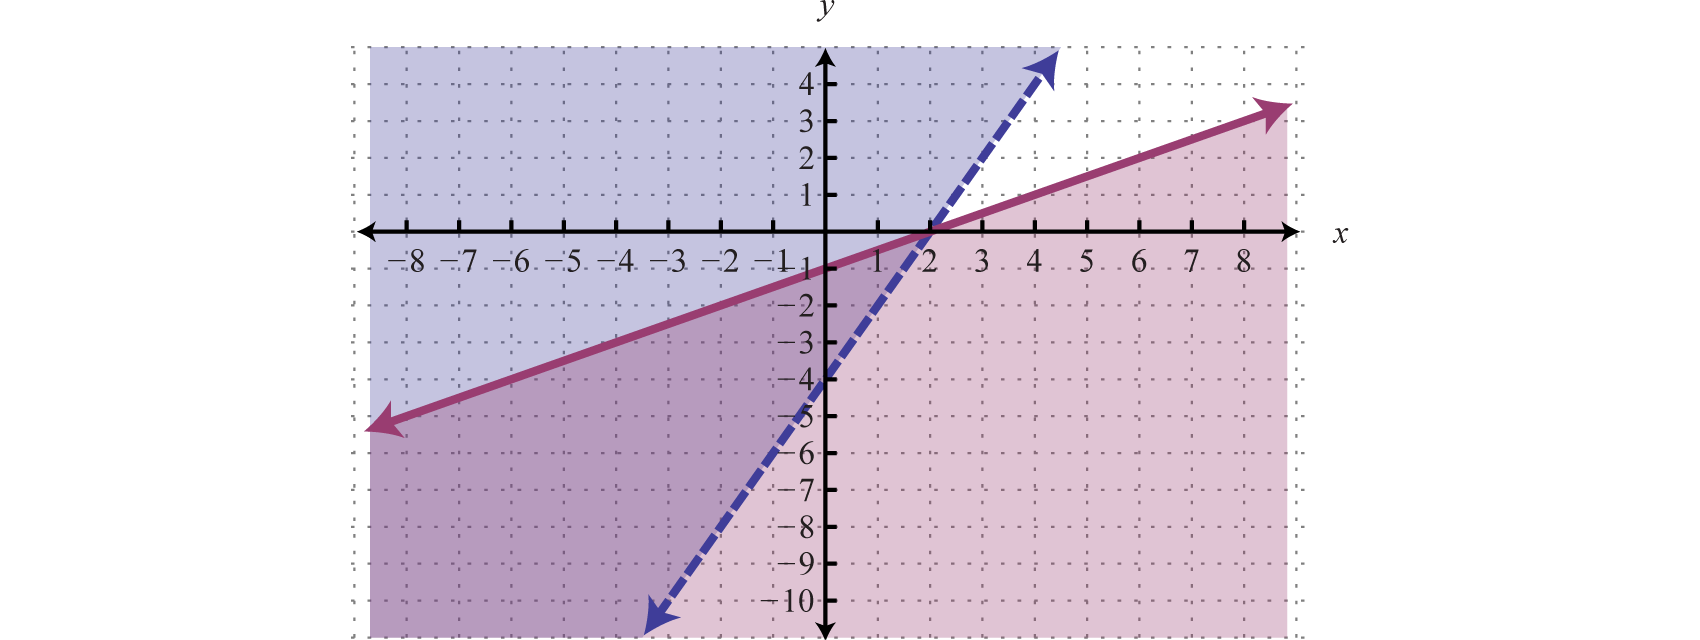
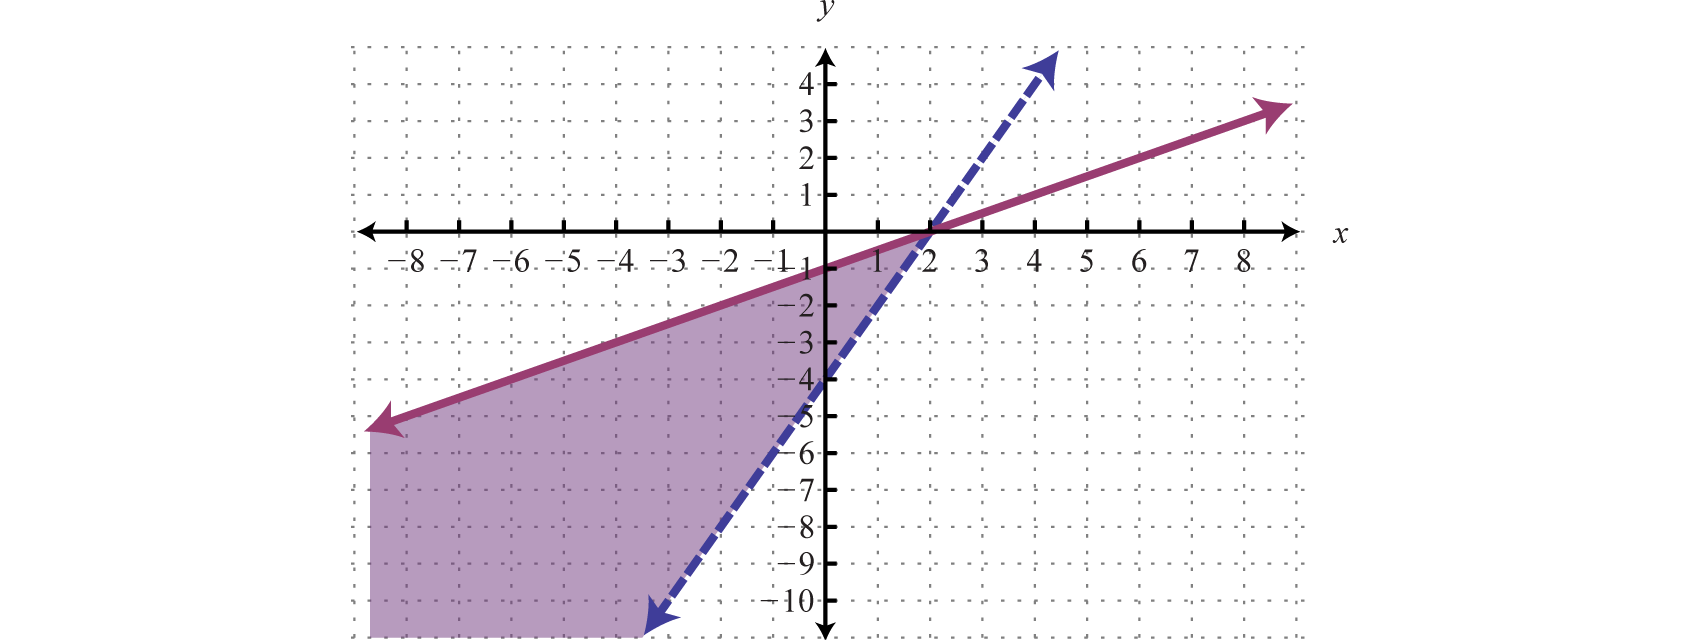
Now we present our solution with only the intersection shaded.
Answer:
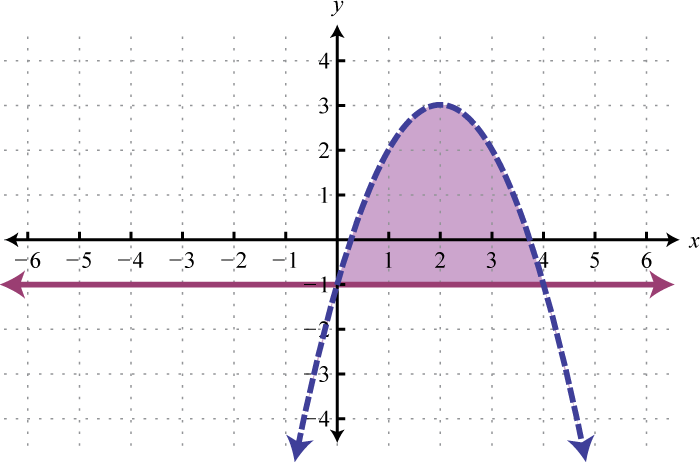
Graph the solution set: .
Solution:
We begin by solving both inequalities for y.
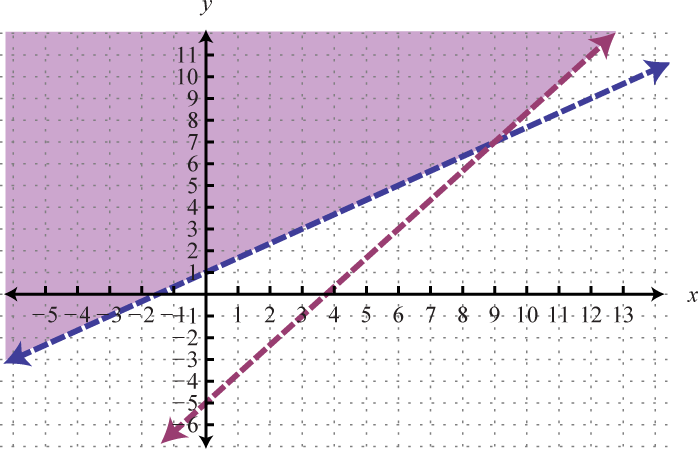
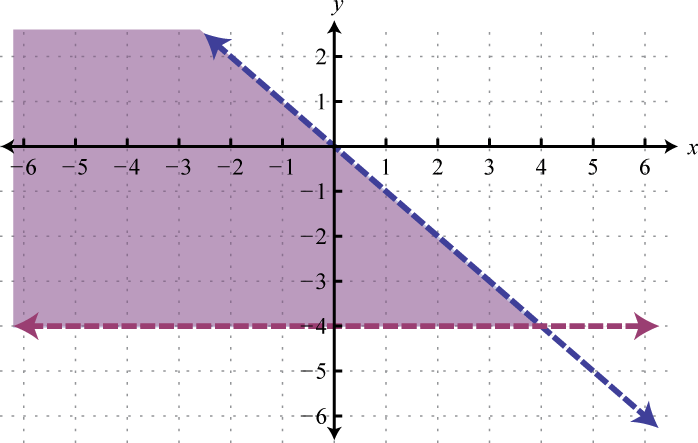
Because of the strict inequalities, we will use a dashed line for each boundary. For the first inequality shade all points above the boundary and for the second inequality shade all points below the boundary.
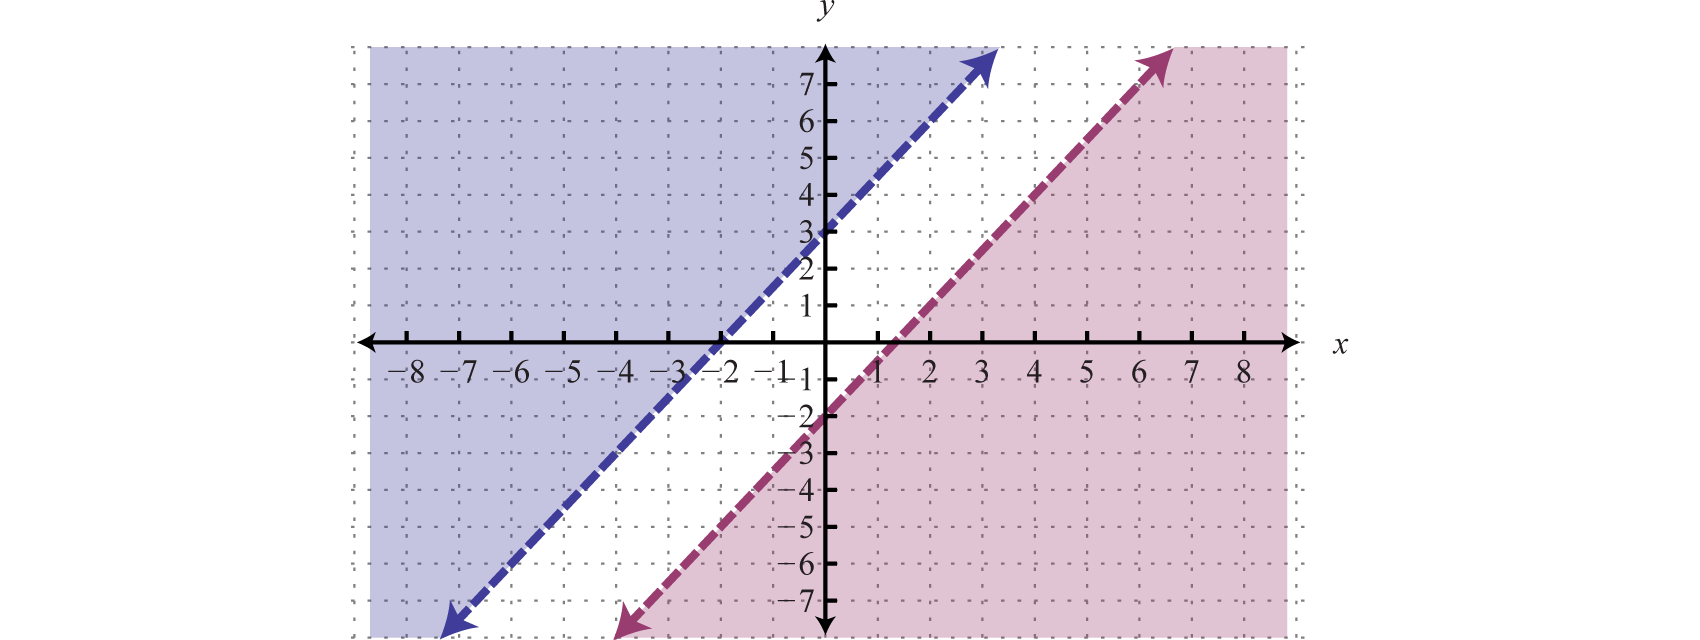
As we can see, there is no intersection of these two shaded regions. Therefore, there are no simultaneous solutions.
Answer:
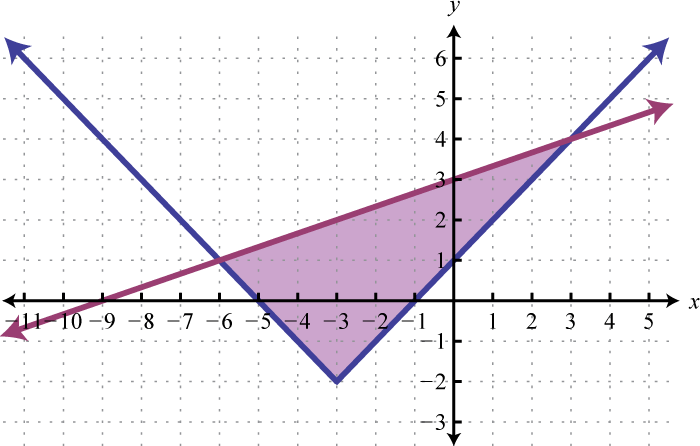
Graph the solution set: .
Solution:
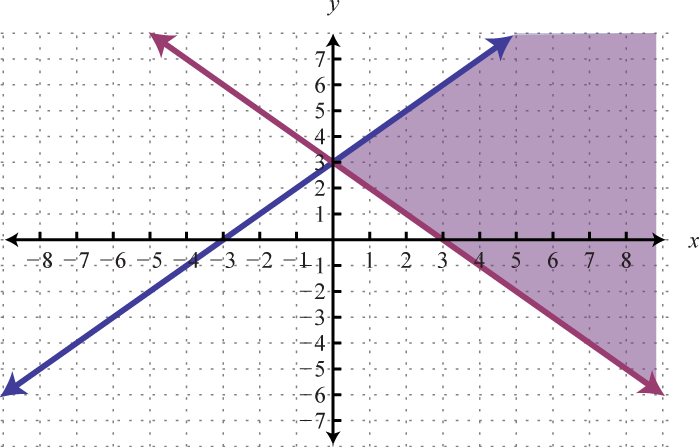
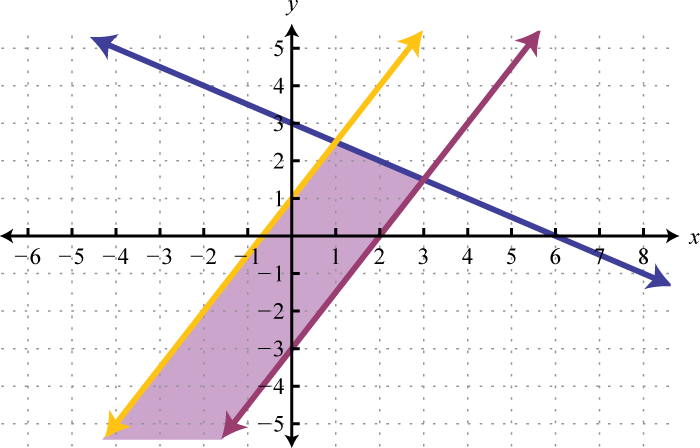
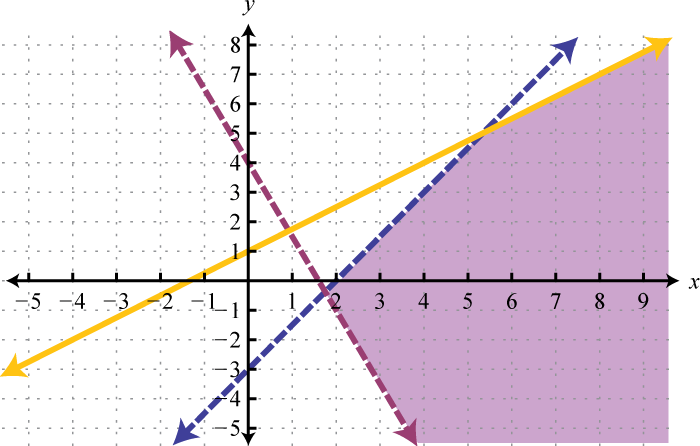
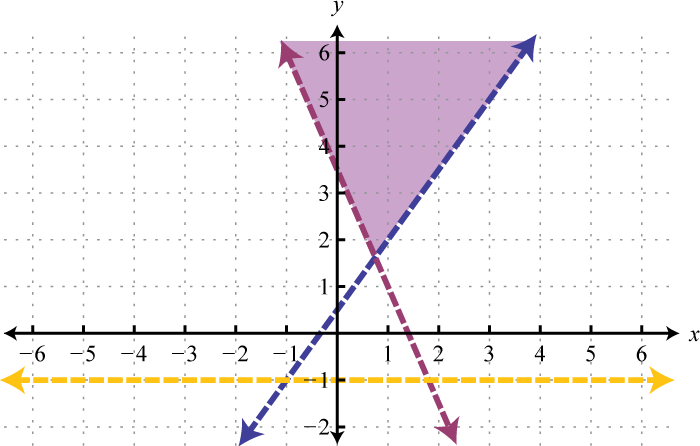
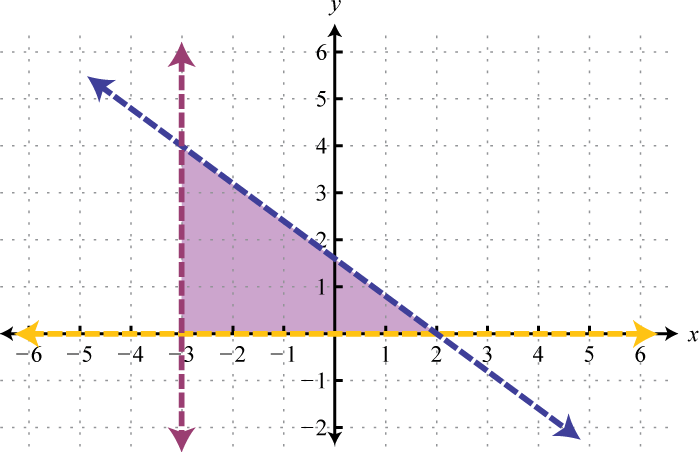
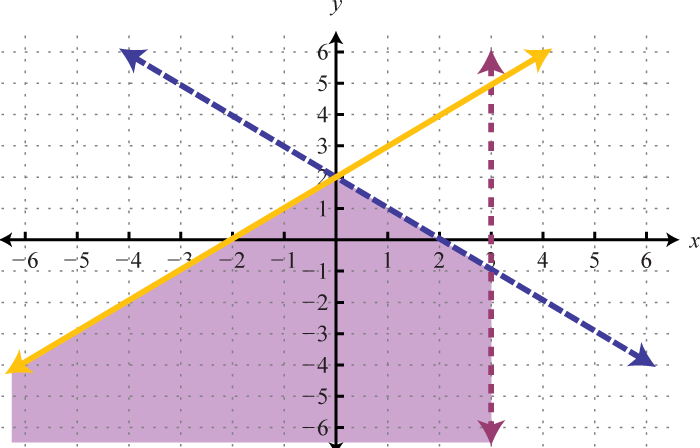
Begin by graphing the solution sets to all three inequalities.
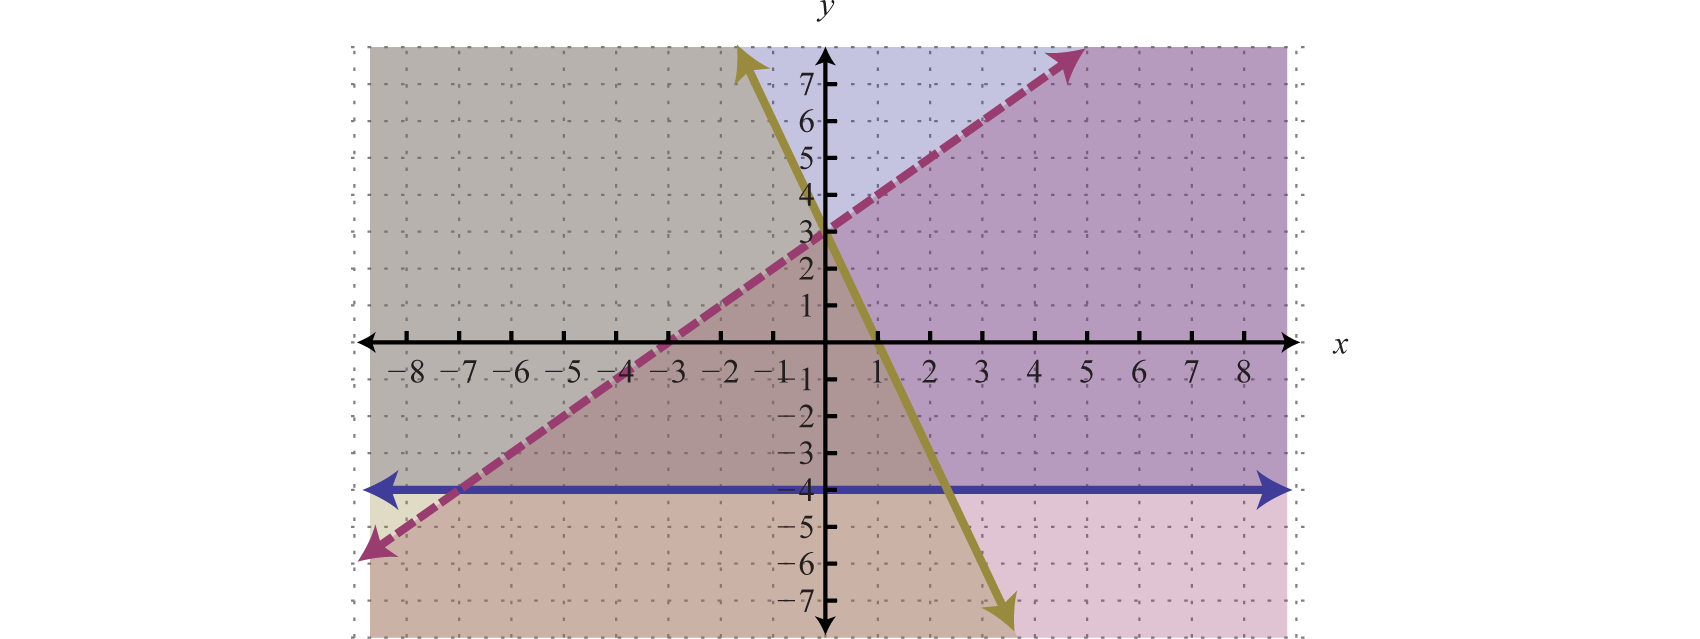
After graphing all three inequalities on the same set of axes, we determine that the intersection lies in the triangular region pictured below.
Answer:
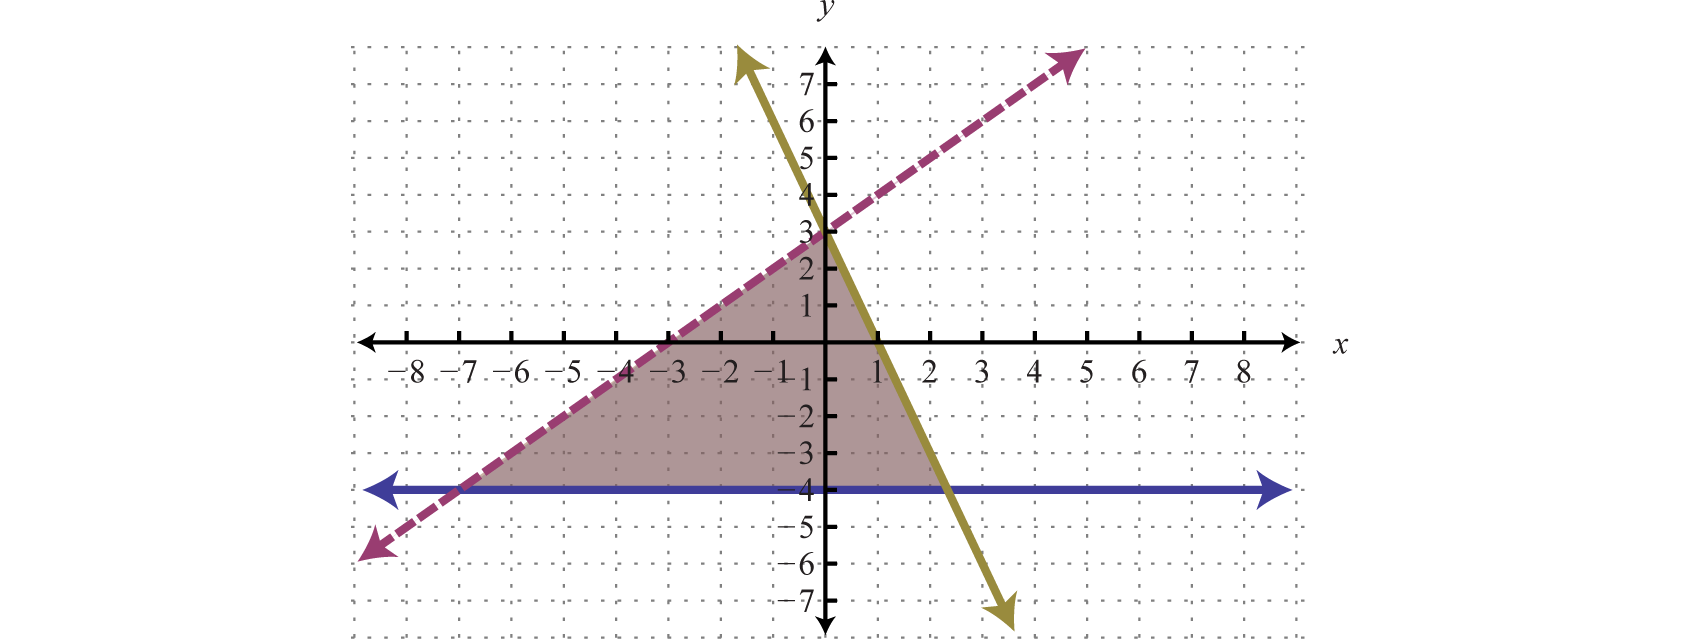
The graph suggests that (−1, 1) is a simultaneous solution. As a check, we could substitute that point into the inequalities and verify that it solves all three conditions.
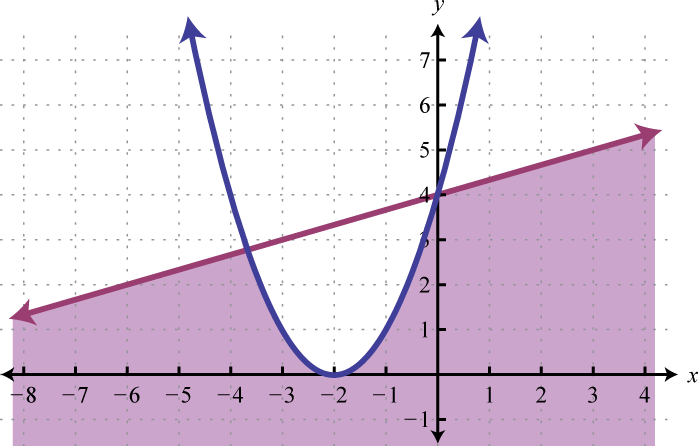
Use the same technique to graph the solution sets to systems of nonlinear inequalities.
Graph the solution set: .
Solution:
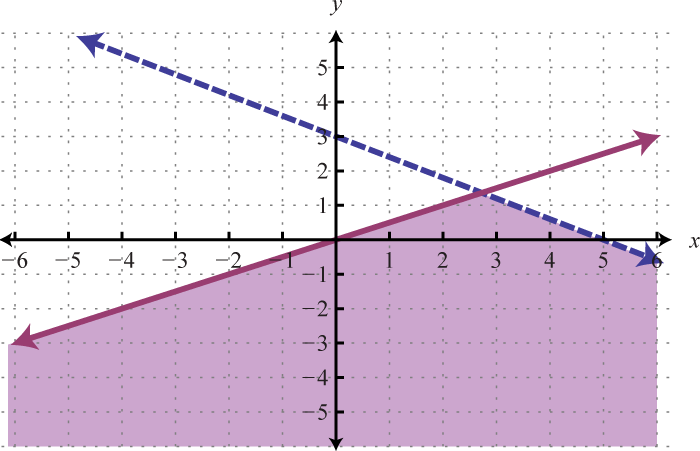
The first inequality has a parabolic boundary. This boundary is a horizontal translation of the basic function to the left 1 unit. Because of the strict inequality, the boundary is dashed, indicating that it is not included in the solution set. The second inequality is linear and will be graphed with a solid boundary. Solution sets to both are graphed below.
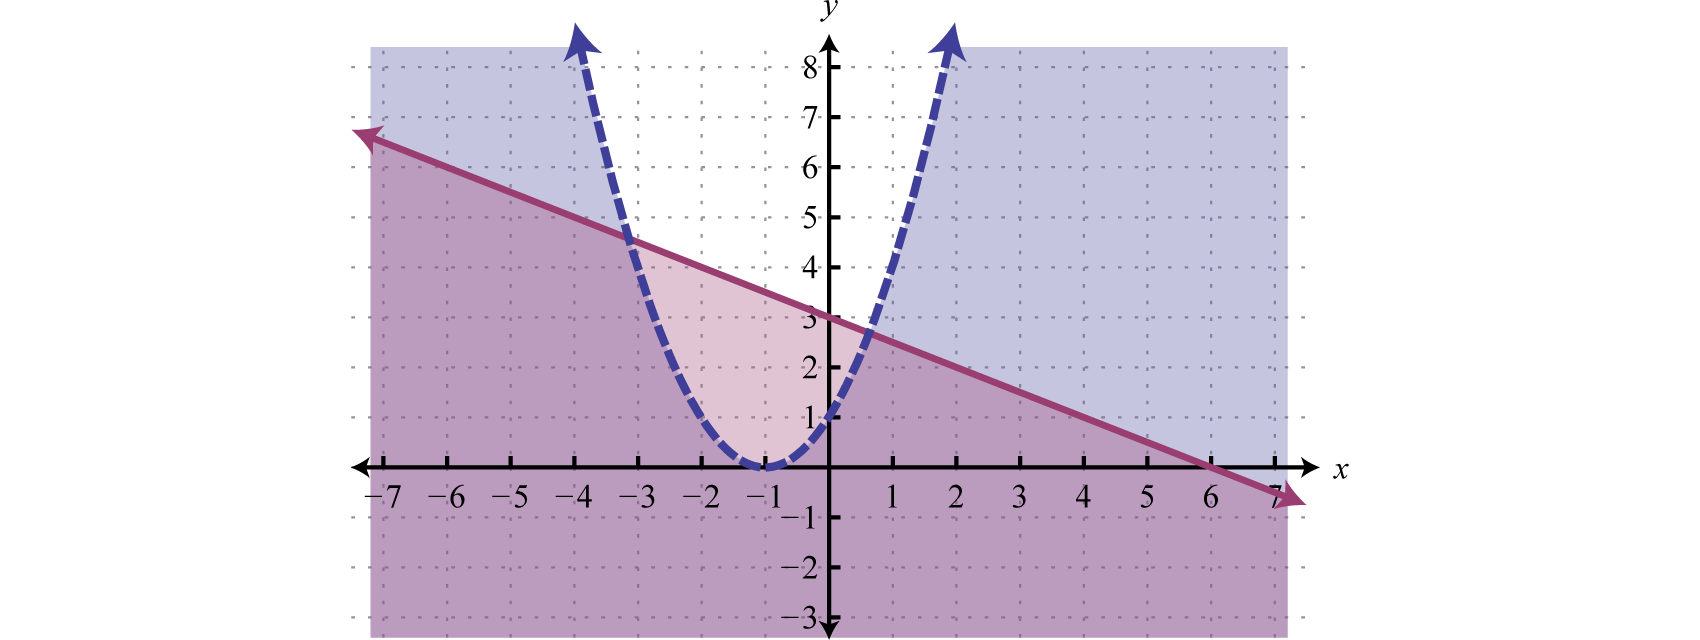
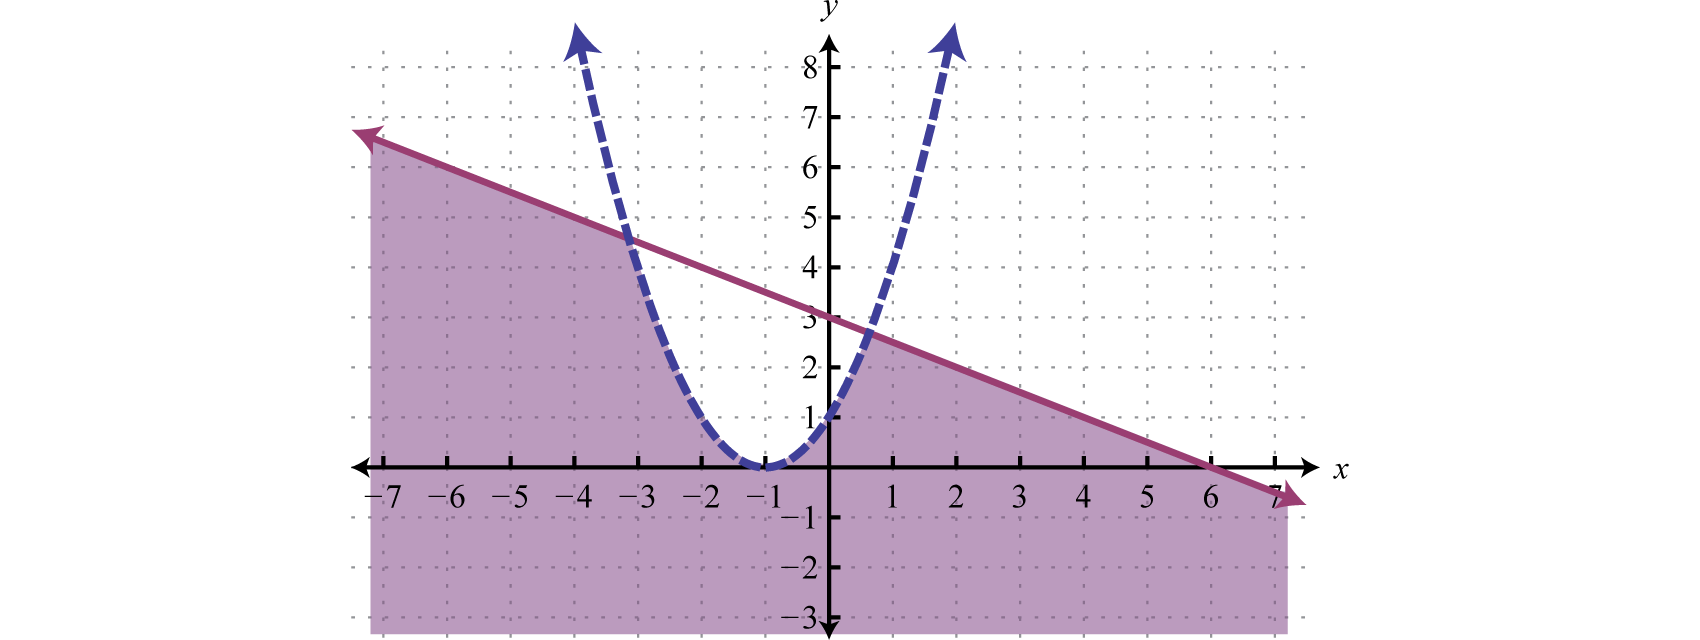
After graphing the inequalities on the same set of axes, we determine that the intersection lies in the region pictured below.
Answer:
Determine whether or not the given point is a solution to the given system of inequalities.
(−2, 1);
(−1, −3);
(−2, −1);
(0, −5);
;
;
(−1, −2);
(−5, 2);
(0, 3);
(1, 1);
(−1, 2);
(4, 5);
(−2, −3);
(1, 2);
;
(−4, 1);
;
;
(4, 2);
;
Graph the solution set.
Construct a system of linear inequalities that describes all points in the first quadrant.
Construct a system of linear inequalities that describes all points in the second quadrant.
Construct a system of linear inequalities that describes all points in the third quadrant.
Construct a system of linear inequalities that describes all points in the fourth quadrant.
Graph the solution set.
Yes
Yes
Yes
Yes
Yes
Yes
No
Yes
Yes
No
