# Radar
 **Modern Kubernetes visibility.**
Local-first. No account. No cloud dependency. Blazing Fast.
🌐 **[radarhq.io](https://radarhq.io)** · [Docs](https://radarhq.io/docs) · [Releases](https://github.com/skyhook-io/radar/releases)
Topology, event timeline, and service traffic — plus resource browsing, Helm management, and GitOps support for FluxCD and ArgoCD.
[](https://github.com/skyhook-io/radar/actions/workflows/ci.yml)
[](https://github.com/skyhook-io/radar/releases/latest)
[](https://goreportcard.com/report/github.com/skyhook-io/radar)
[](https://github.com/skyhook-io/radar/releases)
[](LICENSE)
[](https://go.dev/)
Visualize your cluster topology, browse resources, stream logs, exec into pods, inspect container image filesystems, manage Helm releases, monitor GitOps workflows (FluxCD & ArgoCD), and forward ports - all from a single binary with zero cluster-side installation.
**Install and run in 30 seconds:**
```bash
curl -fsSL https://get.radarhq.io | sh && kubectl radar
```
[More installation options ↓](#installation)
## Why Radar?
- **Zero install on your cluster** — runs on your laptop, talks to the K8s API directly
- **Single binary** — no dependencies, no agents, no CRDs
- **Blazing fast** - smart caching, progressive loading, parallelization and other optimizations
- **Airgapped-ready** — no external network calls, works in isolated environments
- **Real-time** — watches your cluster via informers, pushes updates to the browser via SSE
- **Works everywhere** — GKE, EKS, AKS, minikube, kind, k3s, or any conformant cluster
- **AI-ready** — built-in [MCP server](docs/mcp.md) lets AI assistants query your cluster through Radar
- **In-cluster option** — deploy with Helm for shared team access with RBAC-scoped permissions
---
## Installation
**Quick Install:**
```bash
curl -fsSL https://get.radarhq.io | sh
```
**Homebrew:**
```bash
brew install skyhook-io/tap/radar
```
Then run: `kubectl radar` (or simply `radar`)
More install options — Desktop App (macOS/Linux/Windows), Krew, Scoop, In-Cluster Helm
#### CLI
**Krew (kubectl plugin manager):**
```bash
kubectl krew install radar
```
**Scoop (Windows):**
```powershell
scoop bucket add skyhook https://github.com/skyhook-io/scoop-bucket
scoop install radar
```
**PowerShell (Windows):**
```powershell
irm https://get.radarhq.io/install.ps1 | iex
```
**Direct download** — [GitHub Releases](https://github.com/skyhook-io/radar/releases) for macOS, Linux, or Windows.
#### Desktop App
Native desktop app — no terminal needed.
**Homebrew (macOS):**
```bash
brew install --cask skyhook-io/tap/radar-desktop
```
**Debian/Ubuntu:**
```bash
sudo apt install ./radar-desktop_*.deb
```
**Fedora/RHEL:**
```bash
sudo rpm -i radar-desktop_*.rpm
```
**Scoop (Windows):**
```powershell
scoop bucket add skyhook https://github.com/skyhook-io/scoop-bucket
scoop install radar-desktop
```
**Windows (direct download)** — [GitHub Releases](https://github.com/skyhook-io/radar/releases).
#### In-Cluster Deployment
Deploy to your cluster for shared team access:
```bash
helm repo add skyhook https://skyhook-io.github.io/helm-charts
helm install radar skyhook/radar -n radar --create-namespace
```
See the [In-Cluster Deployment Guide](docs/in-cluster.md) for ingress, authentication, and RBAC configuration.
---
## Usage
```bash
# Opens browser automatically
kubectl radar
# Or simply
radar
```
**CLI Flags**
| Flag | Default | Description |
|------|---------|-------------|
| `--kubeconfig` | `~/.kube/config` | Path to kubeconfig file |
| `--kubeconfig-dir` | | Comma-separated directories containing kubeconfig files |
| `--namespace` | (all) | Initial namespace filter (supports multi-select in the UI; also used as RBAC fallback for namespace-scoped users) |
| `--port` | `9280` | Server port |
| `--no-browser` | `false` | Don't auto-open browser |
| `--timeline-storage` | `memory` | Timeline storage backend: `memory` or `sqlite` |
| `--timeline-db` | `~/.radar/timeline.db` | Path to SQLite database (when using sqlite storage) |
| `--timeline-max-size` | `0` | Maximum SQLite DB + WAL size before pruning oldest events (e.g. `800Mi`, `8Gi`; `0` disables) |
| `--history-limit` | `10000` | Maximum events to retain in timeline |
| `--disable-exec` | `false` | Disable terminal and debug shell |
| `--disable-helm-write` | `false` | Disable Helm write operations |
| `--disable-local-terminal` | `false` | Disable local terminal feature |
| `--debug-image` | `busybox:latest` | Image for ephemeral debug containers and node debug pods. Point at a mirror for air-gapped / private-registry clusters. |
| `--list-page-size` | `0` (off) | Paginate the initial LIST of high-cardinality kinds (Pods, ReplicaSets) at this size. Helps very large clusters that fail to sync; only used when WatchList streaming is unavailable. Try `2000`. |
| `--prometheus-url` | (auto-discover) | Manual Prometheus/VictoriaMetrics URL (skips auto-discovery) |
| `--prometheus-header` | | HTTP header sent with every Prometheus request, format `Key=Value` (repeatable). Required for auth-protected backends. |
| `--prometheus-header-from-env` | | HTTP header sent with every Prometheus request, sourced from an environment variable, format `Key=ENV_VAR` (repeatable). |
| `--auth-mode` | `none` | Authentication mode: `none`, `proxy`, or `oidc` ([details](docs/authentication.md)) |
| `--no-mcp` | `false` | Disable MCP server for AI tool integration |
| `--version` | | Show version and exit |
See [Configuration Guide](docs/configuration.md) for details on cluster connection precedence, multiple kubeconfig files, and context switching.
---
## Views
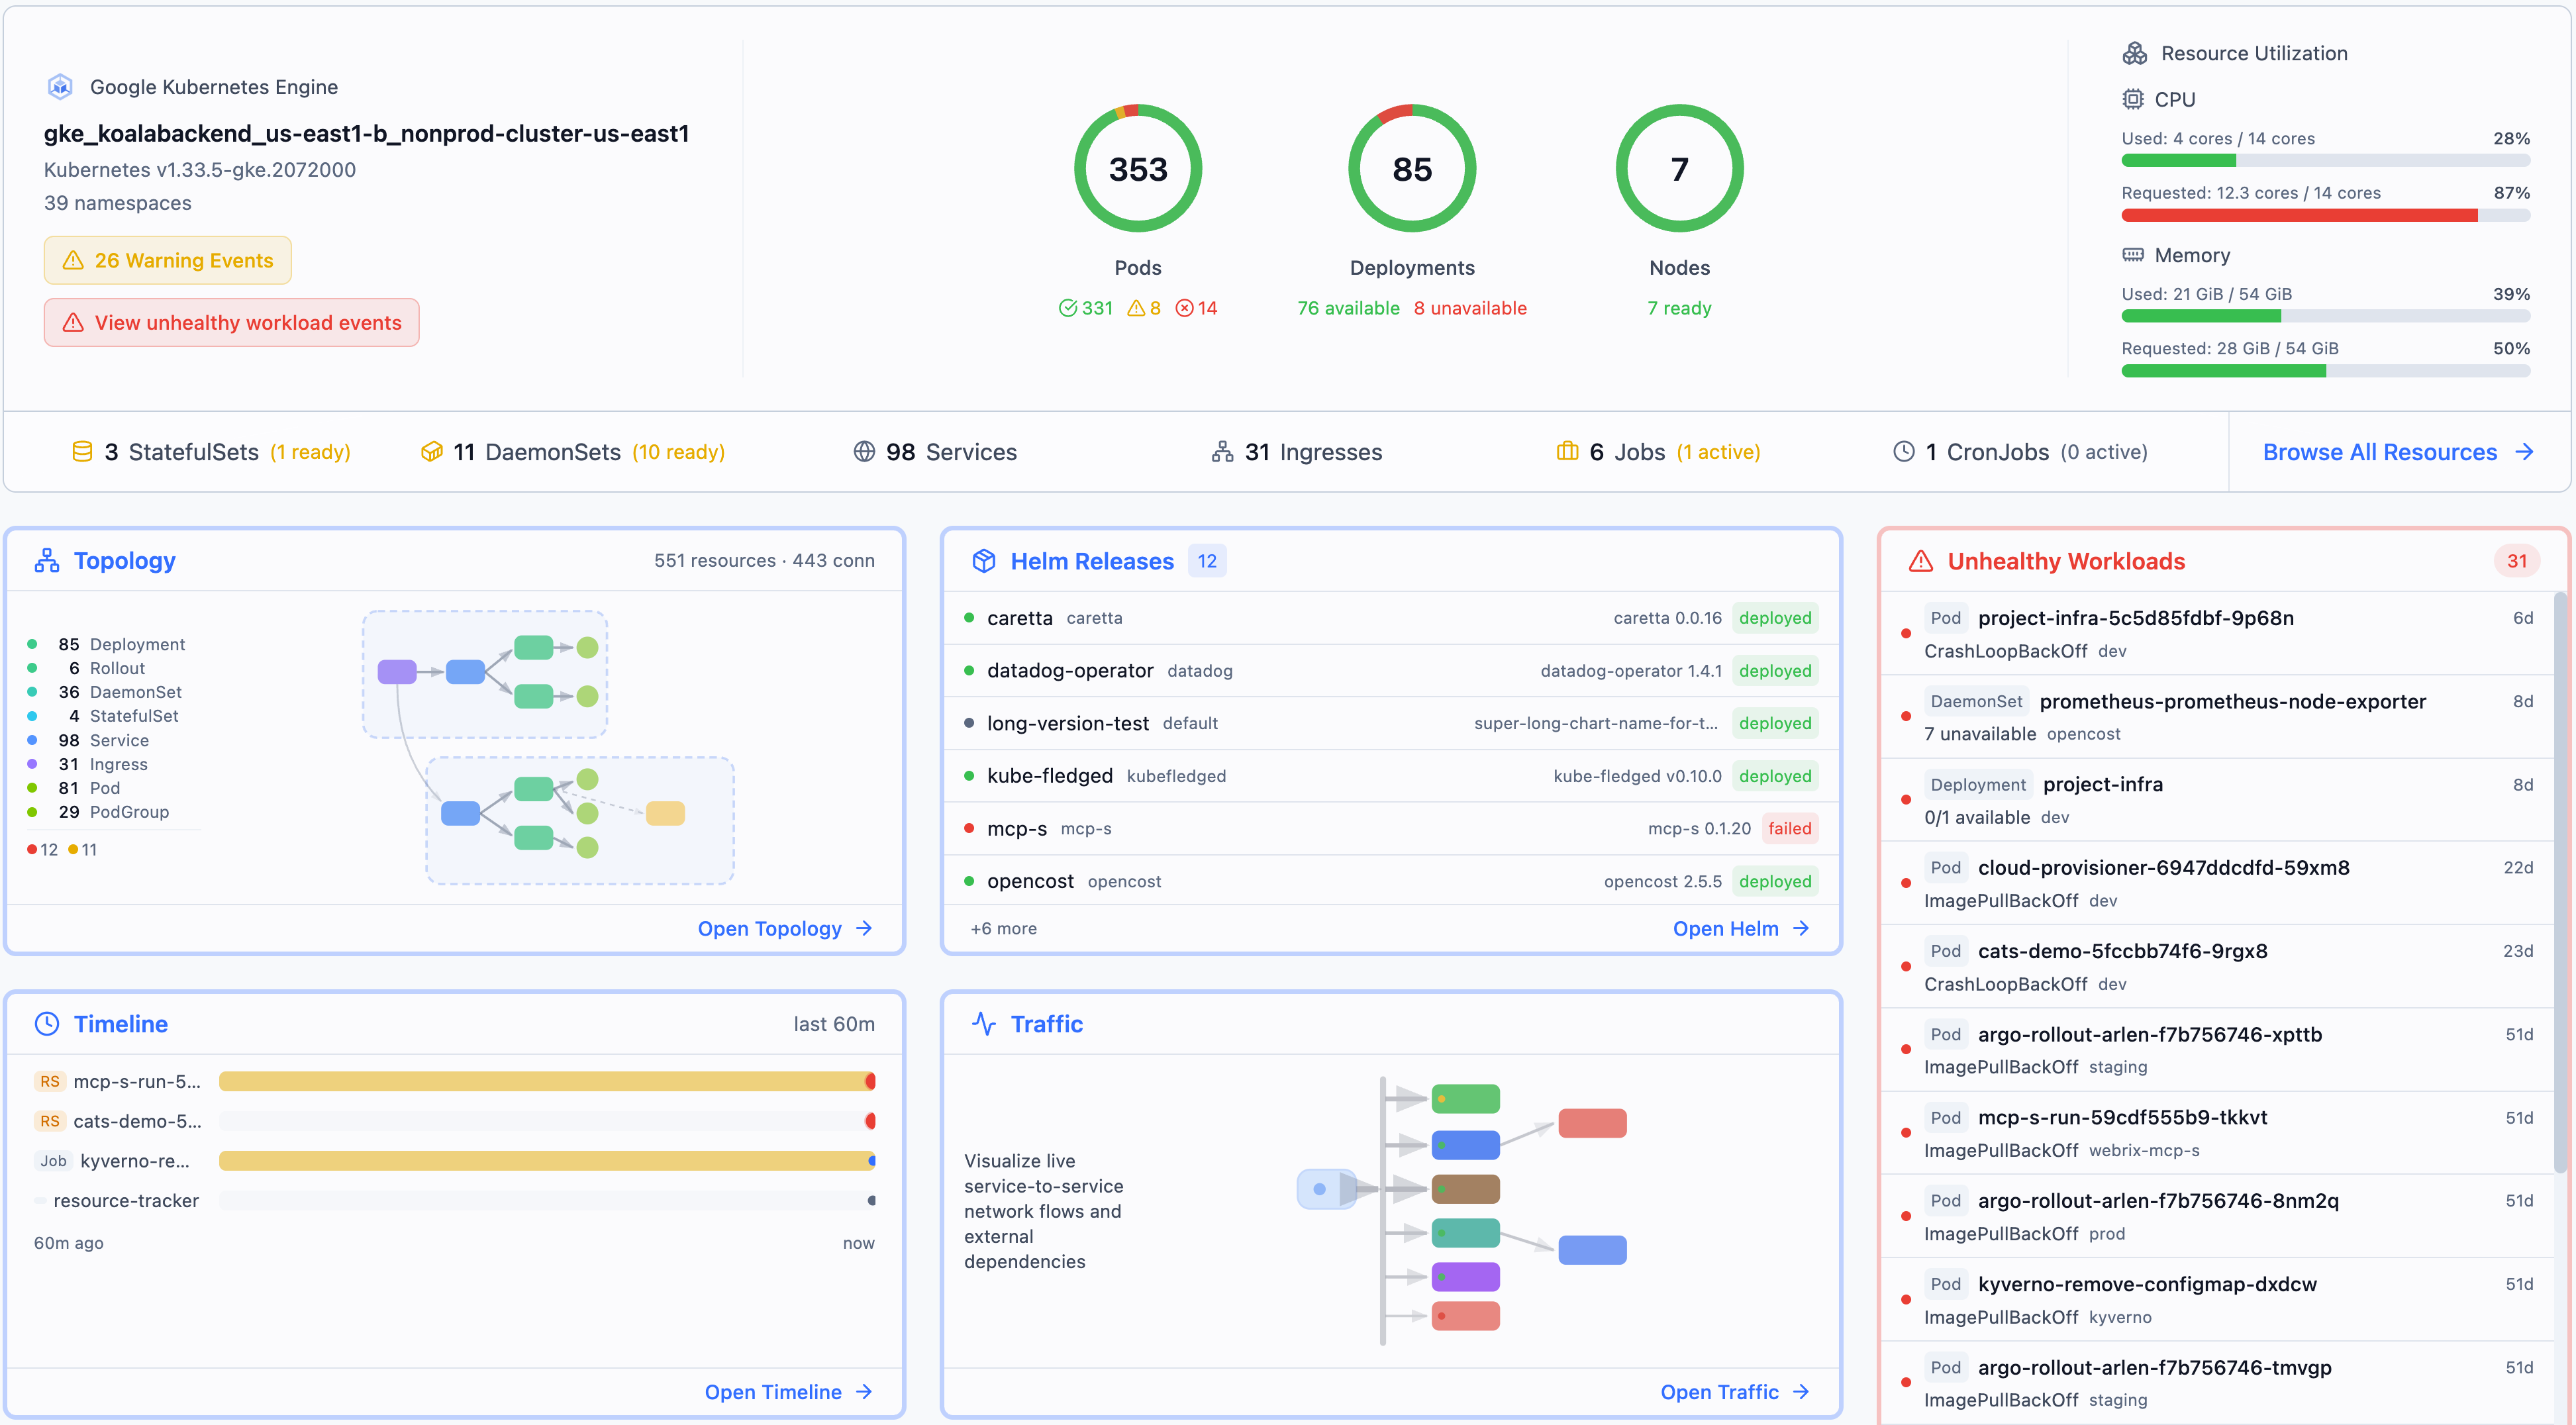
### Topology
Interactive graph showing how your Kubernetes resources are connected in real-time.
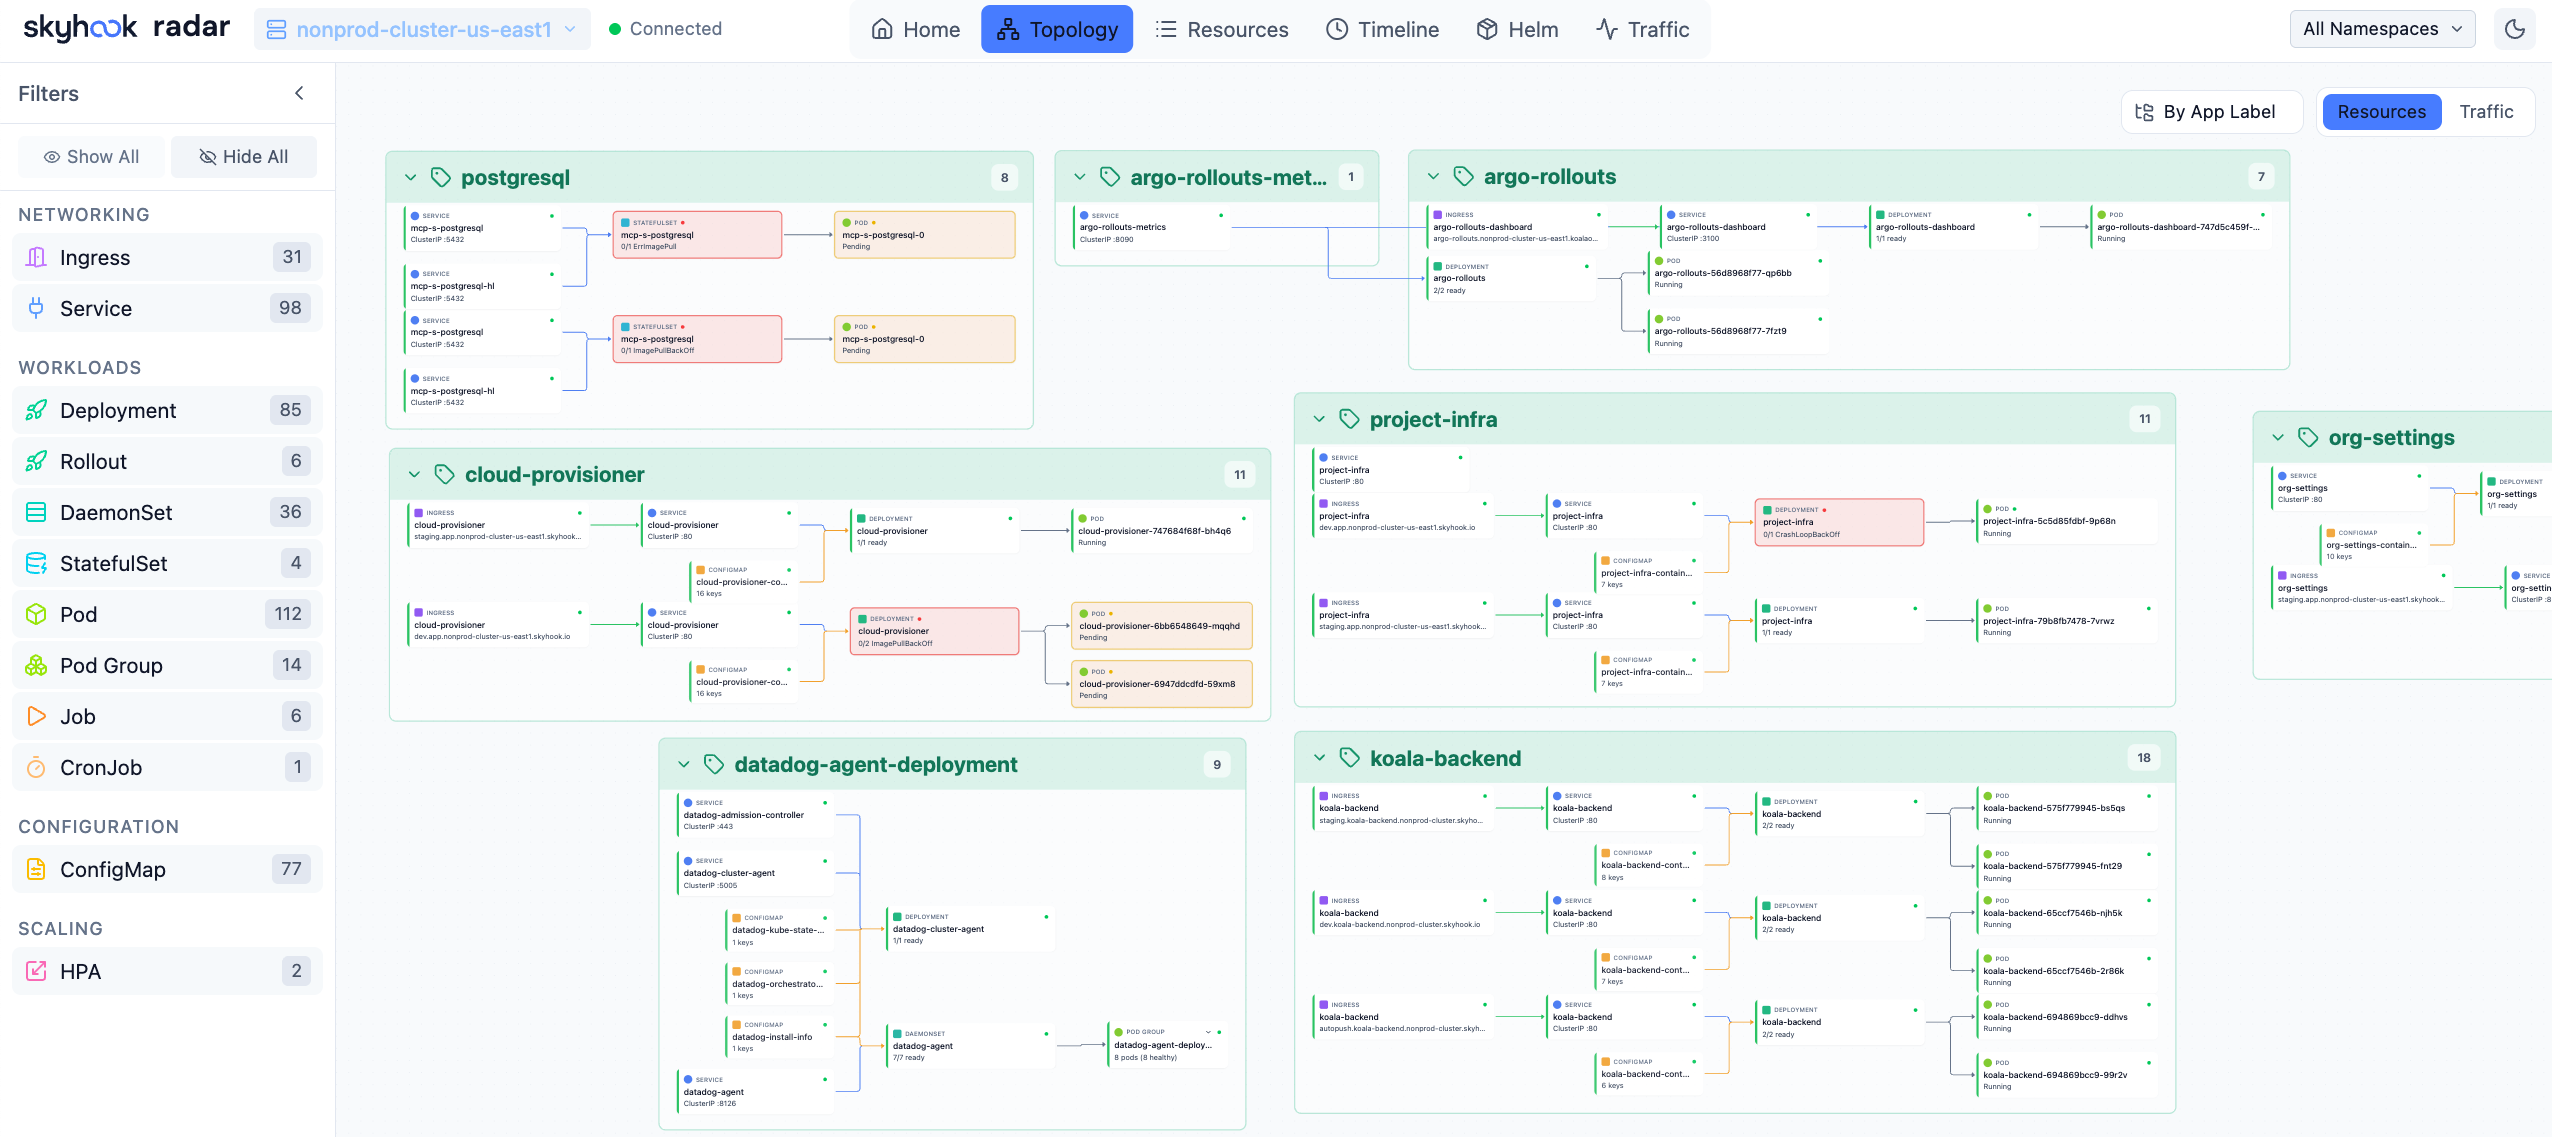
Topology View — Visualize resource relationships
- Two modes: **Resources** (full hierarchy) and **Traffic** (network flow path)
- Group by namespace, app label, or view ungrouped
- Filter by resource kind — click any node for full details
- Auto-layout powered by ELK.js, live updates via SSE
### Resources
Table-based resource browser with smart columns per resource kind.
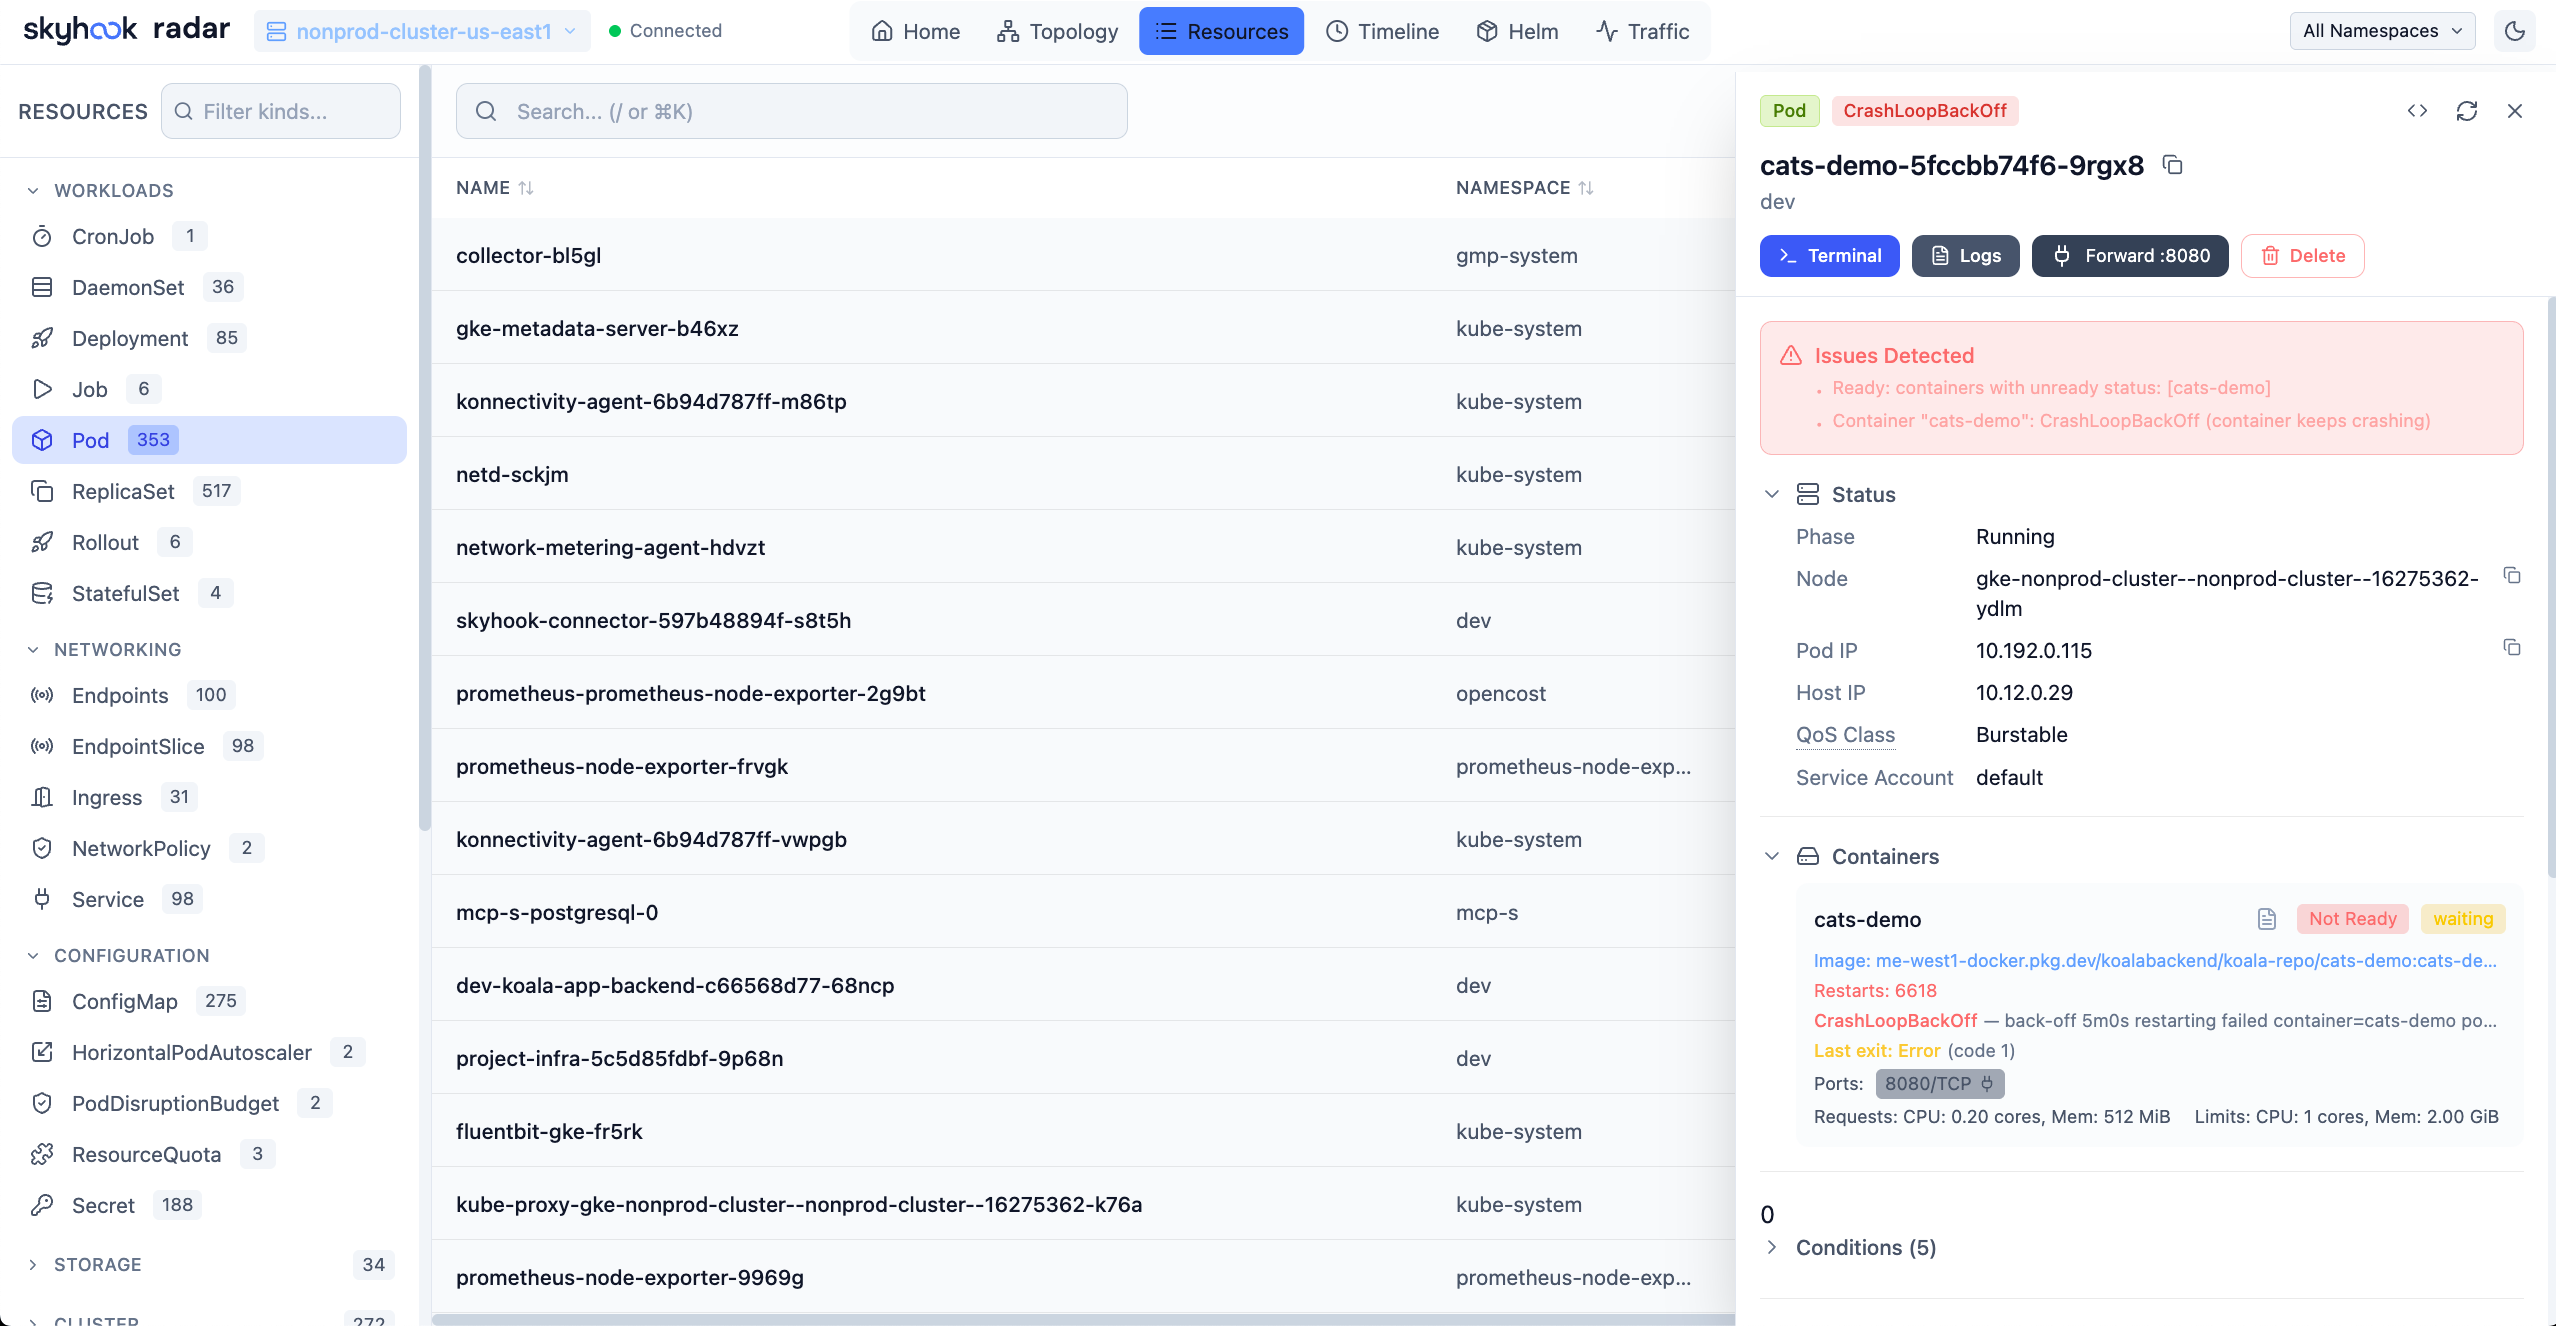
Resources View — Browse and filter all cluster resources
- Browse all resource types including CRDs
- Search by name, filter by status or problems (CrashLoopBackOff, ImagePullBackOff, etc.)
- Add custom columns from any label or annotation — sortable, filterable, and resizable
- Click any resource for YAML manifest, related resources, logs, and events
### Image Filesystem Viewer
Inspect container image filesystems directly from the Pod view — no need to pull images locally or exec into containers.
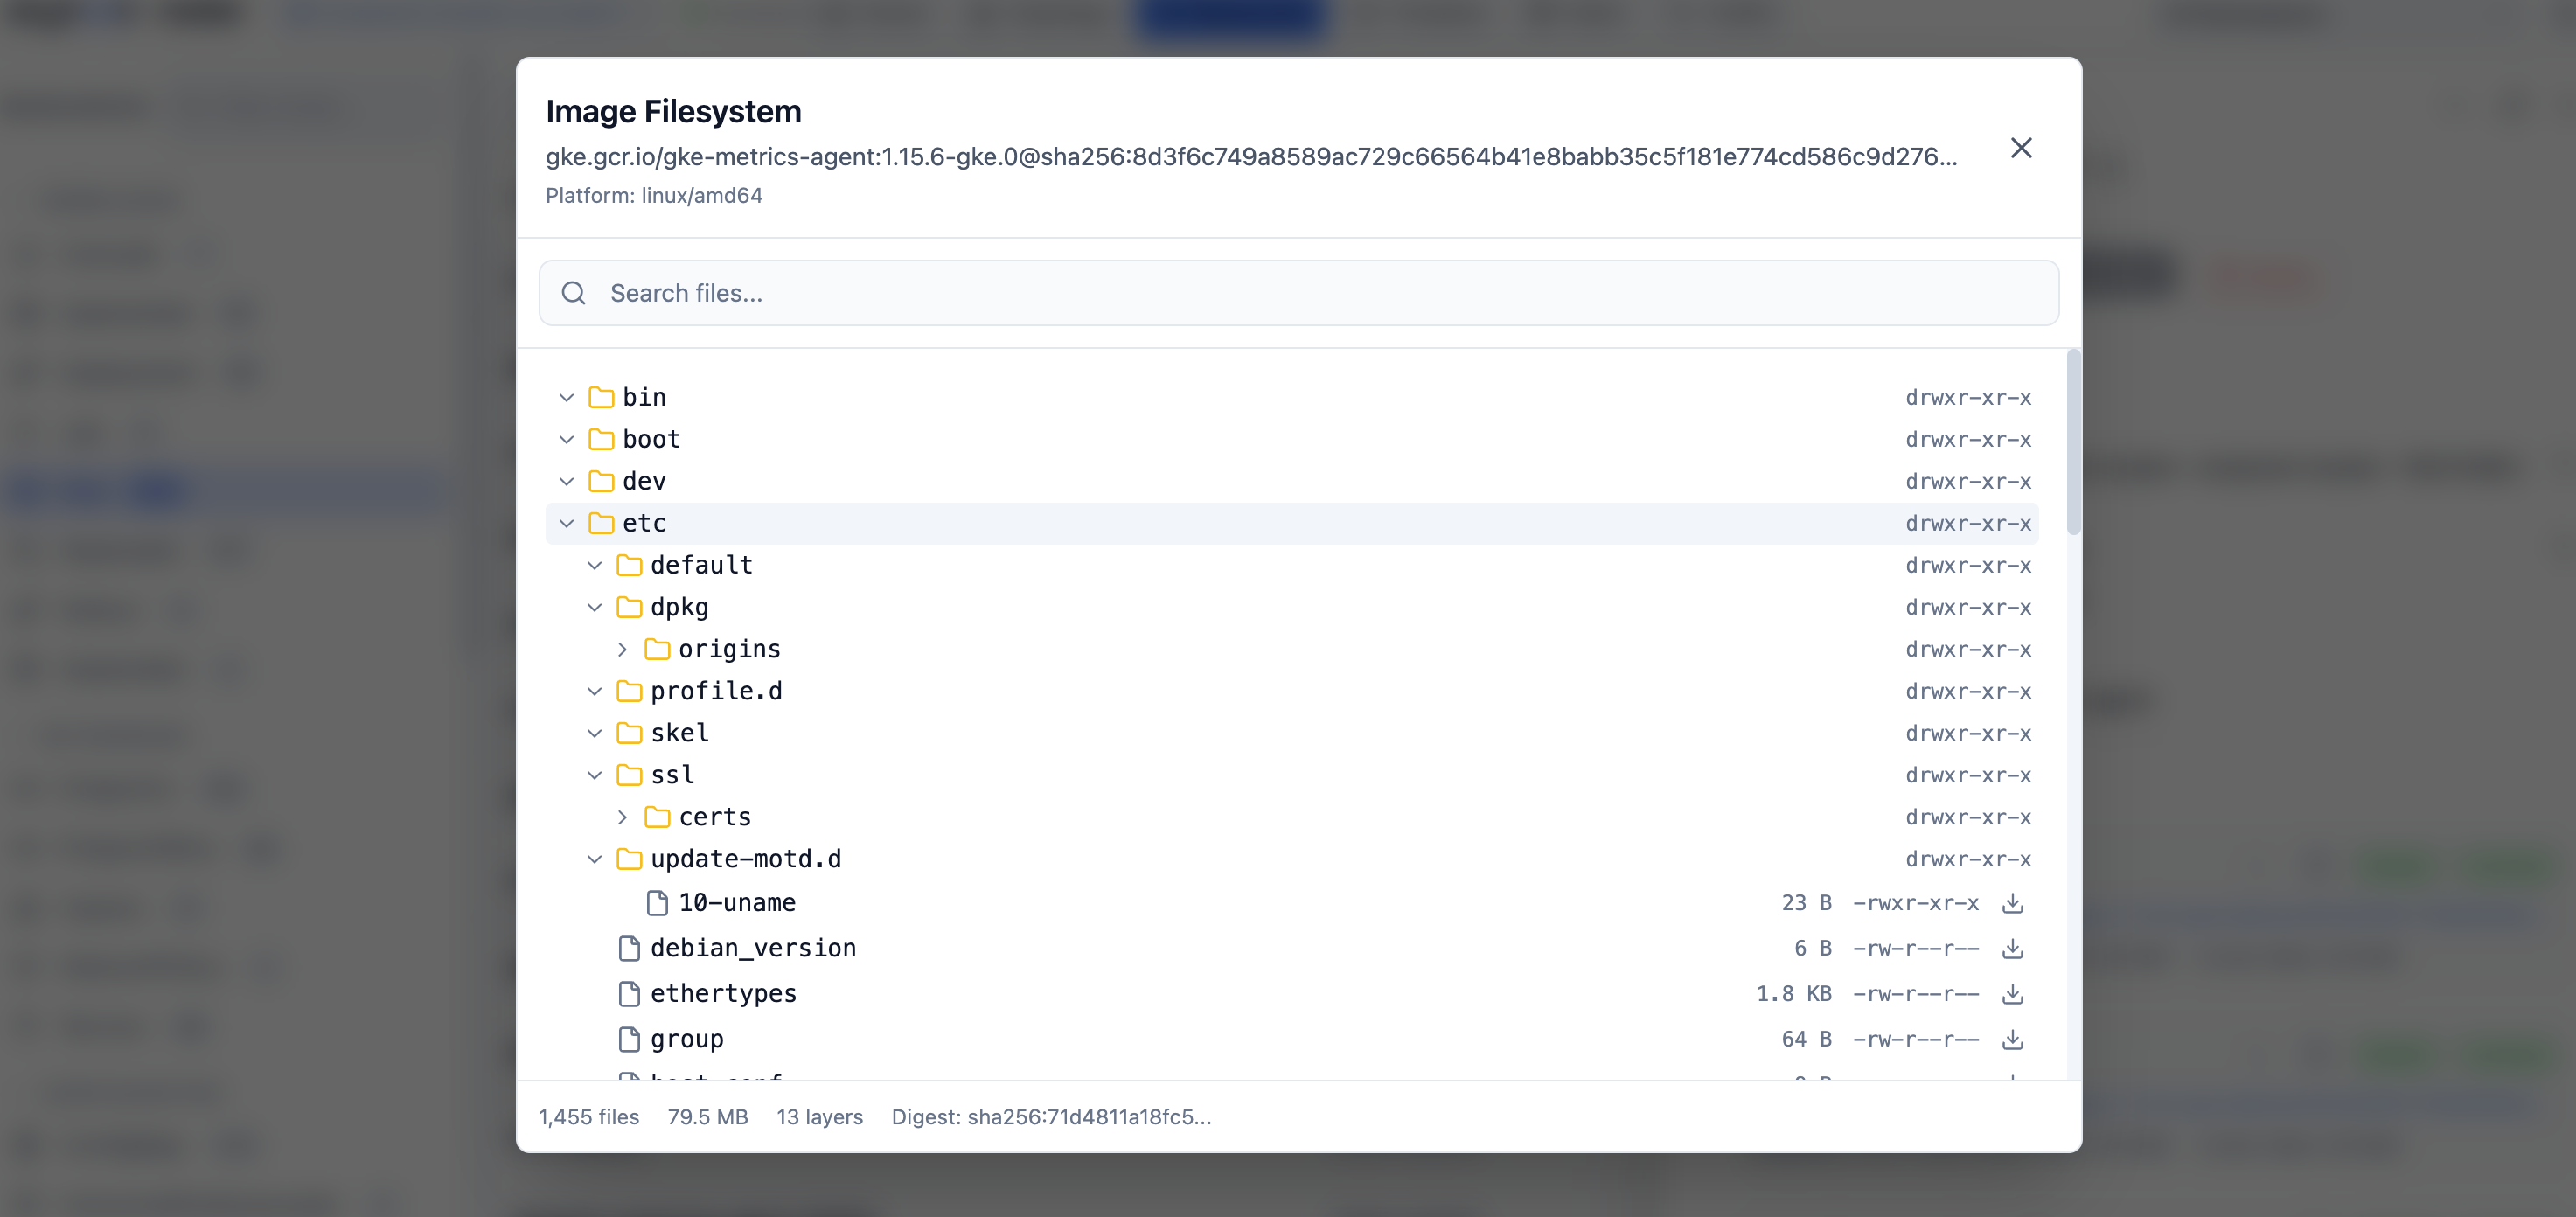
Image Filesystem Viewer — Browse container image contents
- Click any container image in a Pod to browse its complete filesystem
- Tree view with file sizes, permissions, and symlink targets
- Search files by name across the entire image
- Download individual files for inspection
- Works with public images (Docker Hub, Quay, GHCR) and private registries (GCR, ECR, ACR) using your cluster's ImagePullSecrets
- Disk-based layer caching for fast repeated access
### Timeline
Unified timeline of Kubernetes events and resource changes.
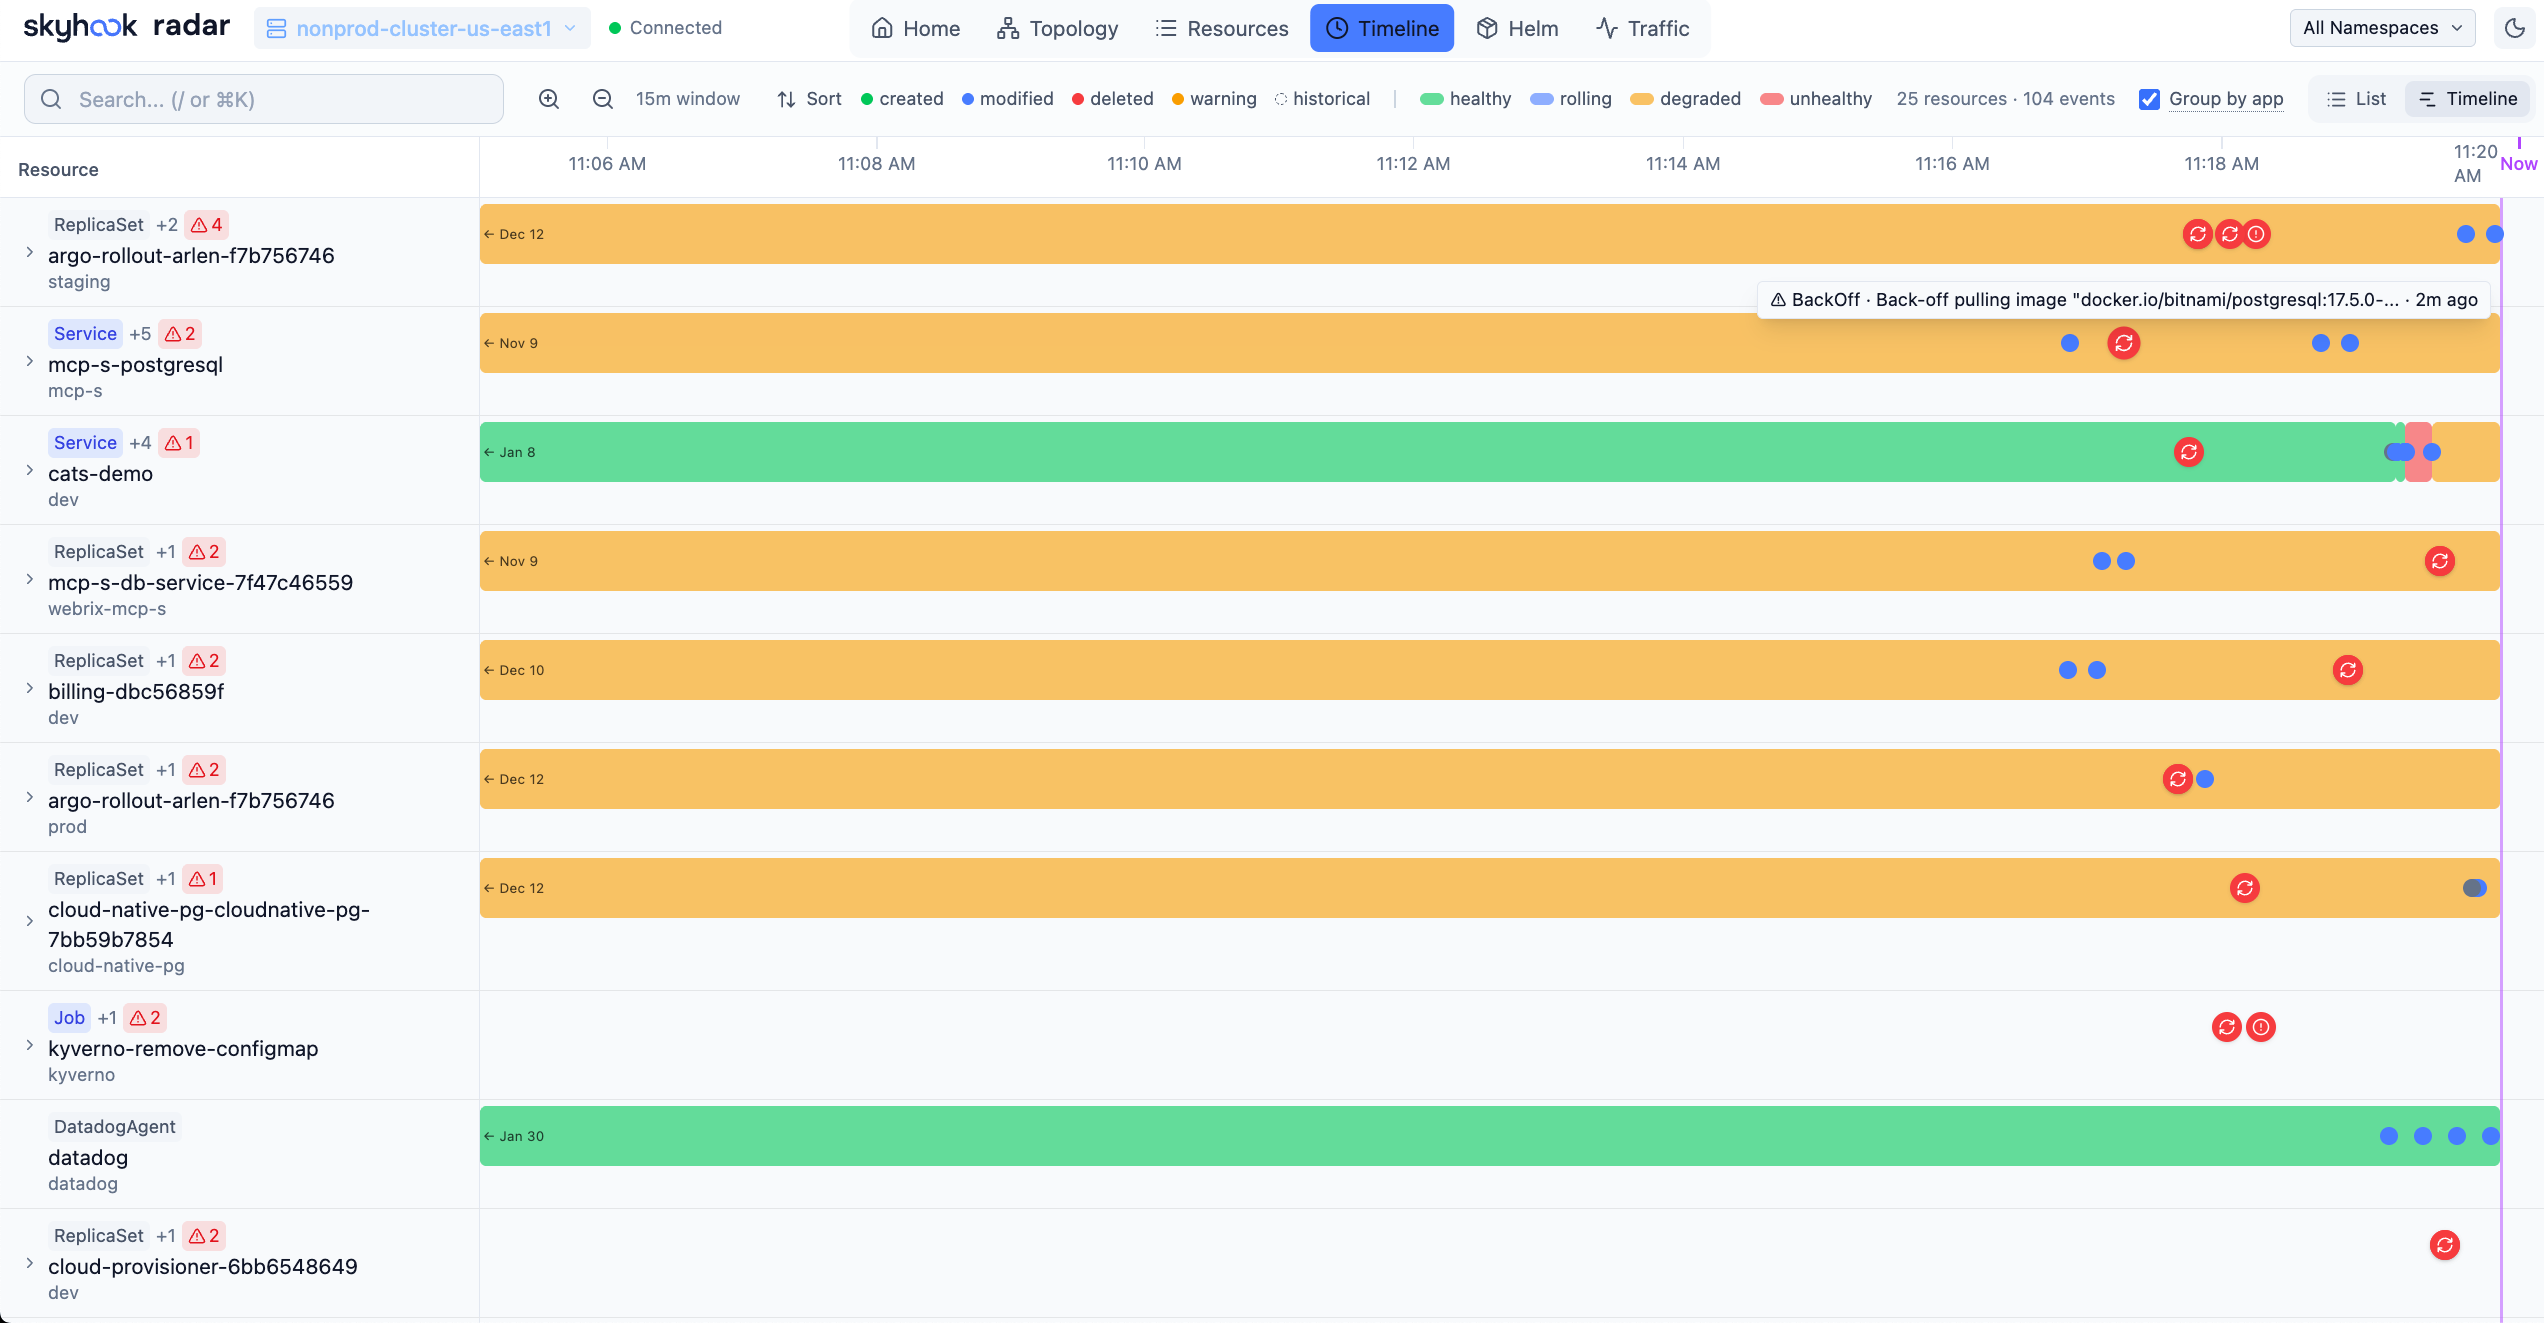
Timeline View — Track cluster activity in real-time
- Filter by event type (all or warnings only)
- Resource change diffs showing what changed (replicas, images, etc.)
- Real-time updates as new events occur
### Helm
Manage Helm releases deployed in your cluster.
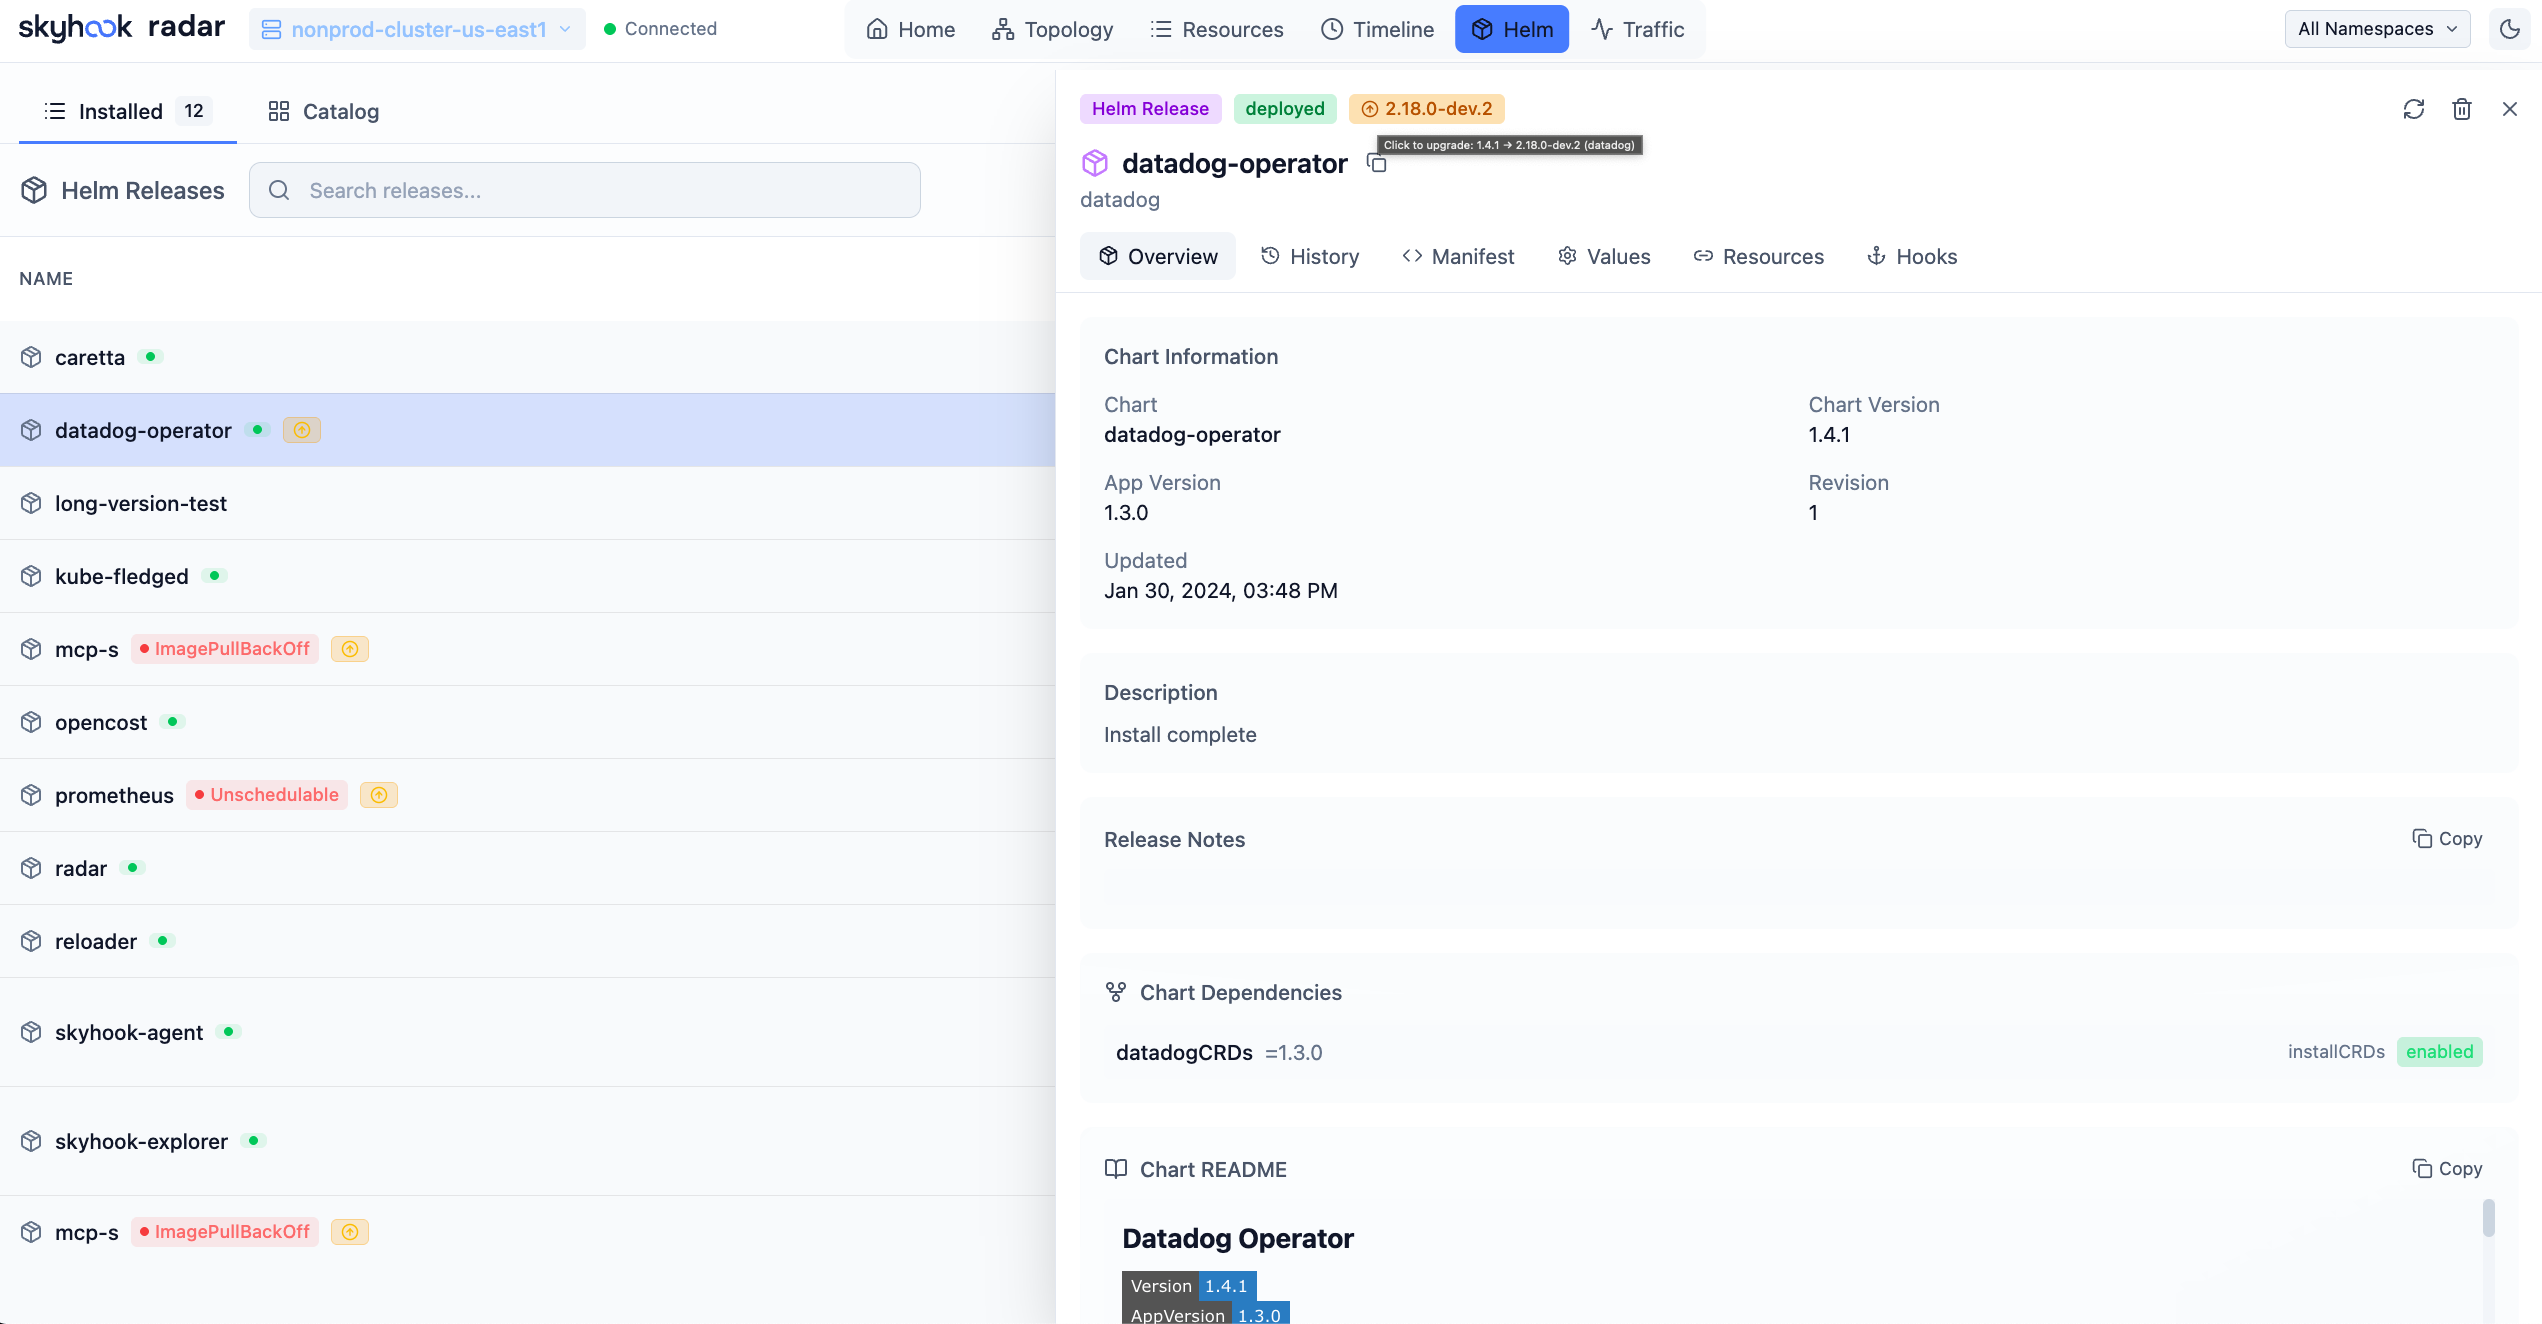
Helm View — Manage your Helm deployments
- View all releases across namespaces with status, chart version, and app version
- Inspect values, compare revisions, view release history
- Upgrade, rollback, or uninstall releases directly from the UI
### Compare Resources
Diff any two Kubernetes resources of the same kind side-by-side — like comparing a staging Deployment to its production sibling, or two pods that should be identical but aren't.
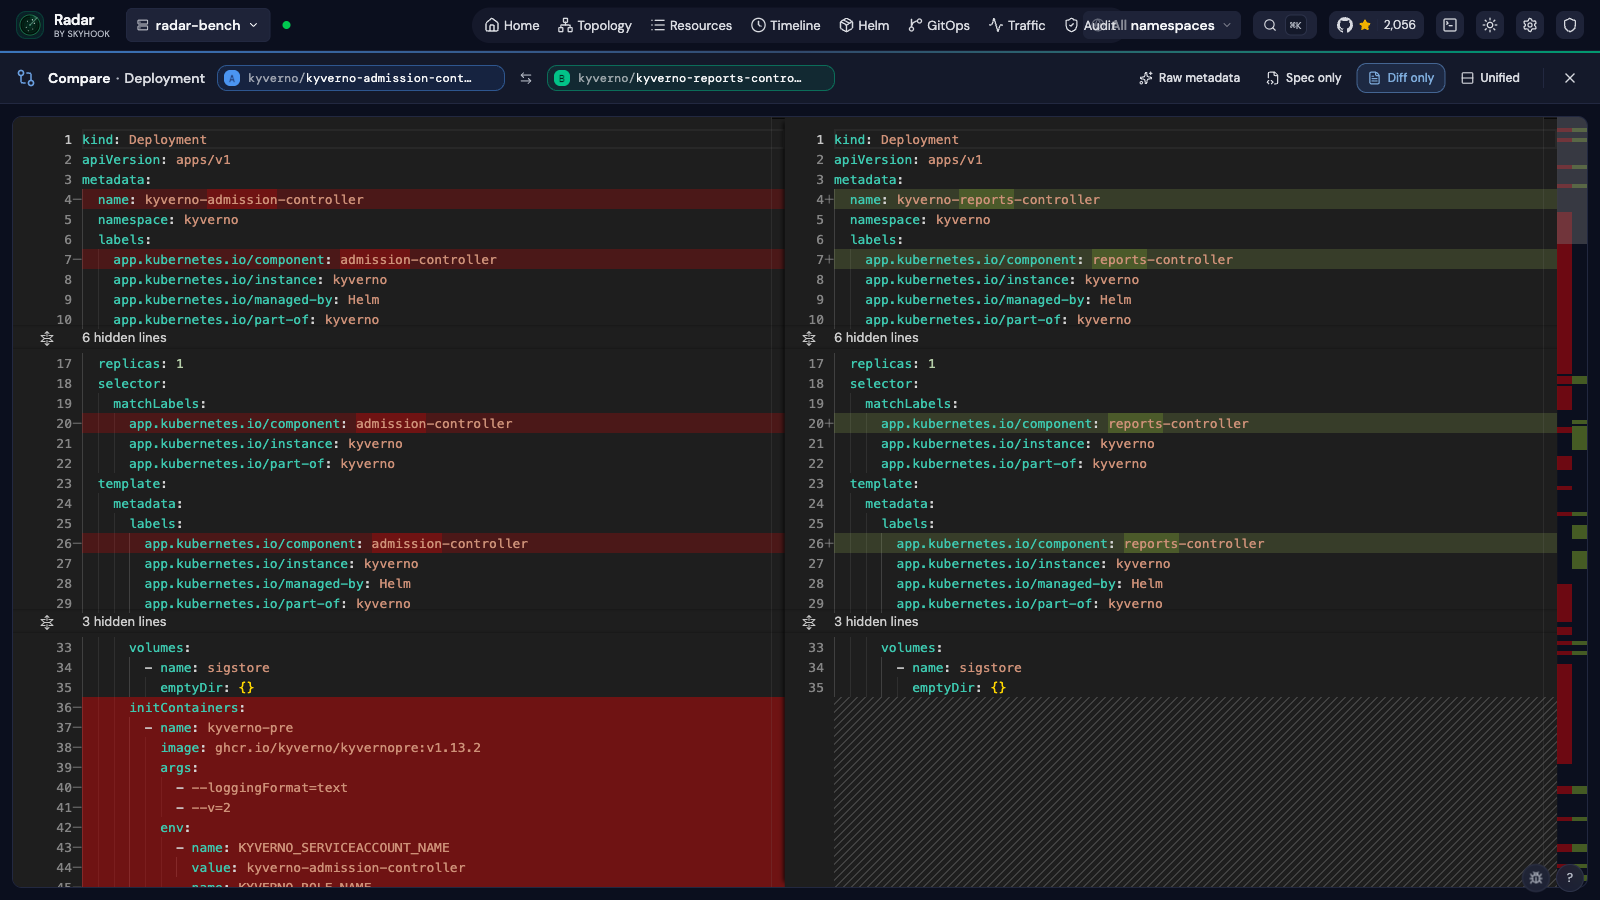
Compare View — Side-by-side YAML diff with field-level highlighting
- **Two entry points**: a `Compare` button in the resource detail drawer, or compare mode in the resource table (toggle, pick two rows, hit Compare)
- **Side-by-side or unified** view, with one-click swap of A ↔ B
- **Diff-only mode** collapses unchanged regions so you only see what differs
- **Spec-only mode** drops `status` fields to focus on intent rather than observed state
- Server-assigned noise (`managedFields`, `resourceVersion`, `kubectl.kubernetes.io/last-applied-configuration`) is stripped automatically so the diff stays signal — flip **Raw metadata** on if you actually want to see it
- Same-namespace candidates are surfaced first in the picker — usually the resource you want to compare against
- Shareable URLs: `/compare?kind=&apiGroup=&a=ns/name&b=ns/name`
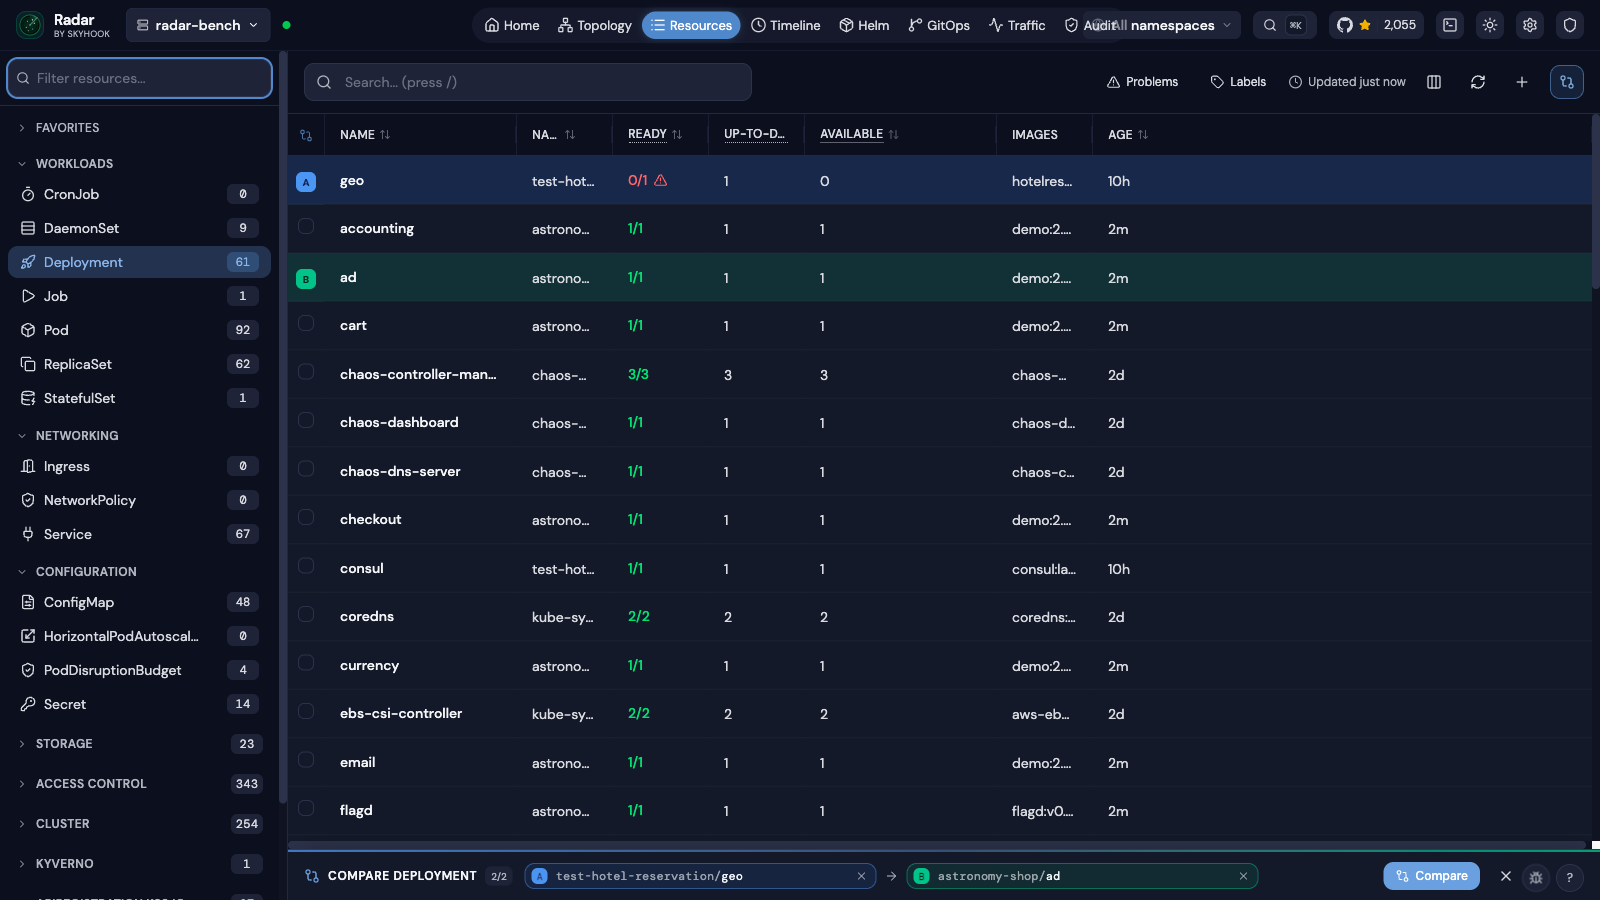
Compare mode in the resource table — pick two rows, hit Compare
### TLS Certificate Management
View TLS certificate details and expiry dates across all namespaces — catch expiring certificates before they cause outages.
- Parses TLS secrets to show certificate subject, issuer, and validity period
- Dashboard-level certificate expiry overview
- Available from the resource detail view for any TLS-type Secret
### GitOps
Monitor, diagnose, and manage FluxCD and ArgoCD resources from a dedicated GitOps workspace.
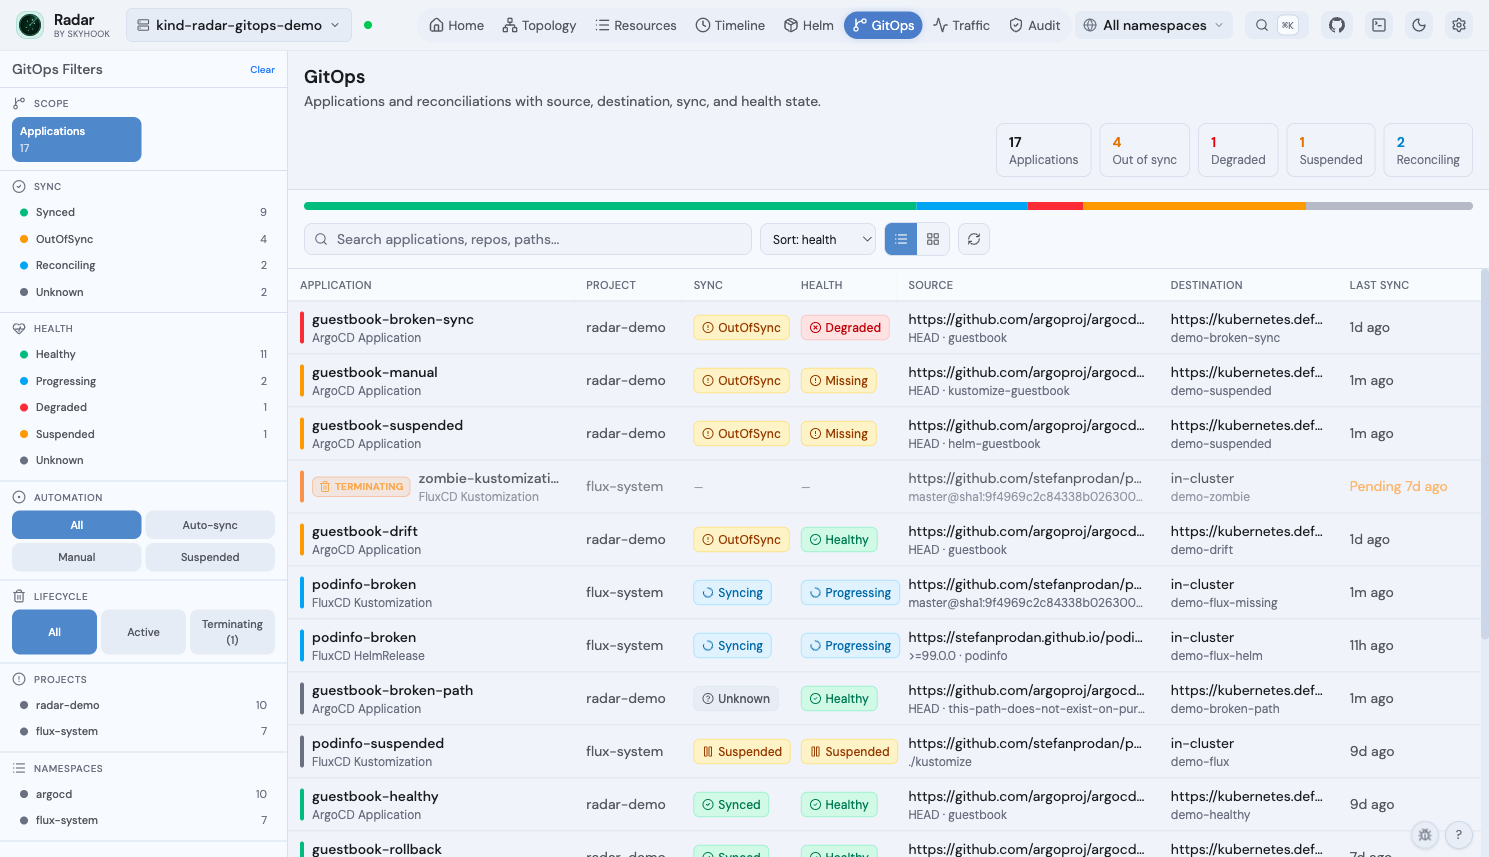
GitOps fleet view — Argo + Flux applications side-by-side with sync, health, source, destination, and lifecycle state
- Fleet view + per-app detail page (Topology / Changes / Activity tabs) for **ArgoCD** (`Application`, `ApplicationSet`, `AppProject`) and **FluxCD** (`GitRepository`, `OCIRepository`, `HelmRepository`, `Bucket`, `Kustomization`, `HelmRelease`, `Alert`)
- **Diagnosis pipeline** — field-level drift, recent events per resource, stuck-drift-loop detection, parsed operation-failures, structured one-click remediation
- **Lifecycle awareness** — `Terminating` chip replaces stale Sync/Health badges; severity ramps with deletion age; mutating ops refuse on zombies
- **Cross-linked from the rest of Radar** — `Managed by` chip in resource drawers, GitOps routing from Topology + Timeline + Helm view, `Consumed by` panel on Flux source CRs
- **MCP integration** — `manage_gitops` exposes sync / suspend / resume / reconcile / rollback with lifecycle-aware refusal
See the [GitOps guide](docs/gitops.md) for the full feature matrix, RBAC requirements, demo cluster, and single-cluster scope notes.
### Traffic
Visualize live network traffic between services using Hubble or Caretta.
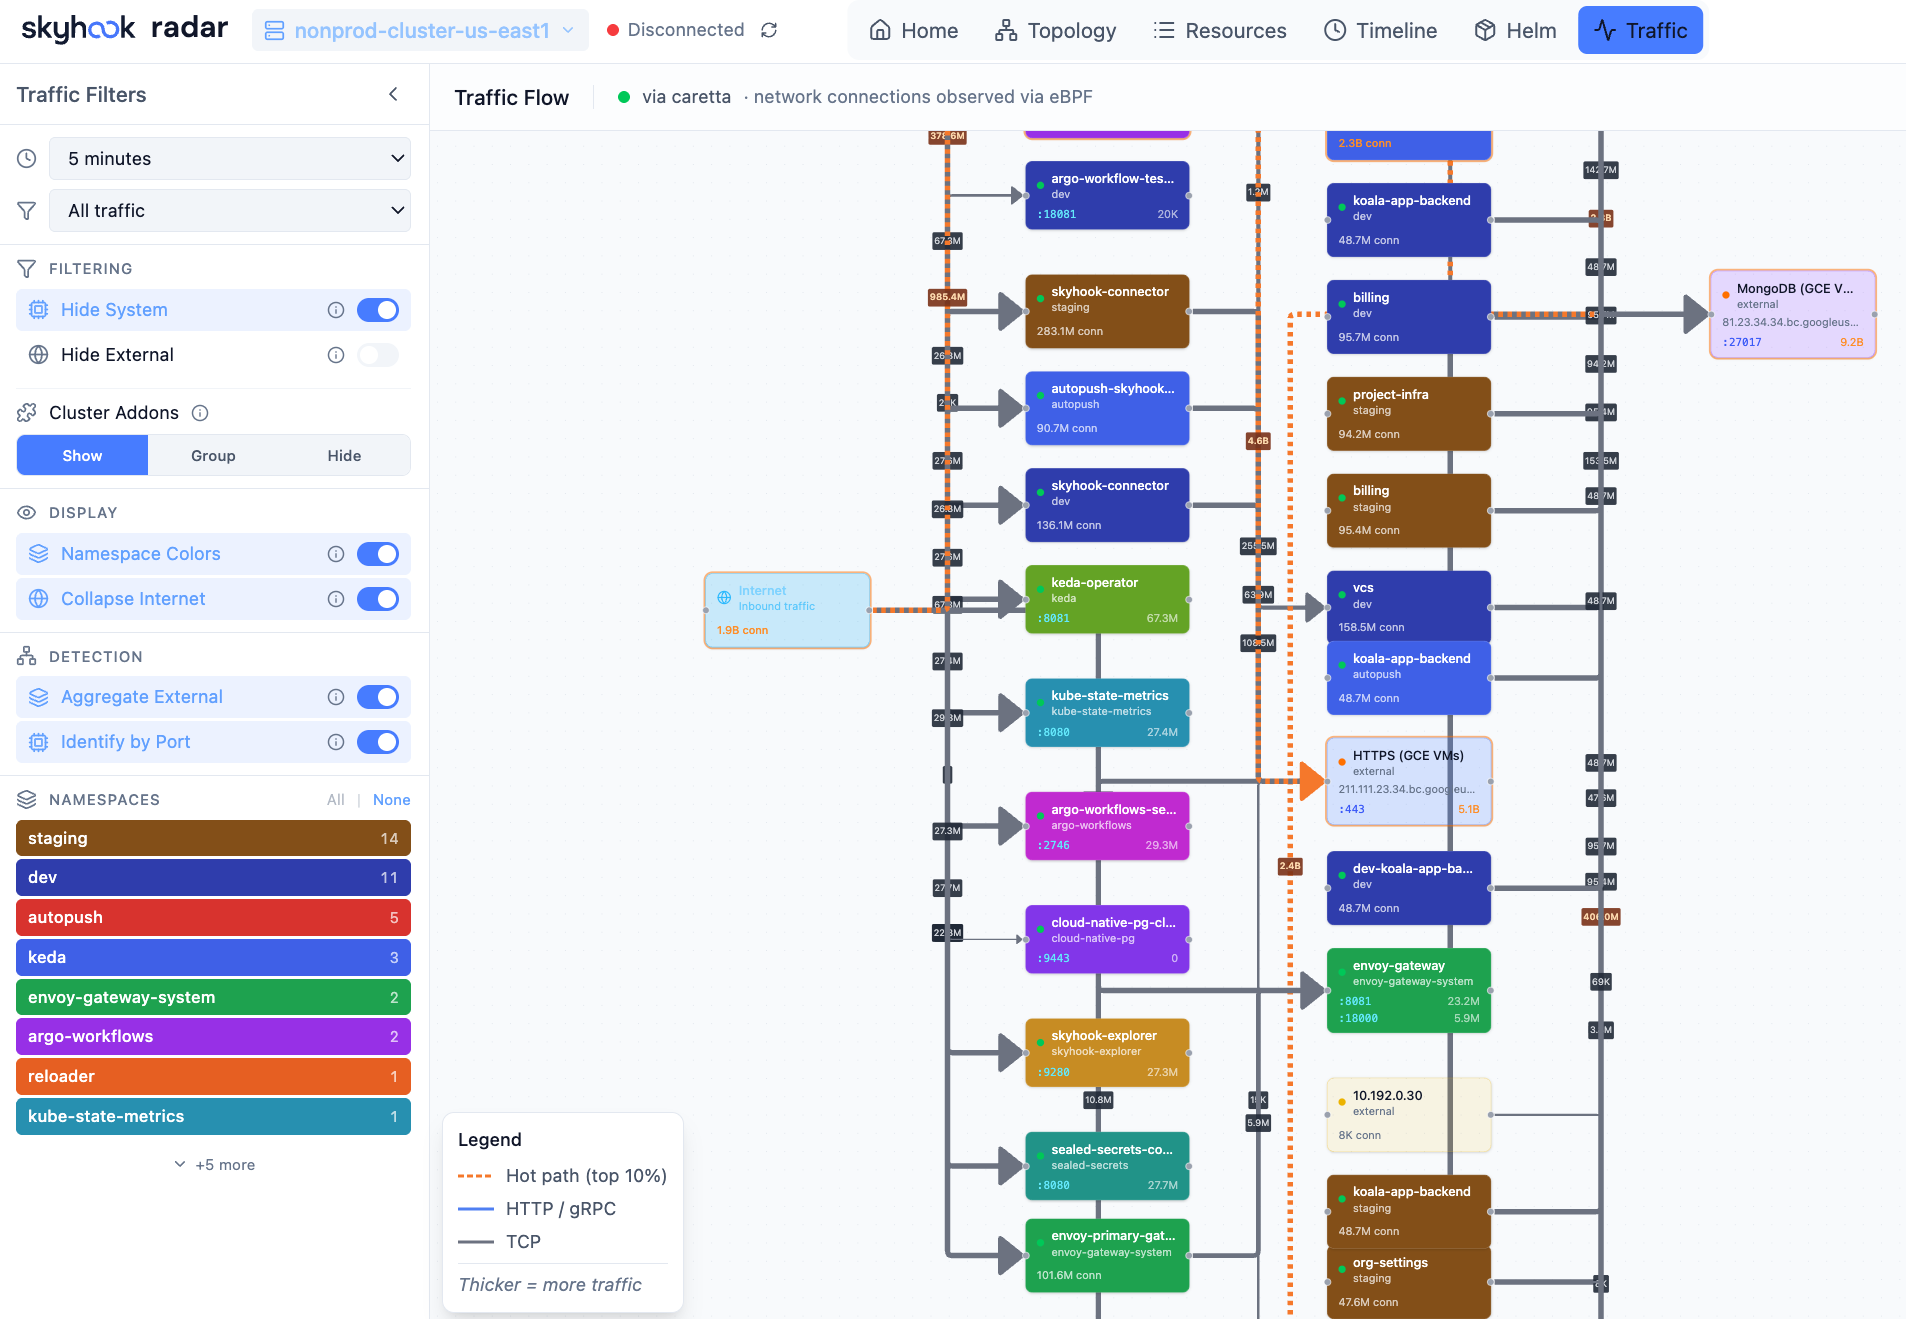
Traffic View — See how services communicate in real-time
- Auto-detects Hubble (Cilium), Caretta, or Istio as traffic data sources
- Animated flow graph showing requests per second between services
- Filter by namespace, protocol, or status code
- Setup wizard to install a traffic source if none is detected
### Cost Insights
Track Kubernetes spending with OpenCost integration — no additional configuration needed.
- Cluster hourly and projected monthly cost, top namespaces by spend
- Cost trend charts with 6h/24h/7d range selector
- Namespace and workload-level cost breakdowns with efficiency scoring
- Node costs with instance type and region pricing
- Appears automatically when OpenCost metrics are detected in Prometheus
### Cluster Audit
Proactive best-practices scanner with 31 checks across security, reliability, and efficiency — inspired by Polaris, Kubescape, Trivy, and NSA/CISA guidelines. Runs instantly against cached data with zero cluster-side installation.
- Security: privileged containers, privilege escalation, dangerous/insecure capabilities, host namespaces, container runtime socket mounts, sensitive host paths, secrets in ConfigMaps, auto-mounted service account tokens
- Reliability: missing probes, image tag `latest`, single-replica deployments, missing PDB/topology spread, pod HA risk (all replicas on same node), orphan services/ingresses, deprecated API versions
- Efficiency: missing CPU/memory requests and limits, orphan ConfigMaps/Secrets, resource utilization vs requests
- Grouped-by-resource and by-namespace views with search, category/severity/framework filters
- Each finding includes description and remediation guidance, with inline hide actions (per-check, per-category, per-namespace)
- Configurable: ignored namespaces (with wildcard patterns), disabled checks, persisted across sessions
- Framework labels: NSA/CISA, CIS benchmarks
- MCP tool (`get_cluster_audit`) for AI-assisted cluster analysis
### Access Control (RBAC visibility)
Inspect what any ServiceAccount can actually do — without three `kubectl describe` calls.
- **ServiceAccount detail**: direct bindings, effective permissions (per-binding and deduplicated flat view), inherited grants via implicit groups (`system:authenticated`, `system:serviceaccounts`), and "Used by Pods" closing the loop
- **Pod detail**: "Permissions" section showing the most-permissive rules the Pod's SA grants, plus a blast-radius alert when the SA has wildcards, cluster-admin, escalation verbs, or cluster-wide `create pods`
- **Workload detail** (Deployment / StatefulSet / DaemonSet): same Permissions section framed at the workload level — every Pod the workload spawns inherits these grants
- **Namespace detail**: RBAC summary with RoleBindings configured here + ClusterRoleBindings whose subjects reference this namespace
- **Role / ClusterRole detail**: who is bound to this role, with subject summaries inline
- **RoleBinding detail**: inline preview of the rules the binding grants + warnings when subjects include wide groups (`system:authenticated`, `system:unauthenticated`, `system:masters`)
- **"My Permissions" panel**: namespace-scoped live `SelfSubjectRulesReview` for the current user — for fast "why can't I do X" debugging
- **MCP**: `get_subject_permissions` tool exposes the same data to AI assistants for "is this SA over-privileged?" / "blast radius if compromised?" queries
Considered for follow-ups, deliberately not in this pass — RBAC audit checks (wildcard / cluster-admin / orphan-binding / unused-role detection, Kubescape-aligned), a verb × resource matrix view on the SA page (rakkess-style), a "Subject Explorer" top-level page for browsing Users / Groups without a detail page today, a graph topology view of Subject → Binding → Role → Rule (`rbac-tool viz` style), in-UI binding edits, and a "can-i" free-form query UI. Read-only visibility ships first; we'll come back once we see how operators use the reverse-lookup.
### AI Integration (MCP) beta
Radar includes a built-in [Model Context Protocol](https://modelcontextprotocol.io) (MCP) server that lets AI assistants — Claude, Cursor, Copilot, and others — query your cluster through Radar.
Instead of raw `kubectl` output (verbose YAML that burns through LLM context windows), your AI gets pre-processed, token-optimized data: topology graphs, health assessments, deduplicated events, and filtered logs. Read tools are strictly read-only; write tools (restart, scale, sync) are clearly annotated and non-destructive.
Enabled by default. Disable with `--no-mcp`. See the **[MCP Guide](docs/mcp.md)** for setup instructions.
### Authentication
For shared in-cluster deployments, Radar supports optional user authentication with per-user Kubernetes RBAC.
- **Proxy mode** — works with oauth2-proxy, Pomerium, Cloudflare Access, or any auth proxy that sets forwarded headers
- **OIDC mode** — built-in login via Google, Okta, Dex, Keycloak, or any OIDC provider
- Per-user namespace scoping and write authorization via K8s impersonation
- UI adapts automatically — buttons only appear if the user has RBAC permission
No auth by default (local use). See the **[Authentication Guide](docs/authentication.md)** for setup.
---
## Supported Resources
Radar auto-discovers any CRD in your cluster. Popular tools get [dedicated integrations](docs/integrations.md) with topology edges, detail views, and AI summaries.
**Default chart RBAC** covers the built-in Kubernetes kinds listed below — Workloads, Networking (including NetworkPolicies and PodDisruptionBudgets), Configuration, Storage (PersistentVolumes, PersistentVolumeClaims, StorageClasses), HorizontalPodAutoscalers, ServiceAccounts, LimitRanges, ResourceQuotas, Nodes, Namespaces, and Events. RBAC objects (Roles, ClusterRoles, RoleBindings, ClusterRoleBindings) are opt-in via `rbac.viewRBAC=true`. **CRD-based integrations** (Gateway API, VerticalPodAutoscaler, ArgoCD, FluxCD, cert-manager, etc.) need both the CRD installed in your cluster *and* read access granted — most groups are default-on under `rbac.crdGroups.` (e.g. `gatewayApi`, `verticalPodAutoscaler`); check `values.yaml` or add custom rules via `rbac.additionalRules`.
| Category | Resources |
|----------|-----------|
| **Workloads** | Deployments, DaemonSets, StatefulSets, ReplicaSets, Pods, Jobs, CronJobs |
| **Networking** | Services, Ingresses, NetworkPolicies, Endpoints, EndpointSlices, PodDisruptionBudgets |
| **Configuration** | ConfigMaps, Secrets (names only, values hidden), LimitRanges, ResourceQuotas |
| **Storage** | PersistentVolumeClaims, PersistentVolumes, StorageClasses |
| **Autoscaling** | HorizontalPodAutoscalers, VerticalPodAutoscalers |
| **Cluster** | Nodes, Namespaces, ServiceAccounts, Events |
| **GitOps (FluxCD)** | GitRepository, OCIRepository, HelmRepository, Kustomization, HelmRelease, Alert |
| **GitOps (ArgoCD)** | Application, ApplicationSet, AppProject |
| **Argo Rollouts** | Rollout |
| **Argo Workflows** | Workflow, WorkflowTemplate |
| **cert-manager** | Certificate, CertificateRequest, Order, Challenge, Issuer, ClusterIssuer |
| **Gateway API** | Gateway, GatewayClass, HTTPRoute, GRPCRoute, TCPRoute, TLSRoute |
| **Istio** | VirtualService, DestinationRule, Gateway, ServiceEntry, PeerAuthentication, AuthorizationPolicy |
| **Traefik** | IngressRoute, IngressRouteTCP, IngressRouteUDP, Middleware, MiddlewareTCP, TraefikService, ServersTransport, ServersTransportTCP, TLSOption, TLSStore |
| **Contour** | HTTPProxy |
| **Knative Serving** | Service, Configuration, Revision, Route, DomainMapping |
| **Knative Eventing** | Broker, Trigger, EventType, Channel, InMemoryChannel, Subscription |
| **Knative Sources** | PingSource, ApiServerSource, ContainerSource, SinkBinding |
| **Knative Flows** | Sequence, Parallel |
| **Knative Networking** | Ingress, Certificate, ServerlessService |
| **Karpenter** | NodePool, NodeClaim (+ provider-specific NodeClasses via auto-discovery) |
| **KEDA** | ScaledObject, ScaledJob, TriggerAuthentication, ClusterTriggerAuthentication |
| **Prometheus Operator** | ServiceMonitor, PodMonitor, PrometheusRule, Alertmanager |
| **Security (Trivy)** | VulnerabilityReport, ConfigAuditReport, ExposedSecretReport, ClusterComplianceReport, SbomReport, RbacAssessmentReport, InfraAssessmentReport |
| **Velero** | Backup, Restore, Schedule, BackupStorageLocation, VolumeSnapshotLocation |
| **External Secrets** | ExternalSecret, ClusterExternalSecret, SecretStore, ClusterSecretStore |
| **CloudNativePG** | Cluster, Backup, ScheduledBackup, Pooler |
| **Crossplane** | Managed Resources (any provider), Composite Resources, Claims, Provider, ProviderConfig, Function, Configuration, Composition, CompositionRevision, XRD |
| **Kyverno** | Policy, ClusterPolicy, PolicyReport, ClusterPolicyReport |
| **Sealed Secrets** | SealedSecret |
| **Cost (OpenCost)** | Namespace/workload/node cost breakdown via Prometheus (no CRDs) |
| **CRDs** | Any Custom Resource Definition in your cluster (auto-discovered) |
---
## Keyboard Shortcuts
| Shortcut | Action |
|----------|--------|
| `1`–`6` | Switch view (Home, Topology, Resources, Timeline, Helm, Traffic) |
| `t` | Toggle dark/light theme |
| `?` | Show keyboard shortcuts |
| `⌘K` | Open command palette |
| `/` | Focus search (context-aware) |
| `f` | Fit topology to screen |
| `+` / `-` / `0` | Zoom in / out / reset (topology) |
| `j` / `k` | Navigate rows (resources, helm) |
| `g g` / `G` | Jump to first / last row |
| `Enter` / `d` | Open selected resource detail |
| `y` | Open YAML view |
| `l` | Open logs (pods/workloads) |
| `[` / `]` | Previous / next resource kind |
| `Escape` | Close panel/modal/search |
**Topology:** Pan (drag), Zoom (scroll), Select (click), Multi-select (Shift+click)
---
## Development
See the **[Development Guide](DEVELOPMENT.md)** for building from source, architecture details, API reference, and contributing.
Quick start:
```bash
git clone https://github.com/skyhook-io/radar.git
cd radar
make deps
# Terminal 1: Frontend with hot reload (port 9273)
make watch-frontend
# Terminal 2: Backend with hot reload (port 9280)
make watch-backend
```
---
## Contributing
Contributions are welcome! Please read our [Contributing Guide](CONTRIBUTING.md) for details on the development workflow, pull request process, and coding standards.
---
## About
Radar is built and maintained by [Skyhook](https://skyhook.io) (YC W23) and is open source under Apache-2.0. The OSS version is fully featured and the recommended way to run Radar.
For teams that want hosted multi-cluster Radar with SSO and shared dashboards, we also offer [Radar Cloud](https://radarhq.io).
---
## License
Apache 2.0 — see [LICENSE](LICENSE)
---
Open source. Free forever.
Built by Skyhook