
# 🔌 dsh-mcp-view
### See every MCP server & tool in your DeepSeek Harness session — right in the Web GUI.
**English** · [中文](README.zh.md) · [Русский](README.ru.md)
[](LICENSE)
[](https://www.npmjs.com/package/dsh-mcp-view)
[](#)
[](#)
[](#)
[](#contributing)
[](https://github.com/beancookie/awesome-dsh-plugin)
*A floating MCP inventory panel for the DSH sidebar: servers grouped, tools with JSON schemas, live search, and **last-used times pulled from real session logs** — nothing invented.*
---
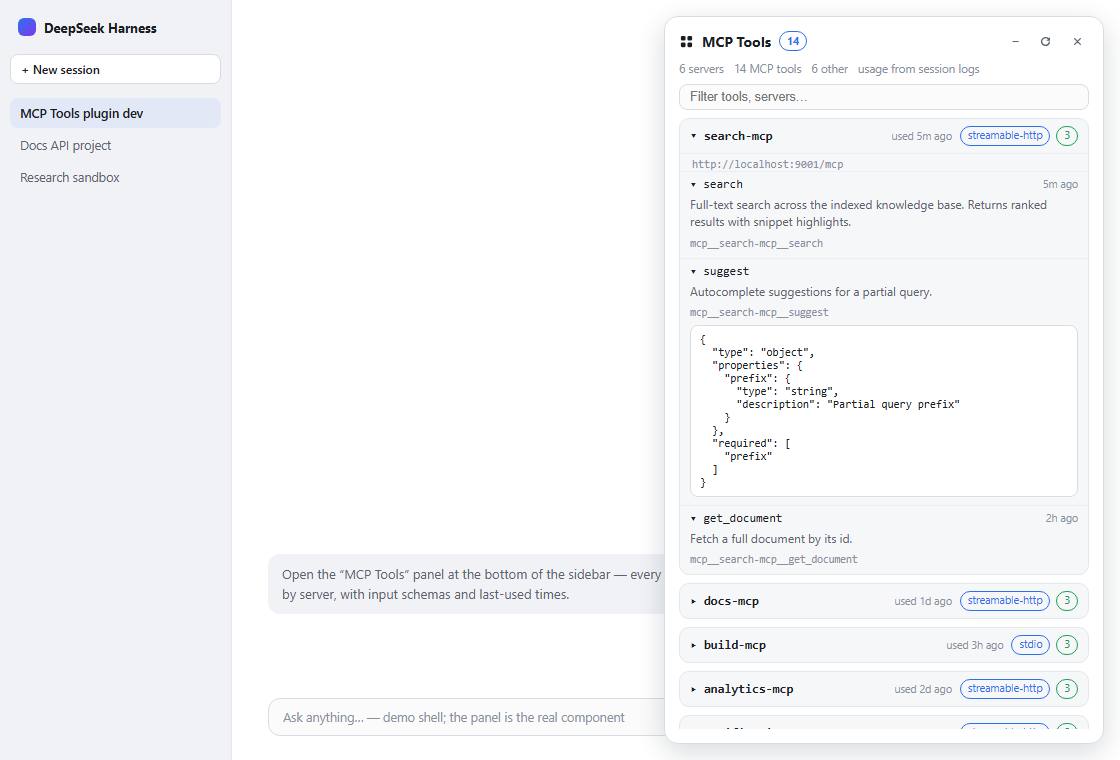
DSH runs your MCP servers (docs, build & analytics — whatever you have configured) and registers their tools into the shared `mcp__*` namespace — but there was **no UI to see them**. This plugin adds a one-click panel that answers: *what MCP servers are configured, which tools are registered, what their input schemas look like, and when each was last used.*
## ✨ Features
| | |
|---|---|
| 🖥 **All servers, one panel** | Every `dsh-mcp-client` instance in your profile, with transport (`stdio` / `streamable-http`) and endpoint (command or URL), plus connection state (active / disabled / no tools). |
| 🗂 **Collapsed by default** | Servers are folded into a single compact row; one click expands the tool list. `+` / `−` in the header expands or collapses everything. |
| 🧬 **Full JSON schemas** | Each tool shows its raw name, description and the exact `inputSchema` the model sees — expandable, prettified. |
| 🕘 **Last-used times & usage** | Derived from real `tool/call` events in `~/.dsh/sessions/**/session.jsonl[.zstd]` — per tool *and* per server, plus a **Usage** tab with total calls, a calls-per-day chart and the most-used tools. |
| 🔍 **Live search** | Filter by tool name, raw name, description, server **or parameter names**; auto-refresh every 10 s plus a manual refresh button. |
| 🎯 **Per-session view** | Toggle to see only the tools the current session's agent really sees (resolved from the session's agent scope). |
| ❤️ **Favorites & sorting** | Star servers/tools; sort by name / tools / last-used / favorites. State persists in `localStorage`. |
| ⚕️ **Health checks** | One-click probe of streamable-http endpoints (HEAD) → up/down badge per server. |
| 📤 **Export** | Download the whole inventory as JSON or Markdown. |
| 🧩 **Non-MCP context** | A collapsible list of the other (built-in / plugin) globally-registered tools, so you can see the whole tool landscape at a glance. |
## ⚙️ Configuration
The plugin accepts an optional `config` object on its row in `cordis.patch.yml`:
```yaml
- insert:
- id: mcp-view
name: 'dsh-mcp-view'
config:
enabled: true # master switch (default true)
announceToAgent: true # announce the plugin in the model's prompt band (default true)
```
## 📸 Screenshots
| | Light | Dark |
|---|---|---|
| **Servers** |  | 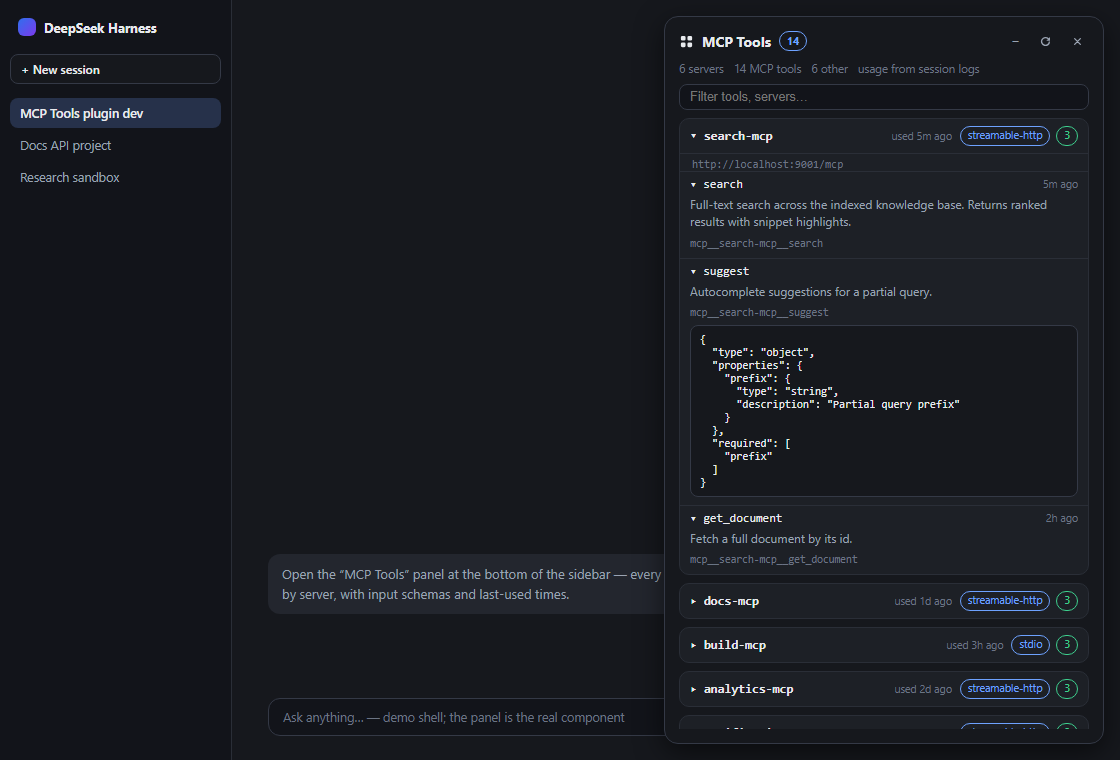 |
| **Usage** | 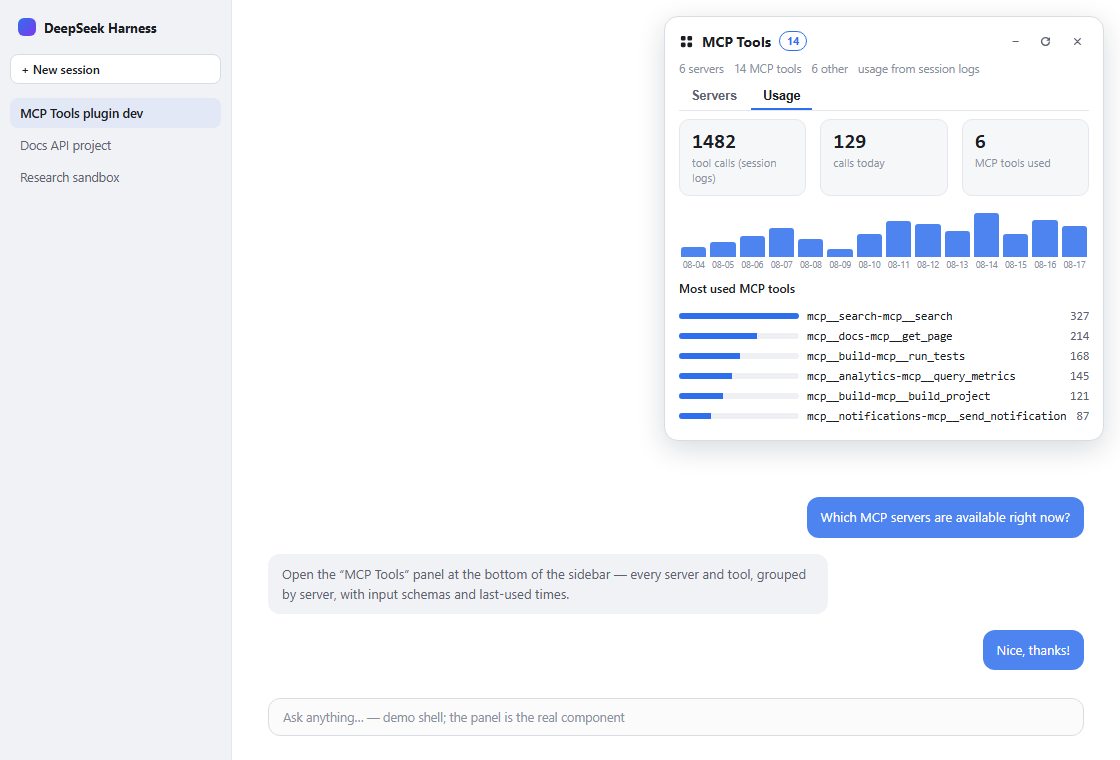 | 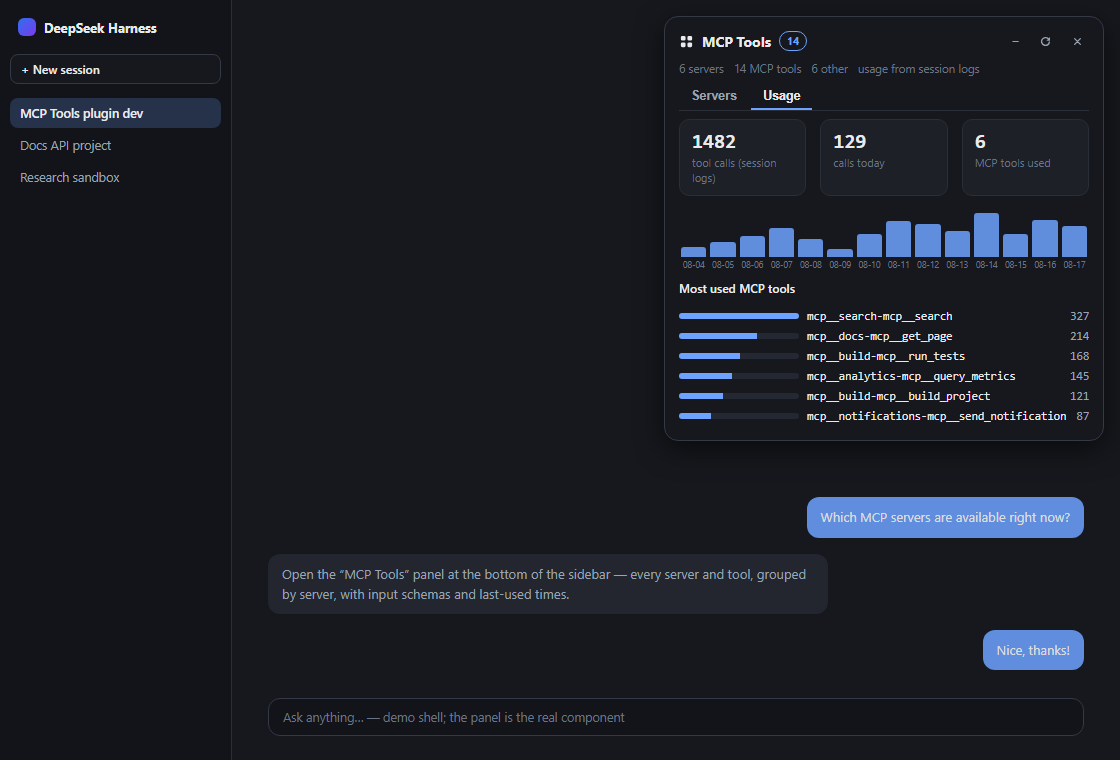 |
## ⚡ Quick start
```sh
git clone https://github.com/stopchewing/dsh-mcp-view.git
cd dsh-mcp-view
dsh plugin --profile web add link:$(pwd)
```
Then **restart `dsh web`** and refresh the page — a **「MCP Tools」** button appears at the bottom of the sidebar.
## 📦 Install
### From npm
```sh
dsh plugin --profile web add dsh-mcp-view
```
### From the repository
```sh
git clone https://github.com/stopchewing/dsh-mcp-view.git
dsh plugin --profile web add link:/absolute/path/to/dsh-mcp-view
```
### Manual (no CLI)
1. Put this package into the profile's `node_modules` (copy, or a junction on Windows):
```powershell
New-Item -ItemType Junction -Path "$env:USERPROFILE\.dsh\profiles\web\node_modules\dsh-mcp-view" -Target "