 \n",
"\n",
"Ref: https://en.wikipedia.org/wiki/DBSCAN\n",
"\n",
"## DBScan using sklearn\n",
"\n",
"We will have to specify epsilon and a natural number minPoints. Let us use values\n",
"epsilon = 0.09\n",
"and minPoints = 5.\n",
"\n",
"```python\n",
"db = DBSCAN(eps=0.06, min_samples=5)\n",
"db.fit(X)\n",
"labels = db.labels_\n",
"```\n",
"
\n",
"\n",
"Ref: https://en.wikipedia.org/wiki/DBSCAN\n",
"\n",
"## DBScan using sklearn\n",
"\n",
"We will have to specify epsilon and a natural number minPoints. Let us use values\n",
"epsilon = 0.09\n",
"and minPoints = 5.\n",
"\n",
"```python\n",
"db = DBSCAN(eps=0.06, min_samples=5)\n",
"db.fit(X)\n",
"labels = db.labels_\n",
"```\n",
"Use .fit and .labels_ for fitting the dbscan and accessing the cluster labels respectively.
" ] }, { "cell_type": "code", "execution_count": null, "metadata": { "collapsed": true, "tags": [ "s1", "l1", "ans" ] }, "outputs": [], "source": [ "db.fit(X)\n", "labels = db.labels_\n", "\n", "# Create a data frame and visualize the plot.\n", "moon_df['db_clus'] = labels\n", "g=sns.pairplot(x_vars=\"X_0\", y_vars=\"X_1\", hue = \"db_clus\", data = moon_df)\n", "g.fig.set_size_inches(14, 6)\n", "sns.despine()" ] }, { "cell_type": "code", "execution_count": null, "metadata": { "collapsed": true, "tags": [ "s1", "hid", "l1" ] }, "outputs": [], "source": [ "ref_tmp_var = False\n", "\n", "\n", "try:\n", " ref_assert_var = False\n", " db_ = DBSCAN(eps=0.06, min_samples=5)\n", " db_.fit(X)\n", " \n", " import numpy as np\n", " \n", " if np.all(moon_df['db_clus'] == db_.labels_):\n", " ref_assert_var = True\n", " out = g\n", " else:\n", " ref_assert_var = False\n", " \n", "except Exception:\n", " print('Please follow the instructions given and use the same variables provided in the instructions.')\n", "else:\n", " if ref_assert_var:\n", " ref_tmp_var = True\n", " else:\n", " print('Please follow the instructions given and use the same variables provided in the instructions.')\n", "\n", "\n", "assert ref_tmp_var" ] }, { "cell_type": "markdown", "metadata": { "tags": [ "l2", "content", "s2" ] }, "source": [ "\n", "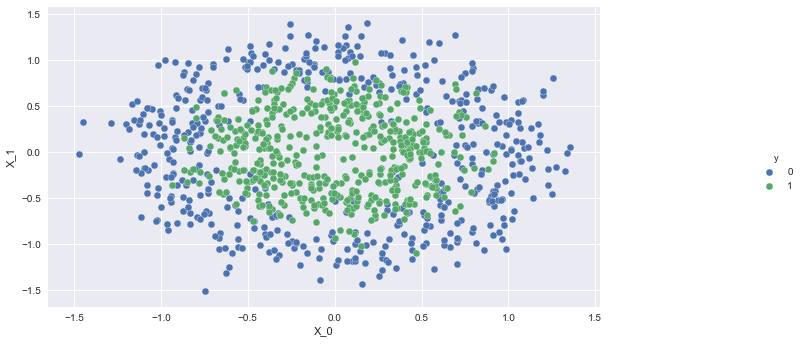 \n",
"\n",
"
\n",
"\n",
"Transform the data into a dataframe and plot the result with a hue as the cluster labels.
" ] }, { "cell_type": "code", "execution_count": null, "metadata": { "collapsed": true, "tags": [ "l2", "s2", "ans" ] }, "outputs": [], "source": [ "db.fit(X)\n", "labels = db.labels_\n", "noisy_circles = pd.DataFrame({'X_0':X[:,0], 'X_1':X[:,1], 'y':labels})\n", "g = sns.pairplot(x_vars=\"X_0\", y_vars=\"X_1\", hue = \"y\", data = noisy_circles)\n", "g.fig.set_size_inches(14, 6)\n", "sns.despine()" ] }, { "cell_type": "code", "execution_count": null, "metadata": { "collapsed": true, "tags": [ "l2", "hid", "s2" ] }, "outputs": [], "source": [ "ref_tmp_var = False\n", "\n", "\n", "try:\n", " ref_assert_var = False\n", " import numpy as np\n", " \n", " db_ = DBSCAN(eps=0.5, min_samples=5)\n", " db_.fit(X)\n", " \n", " if np.all(db_.labels_ == labels):\n", " ref_assert_var = True\n", " out = g\n", " else:\n", " ref_assert_var = False\n", " \n", "except Exception:\n", " print('Please follow the instructions given and use the same variables provided in the instructions.')\n", "else:\n", " if ref_assert_var:\n", " ref_tmp_var = True\n", " else:\n", " print('Please follow the instructions given and use the same variables provided in the instructions.')\n", "\n", "\n", "assert ref_tmp_var" ] } ], "metadata": { "executed_sections": [], "kernelspec": { "display_name": "Python 3", "language": "python", "name": "python3" }, "language_info": { "codemirror_mode": { "name": "ipython", "version": 3 }, "file_extension": ".py", "mimetype": "text/x-python", "name": "python", "nbconvert_exporter": "python", "pygments_lexer": "ipython3", "version": "3.6.0" }, "rf_version": 1 }, "nbformat": 4, "nbformat_minor": 2 }