 \n",
"\n",
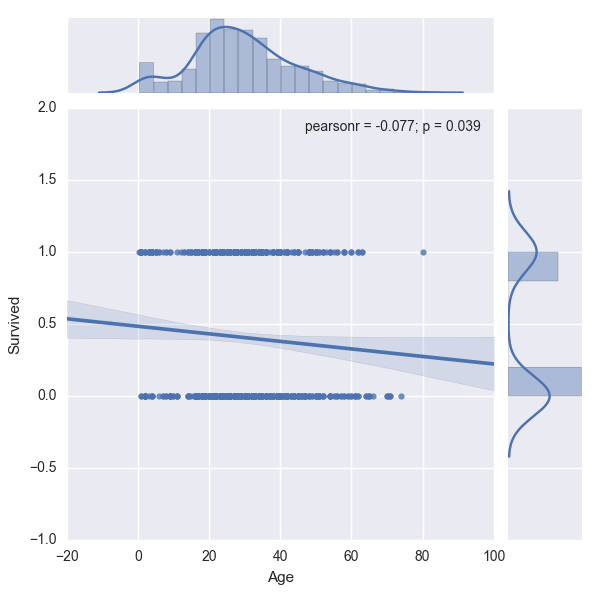
"As you can see above the line does not pass through the data points. If they were to pass through the data points and 'fit' the data approximately well, then a Linear Regression model would be useful. Also, there are a good number of overlaps of 0s and 1s for the same value of X. This means that for a given age, it is difficult to tell if the person aboard the Titanic survived or dead easily with the above graph. This problem can be clearly identified as a classification problem as the output is a finite number, either a 0 or a 1. This is also an example of how Exploratory Data Analysis (EDA) can be useful by plotting the output variable, 'Survived' against one of the independent variables, 'Age'.\n",
"\n",
"\n",
"We cannot use a linear regression to model a binary response, because the predicted values of $y$ will not be limited to 0 or 1. Instead of $y$, we could model probability of $y$, but even then, the predicted values cannot be limited to values between 0 and 1. Also, the relationship is not linear, but sigmoidal or S-shaped. In such cases, a function of the probability is used. The most frequently used is the logit function which is the natural log of the odds of success. The logistic regression model is expressed as shown below.\n",
"\n",
"$Ln \\big(\\frac{p(y)}{1-p(y)}\\big) = \\beta_0 + \\sum\\limits_{i=0}^{n}X_i\\beta_i \\quad$ where $p(y)$ is the probability of success.\n",
"\n",
"\n",
"The sigmoid function that is used in logistic regression is shown below:\n",
"\n",
"\n",
"
\n",
"\n",
"As you can see above the line does not pass through the data points. If they were to pass through the data points and 'fit' the data approximately well, then a Linear Regression model would be useful. Also, there are a good number of overlaps of 0s and 1s for the same value of X. This means that for a given age, it is difficult to tell if the person aboard the Titanic survived or dead easily with the above graph. This problem can be clearly identified as a classification problem as the output is a finite number, either a 0 or a 1. This is also an example of how Exploratory Data Analysis (EDA) can be useful by plotting the output variable, 'Survived' against one of the independent variables, 'Age'.\n",
"\n",
"\n",
"We cannot use a linear regression to model a binary response, because the predicted values of $y$ will not be limited to 0 or 1. Instead of $y$, we could model probability of $y$, but even then, the predicted values cannot be limited to values between 0 and 1. Also, the relationship is not linear, but sigmoidal or S-shaped. In such cases, a function of the probability is used. The most frequently used is the logit function which is the natural log of the odds of success. The logistic regression model is expressed as shown below.\n",
"\n",
"$Ln \\big(\\frac{p(y)}{1-p(y)}\\big) = \\beta_0 + \\sum\\limits_{i=0}^{n}X_i\\beta_i \\quad$ where $p(y)$ is the probability of success.\n",
"\n",
"\n",
"The sigmoid function that is used in logistic regression is shown below:\n",
"\n",
"\n",
" \n",
"\n",
"\n",
"
\n",
"\n",
"\n",
"| \n", " | PassengerId | \n", "Survived | \n", "Pclass | \n", "Name | \n", "Sex | \n", "Age | \n", "SibSp | \n", "Parch | \n", "Ticket | \n", "Fare | \n", "Cabin | \n", "Embarked | \n", "
|---|---|---|---|---|---|---|---|---|---|---|---|---|
| 0 | \n", "1 | \n", "0 | \n", "3 | \n", "Braund, Mr. Owen Harris | \n", "male | \n", "22.0 | \n", "1 | \n", "0 | \n", "A/5 21171 | \n", "7.2500 | \n", "NaN | \n", "S | \n", "
| 1 | \n", "2 | \n", "1 | \n", "1 | \n", "Cumings, Mrs. John Bradley (Florence Briggs Th... | \n", "female | \n", "38.0 | \n", "1 | \n", "0 | \n", "PC 17599 | \n", "71.2833 | \n", "C85 | \n", "C | \n", "
| 2 | \n", "3 | \n", "1 | \n", "3 | \n", "Heikkinen, Miss. Laina | \n", "female | \n", "26.0 | \n", "0 | \n", "0 | \n", "STON/O2. 3101282 | \n", "7.9250 | \n", "NaN | \n", "S | \n", "
| 3 | \n", "4 | \n", "1 | \n", "1 | \n", "Futrelle, Mrs. Jacques Heath (Lily May Peel) | \n", "female | \n", "35.0 | \n", "1 | \n", "0 | \n", "113803 | \n", "53.1000 | \n", "C123 | \n", "S | \n", "
| 4 | \n", "5 | \n", "0 | \n", "3 | \n", "Allen, Mr. William Henry | \n", "male | \n", "35.0 | \n", "0 | \n", "0 | \n", "373450 | \n", "8.0500 | \n", "NaN | \n", "S | \n", "
Think of a command that can be used to print the unique values in a column.
" ] }, { "cell_type": "code", "execution_count": 2, "metadata": { "tags": [ "s1", "l1", "ans" ] }, "outputs": [ { "name": "stdout", "output_type": "stream", "text": [ "[0 1]\n" ] } ], "source": [ "titanic_stats = train_data['Survived'].unique()\n", "print(titanic_stats)" ] }, { "cell_type": "code", "execution_count": 3, "metadata": { "tags": [ "s1", "hid", "l1" ] }, "outputs": [ { "name": "stdout", "output_type": "stream", "text": [ "continue\n" ] } ], "source": [ "ref_tmp_var = False\n", "\n", "\n", "try:\n", " ref_assert_var = False\n", " titanic_stats_ = train_data['Survived'].unique()\n", " \n", " if np.all(titanic_stats == titanic_stats_):\n", " ref_assert_var = True\n", " else:\n", " ref_assert_var = False\n", " \n", "except Exception:\n", " print('Please follow the instructions given and use the same variables provided in the instructions.')\n", "else:\n", " if ref_assert_var:\n", " ref_tmp_var = True\n", " else:\n", " print('Please follow the instructions given and use the same variables provided in the instructions.')\n", "\n", "\n", "assert ref_tmp_var" ] }, { "cell_type": "markdown", "metadata": { "tags": [ "l2", "content", "s2" ] }, "source": [ "\n", "\n", "\n", "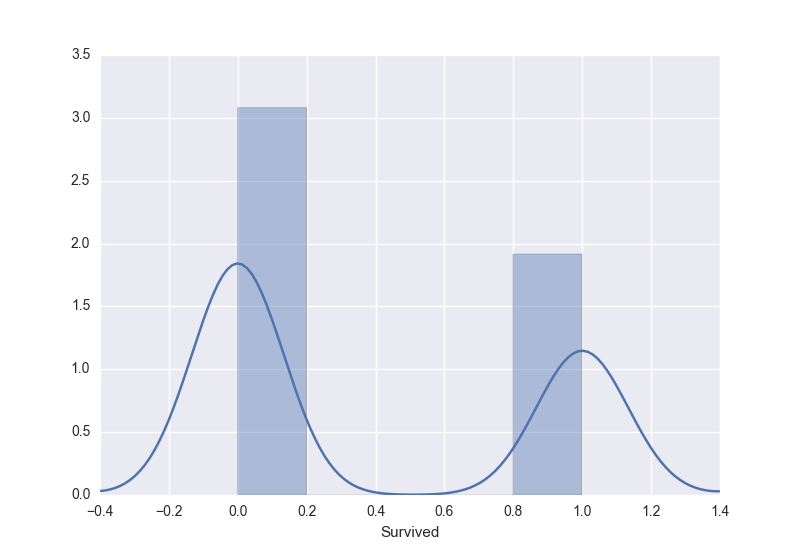 \n",
"\n",
"From the above distribution, it can be observed that those who survived are approximately 2/3rd in the training set.We can observe that there were children and mostly adults followed by lesser aged people with max of 80 years approximately. This can be observed by two peaks in the fitted distribution.\n",
"\n",
"
\n",
"\n",
"From the above distribution, it can be observed that those who survived are approximately 2/3rd in the training set.We can observe that there were children and mostly adults followed by lesser aged people with max of 80 years approximately. This can be observed by two peaks in the fitted distribution.\n",
"\n",
"train_data[train_data['Age'].notnull() shows which rows have Age columns with values and not NaNs. Now reference the age over this dataframe and pass this into the function.
" ] }, { "cell_type": "code", "execution_count": 5, "metadata": { "tags": [ "l2", "s2", "ans" ] }, "outputs": [ { "name": "stderr", "output_type": "stream", "text": [ "C:\\Users\\Kshitij\\Anaconda3\\lib\\site-packages\\statsmodels\\nonparametric\\kdetools.py:20: VisibleDeprecationWarning: using a non-integer number instead of an integer will result in an error in the future\n", " y = X[:m/2+1] + np.r_[0,X[m/2+1:],0]*1j\n" ] } ], "source": [ "sns.plt.ylabel('Probability')\n", "dist_plot = sns.distplot(train_data[train_data['Age'].notnull()].Age)" ] }, { "cell_type": "code", "execution_count": 6, "metadata": { "tags": [ "l2", "hid", "s2" ] }, "outputs": [ { "name": "stdout", "output_type": "stream", "text": [ "continue\n" ] }, { "name": "stderr", "output_type": "stream", "text": [ "C:\\Users\\Kshitij\\Anaconda3\\lib\\site-packages\\statsmodels\\nonparametric\\kdetools.py:20: VisibleDeprecationWarning: using a non-integer number instead of an integer will result in an error in the future\n", " y = X[:m/2+1] + np.r_[0,X[m/2+1:],0]*1j\n" ] } ], "source": [ "ref_tmp_var = False\n", "\n", "\n", "try:\n", " ref_assert_var = False\n", " dist_plot_ = sns.distplot(train_data[train_data['Age'].notnull()].Age)\n", " \n", " if len(dist_plot_.get_lines()[0].get_data()) == len(dist_plot.get_lines()[0].get_data()):\n", " ref_assert_var = True\n", " out = dist_plot.get_figure()\n", " else:\n", " ref_assert_var = False\n", " \n", "except Exception:\n", " print('Please follow the instructions given and use the same variables provided in the instructions.')\n", "else:\n", " if ref_assert_var:\n", " ref_tmp_var = True\n", " else:\n", " print('Please follow the instructions given and use the same variables provided in the instructions.')\n", "\n", "\n", "assert ref_tmp_var" ] }, { "cell_type": "markdown", "metadata": { "tags": [ "l3", "s3", "content" ] }, "source": [ "\n", "\n", "\n", "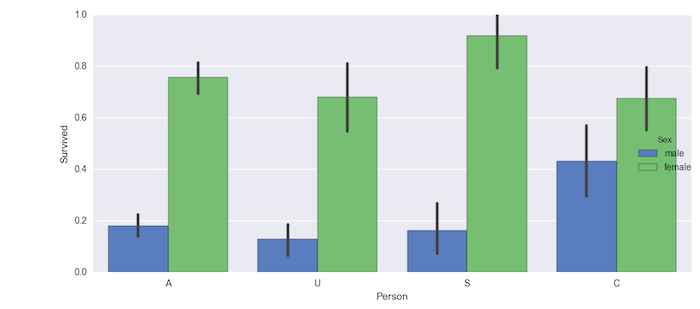 \n",
"\n",
"From the above plot you can see that senior women were most likely to survive with highest probability than anyone else. Now we can ignore the Sex type and visualize who was likely to survive.\n",
"\n",
"
\n",
"\n",
"From the above plot you can see that senior women were most likely to survive with highest probability than anyone else. Now we can ignore the Sex type and visualize who was likely to survive.\n",
"\n",
"Remove hue column as it is optional.
" ] }, { "cell_type": "code", "execution_count": 8, "metadata": { "collapsed": true, "tags": [ "l3", "s3", "ans" ] }, "outputs": [], "source": [ "g = sns.factorplot(x='Person', y='Survived', data=train_data, size=5, kind='bar', palette='muted')\n", " " ] }, { "cell_type": "code", "execution_count": 9, "metadata": { "tags": [ "l3", "s3", "hid" ] }, "outputs": [ { "name": "stdout", "output_type": "stream", "text": [ "continue\n" ] } ], "source": [ "ref_tmp_var = False\n", "\n", "\n", "try:\n", " ref_assert_var = False\n", " g_ = sns.factorplot(x='Person', y='Survived', data=train_data, size=5, kind='bar', palette='muted')\n", " \n", " if np.all(g.data.Person == g_.data.Person) and np.all(g.data.Survived == g_.data.Survived):\n", " ref_assert_var = True\n", " out = g\n", " else:\n", " ref_assert_var = False\n", " \n", "except Exception:\n", " print('Please follow the instructions given and use the same variables provided in the instructions.')\n", "else:\n", " if ref_assert_var:\n", " ref_tmp_var = True\n", " else:\n", " print('Please follow the instructions given and use the same variables provided in the instructions.')\n", "\n", "\n", "assert ref_tmp_var" ] }, { "cell_type": "markdown", "metadata": { "tags": [ "l4", "s4", "content" ] }, "source": [ "\n", "\n", "\n", "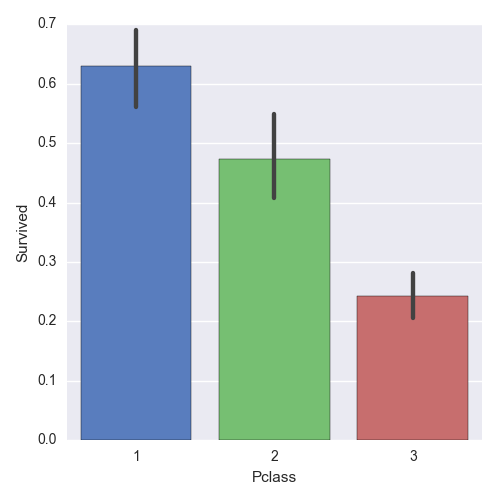 \n",
"\n",
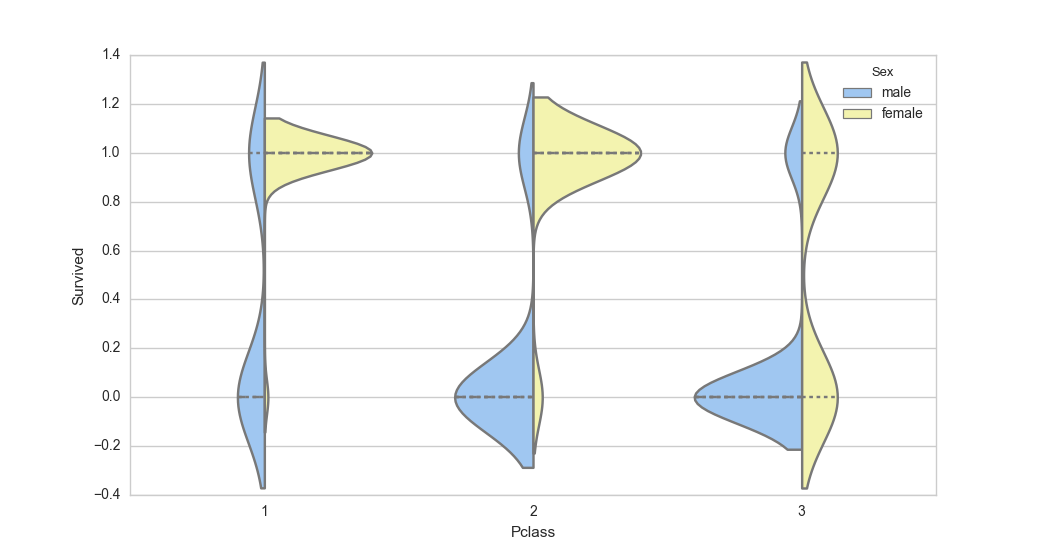
"We can see that 1st class passengers had much better chances of survival. We can also visualize the distribution of Male and Female using a violin plot. This is very useful to measure the mean and variance of passengers as to their likelihood of survival in each class grouped by Male and Female. The distribution graphs are shown on either side of the line for each class.\n",
"```python\n",
"sns.set(style=\"whitegrid\", palette=\"pastel\", color_codes=True)\n",
"sns.violinplot(x=\"Pclass\", y=\"Survived\", hue=\"Sex\", data=train_data, split=True,\n",
"... inner=\"quart\", palette={\"male\": \"b\", \"female\": \"y\"})\n",
"```\n",
"
\n",
"\n",
"We can see that 1st class passengers had much better chances of survival. We can also visualize the distribution of Male and Female using a violin plot. This is very useful to measure the mean and variance of passengers as to their likelihood of survival in each class grouped by Male and Female. The distribution graphs are shown on either side of the line for each class.\n",
"```python\n",
"sns.set(style=\"whitegrid\", palette=\"pastel\", color_codes=True)\n",
"sns.violinplot(x=\"Pclass\", y=\"Survived\", hue=\"Sex\", data=train_data, split=True,\n",
"... inner=\"quart\", palette={\"male\": \"b\", \"female\": \"y\"})\n",
"```\n",
" \n",
"\n",
"From the above plot you can see that in 1st class, females were more likely to survive and in the 3rd class, most men were unlikely to survive. \n",
"\n",
"
\n",
"\n",
"From the above plot you can see that in 1st class, females were more likely to survive and in the 3rd class, most men were unlikely to survive. \n",
"\n",
"replace Pclass with Person.
\n", "\n", "train_data['Person'] = train_data['Age'].apply(person_type)
\n",
"