{
"cells": [
{
"cell_type": "markdown",
"metadata": {},
"source": [
"
\n",
"
Frogtown/Saint Paul Traffic Stop Report; 04/07/18
\n",
"
By Frogtown Crusader (Abu Nayeem)
\n"
]
},
{
"cell_type": "markdown",
"metadata": {},
"source": [
"## Table of contents\n",
"* [Introduction](#introduction)\n",
"* [Data](#data)\n",
"* [Methodology](#methodology)\n",
"* [Analysis](#analysis)\n",
" * [Standard](#standard)\n",
" * [Longitudinal](#longitudinal)\n",
" * [Commerical](#commerical)\n",
" * [Geo-Spatial Prep](#geo_prep)\n",
" * [Frogtown_Geo-Spatial](#fg_geo)\n",
" * [Saint Paul Geo-Spatial](#sp_geo)\n",
"* [Conclusion](#conclusion)"
]
},
{
"cell_type": "markdown",
"metadata": {},
"source": [
"## Introduction "
]
},
{
"cell_type": "markdown",
"metadata": {},
"source": [
"**Disclaimer:** This is my Coursera Capstone Project for Data Science. Also, I will be using the term \"Black\" instead of African American because that is the race indicator provided from the dataset and the category also includes persons of African origin (substantial minority). \n",
"\n",
"### About Me:\n",
"I'm a Frogtown resident, community advocate, programmer. I will like to use open-source data to be share stories and create action. Please follow me on [Github](https://github.com/sustainabu) \n",
"\n",
"### Purpose:\n",
"\n",
"Currently in the United States, there is alot of tension between law enforcement, and the public. I will be looking into the Traffic Stop Data for Saint Paul, Minnesota (USA) provided by the Saint Paul Police Department (SPPD). Analyzing the traffic stop data can provide evidence (or lack thereof) of systemic biases. The goal of my report to add insight on what is happening in my community, Thomas-Dale neighborhood aka Frogtown, as well as advocate citizens to use open source data and/or demand their public agencies to provide such data. \n",
" \n",
"### Executive Summary:\n",
"\n",
"There are certain parts of Frogtown that have greater frequency of traffic stops compared to rest of the neighborhood, particularly along University University Avenue.The data **suggests** targeting of Black drivers given that they are stopped more frequently, searched more frequently per stop, and less likelihood to receive a citation. Some other data insights include that moving violation stops are given mostly in the morning and have a higher citation rate. In contrast, during the late night hours, there are greater instances of equipment violations. Furthermore, there seems to be many communities, including Frogtown that have considerable instances of equipment violations.\n",
" \n",
"\n",
"### Why prove the obvious?\n",
"\n",
"The results may be obvious, but proving it may be more challenging. As a researcher, my goal is to measure the impact, seek the truth, explore, and challenge my expectations. Data can be the great equalizer challenging our worldviews and/or reinforcing our existing perspective. Data reports can be used to share stories and information effectively. Furthermore, data is used as an evaluation tool to determine the effectiveness of programs and policies.\n",
"\n",
"Thus data practitioners, more broadly institutions, hold strong responsibility and influence in shaping the data in support a certain narrative. In our current political climate, the public perception on law enforcement is polarized and I hope these studies can shed light on the issues. This report and other will be available via open source, allowing others to contribute, replicate, use code for their own respective neighborhood.\n",
" "
]
},
{
"cell_type": "markdown",
"metadata": {},
"source": [
"## About Saint Paul\n",
"\n",
"The City of Saint Paul is the second largest city in Minnesota, USA, and is the capital city for the state. Saint Paul is often paired with their nearby city, Minneapolis, where they are aptly named, The Twin Cities. It has roughly over 300,000 people and the city itself is quite diverse. Minnesota has a high level of [racial inequity](http://www.citypages.com/news/minnesota-still-has-some-of-the-worst-racial-disparities-in-the-nation/504390741) ranking 47th of 51st compared to rest of the United States. Saint Paul is broken down to seventeen Planning Districts, created in 1979 to allow neighborhoods to participate in governance and use Community Development Block Grants. The Thomas/Dale neighborhood is one of the district planning councils. A few years ago, a tragic police shooting occurred during a traffic stop in the suburbs of Saint Paul, Falcon Heights, which has increased tension within the community between law enforcement and citizens. \n",
"\n",
"\n",
"## About Thomas-Dale-Frogtown Neighborhood\n",
"\n",
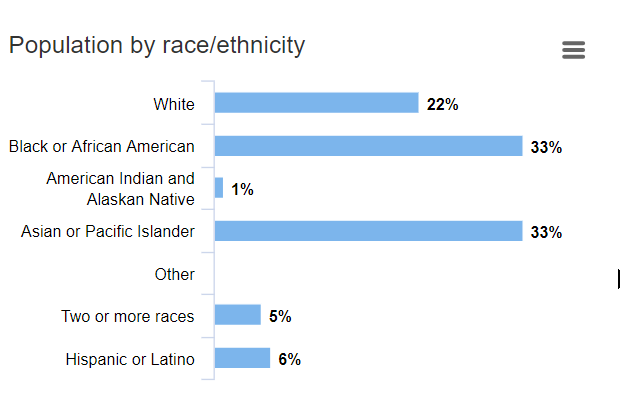
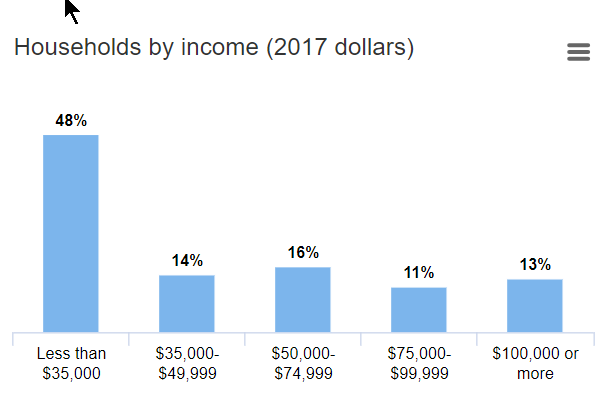
"The Frogtown community has historically been a transitional community with new immigrant/refugee communities living in the neighborhood for short period of time. From my experience, Frogtown boasts considerable diversity respect to language, culture, and ethnicity. In recent times, it has been historically poor. Here is a snapshot of the community exported from [Minnesota Compass](https://www.mncompass.org/profiles/neighborhoods/st-paul/frogtown-thomas-dale) based on 2017 Census Demographic Data.\n",
"\n",
"\n",
"\n",
"\n",
"\n",
"\n",
"### Frogtown Community Information\n",
"\n",
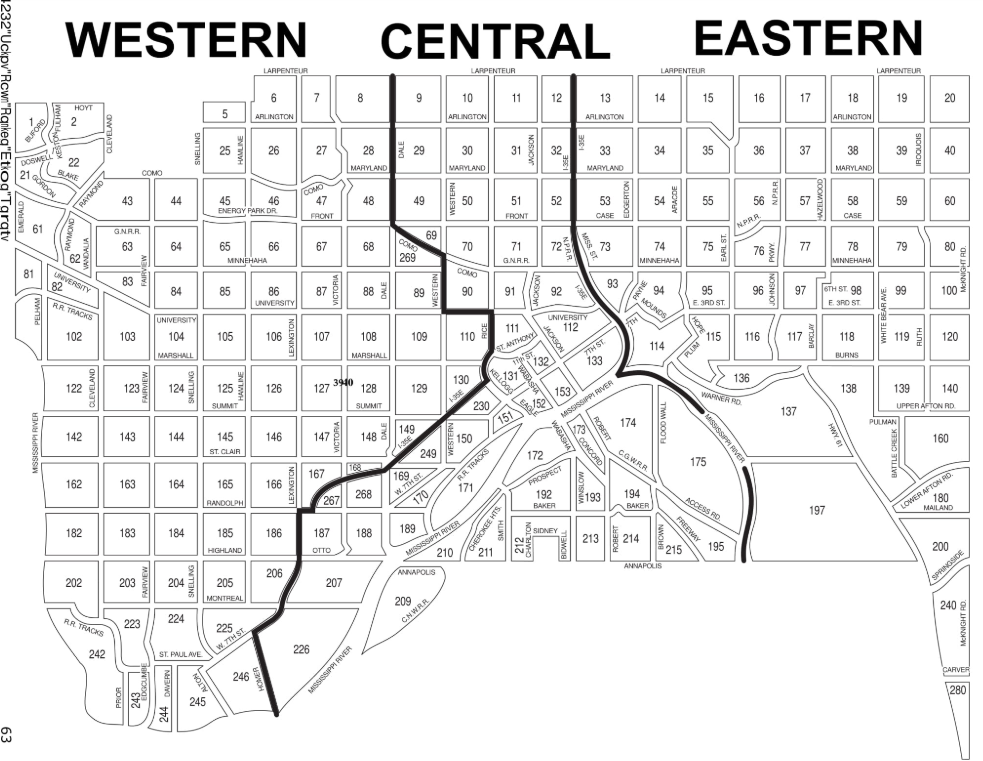
"The image below displays the Frogtown Community using the police grid (matches well with actual boundaries). On the southern boundary of Frogtown is University Avenue, where the Light Rail Transportation runs along the boundary and it is a heavy residential street as well. I will emphasize more noticeable landmarks once plugging in the 4-square data. The two rightmost sectors are respectfully Mt. Airy and Capitol Heights. These two communities are considered distinct by community members. \n",
"\n",
"\n",
"\n"
]
},
{
"cell_type": "markdown",
"metadata": {},
"source": [
" \n",
"### About the Datasets: \n",
"\n",
"The dataset contains SPPD traffic stop collected by SSPD from 2000 to 2018 via agreement of the Saint Paul chapter of the NAACP and can be accessed [here](https://information.stpaul.gov/Public-Safety/Traffic-Stop-Dataset/kkd6-vvns). The website have a lot of features and visualizations for basic analysis, but for advanced users data transformations are not available/ limited. I have chosen to select years from 2017 to 2018 based on data limitations.\n",
"\n",
"Data Features:\n",
"* Individual Traffic Stop Data\n",
"* Driver characteristics\n",
" - Gender, Age (if recieve citation), and Race \n",
" - Was the driver searched, vehicle searched, and/or recieve a citation?\n",
"* GeoCoordinates of center of police grid and timestamp for\n",
"\n",
"Data limitation as explain on the website:\n",
"* Reason for stop (available starting in 2017)\n",
" - Include Moving Violation, Equipment Violation, Investigative Stop, and 911 call\n",
"* Data reflects traffic stops originating by St. Paul Police Officers\n",
"* Race is based on officers’ perceptions\n",
"* Fields indicating “No Data” may be due to a variety of factors, including:\n",
" - Age data is only collected when a citation is issued\n",
" - Reason for stop data was not collected before 2017\n",
" - Technology changes over time/ Technical Errors/ Lack of Available information\n",
"\n",
"* Supplemental Info Suggested by Author\n",
" - [Traffic Crashes by Police Grid 2018](https://www.stpaul.gov/sites/default/files/Media%20Root/Police/Traffic%20Crashes%20in%20Saint%20Paul%202018.pdf)\n",
" - [Traffic Stops by Police Grid 2018](https://www.stpaul.gov/sites/default/files/Media%20Root/Police/2018%20Traffic%20Stops.pdf)\n",
" - [911 Calls by Police Grid 2018](https://www.stpaul.gov/sites/default/files/Media%20Root/Police/911%20Calls%20in%20Saint%20Paul%202018.pdf)\n",
"\n",
"The dataset consist of each traffic stop record, but the locations coordinates are limited to the police grid coordinates. There is maybe over 200 or so police grids! \n",
"\n",
"\n",
"\n",
"#### Four-Square API Dataset\n",
"\n",
"I'll be using the Four-square API to get information on local businesesses. Some street/ and areas might be more active than others\n",
"\n",
"#### Minnesota Compass 2017 Census Survey Data\n",
"\n",
"The Minnesota Compass offers raw data for both Minneapolis and Saint Paul districts. They are a non-partisan group."
]
},
{
"cell_type": "markdown",
"metadata": {},
"source": [
"### Data Prep\n",
"\n",
"The primary data will range from 2017-18. The longitudinal analysis will have data from 2001 to 2018."
]
},
{
"cell_type": "markdown",
"metadata": {},
"source": [
"## Data Cleaning/Wrangling\n",
"\n",
"I will be constructing several variables. Originally, I wanted to extract gridlocation coordinates from the dataset, but it makes more sense to connect the grid to a json file. The manipulations and additions are listed below:\n",
"\n",
"1. Convert time variable to datetime; Extract Month, DayofWeek, Weekend, Hour\n",
"2. I've constructed a variable **LateNight** which denotes if a stop occured between 10:00PM to 5:00AM\n",
"3. Converted several variables to integers; Note: Female is designated as 1 \n",
"4. Converted some descriptive columns to dummy variables\n",
"5. Extracted Latitude and Longitude in separate columns for each police grid\n",
"\n",
"\n",
"**Initial Omissions**\n",
"\n",
"* The demographic 'Native American' was excluded because the numbers were too small.\n",
"* There are empty cells under the 'No Data' Category\n",
"* The two reasons, '911 call', and 'Investigative Stop' were excluded because they were small numbers and not relevant to study; See below \n",
"* Finally, any data entries not belonging to a community were excluded. It's possible that some stops occurred outside Saint Paul jursidiction. These data points were excluded\n",
"* Driver being search and vehicle being searched is strongly correlated, so exclude vehicle search in analysis\n"
]
},
{
"cell_type": "code",
"execution_count": 7,
"metadata": {},
"outputs": [
{
"data": {
"text/plain": [
"Moving Violation 48859\n",
"Equipment Violation 12362\n",
"Investigative Stop 2245\n",
"No Data 139\n",
"911 Call / Citizen Reported 138\n",
"Name: Reason, dtype: int64"
]
},
"execution_count": 7,
"metadata": {},
"output_type": "execute_result"
}
],
"source": [
"df.Reason.value_counts()"
]
},
{
"cell_type": "markdown",
"metadata": {
"hide_input": true
},
"source": [
"## Data Methodology "
]
},
{
"cell_type": "markdown",
"metadata": {},
"source": [
"I'll be exploring the dataset through multiple angles: longitudinal, geo-spatial, and in-depth analysis from 2017-18. I will be focusing primarily on racial discrimination. I will be mostly be using data visualization, a predictive model would be inappropiate as the data is mostly binary.\n",
"\n",
"#### Standard Analysis\n",
"\n",
"There are several methods/considerations/limitations in testing for racial biases; : \n",
"1. At the first layer (shallow level), are certain drivers being selected more than others? There can be many explainations for discrepancies that may not be discrimination\n",
"2. At the second layer, are 'certain' drivers being treated differently. For example, do women drivers get less citations?\n",
"3. Are certain racial groups treatment stand out compared to their peers?\n",
"4. Are there external factors, such as venues, local bars, and congested traffic areas that may influence outcome?\n",
"5. Racial idenitification is imperfect given that this is determined by officers and certain persons are mixed heritage\n",
"\n",
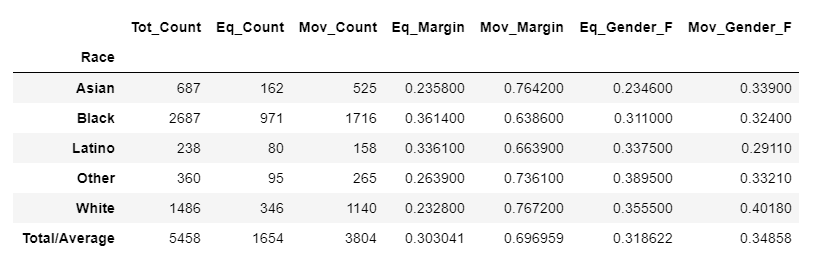
"The primary analysis will focus on the second later, I'll be create a **master table** that collects the groupby values; conditioned on race.\n",
"\n",
"My analysis will be focusing primarily on treatment:\n",
"\n",
"* **'Eq'** stands for Equipment Violation; and **'Mov'** indicates Moving Violation\n",
"\n",
"* Most of the values are normalized from [0 to 1] and conditioned on Racial identity; Examples provided below\n",
"\n",
"How to read results:\n",
"\n",
"* Eq_Margin of the Asian group indicates the percentage 'Equipment Violation' respect to all stops conditioned on being asian. So a value 0.24 would indicate that 24% of stops for Asians were for Equipment Violations.\n",
"\n",
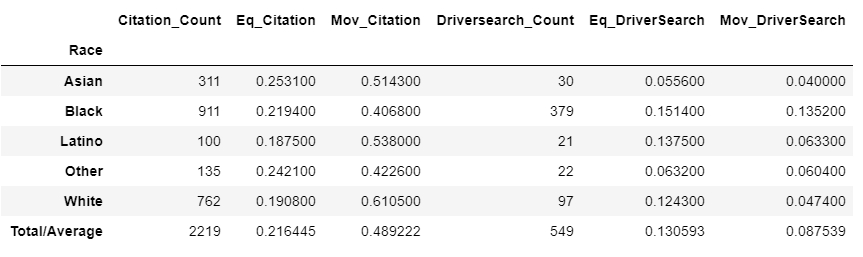
"* Eq_Citation of 0.4 for Asian drivers indicates that 40% of Asian driver recieved a citation for equipment violations conditioned on being asian.\n",
"\n",
"* Mov_DriverSearch of 0.15 for Asians indicates that 15% of Asian drivers were searched during a Moving Violation conditioned on being Asian\n",
"\n",
"* Mov_Gender_F of 0.55 for Asians indicates that 55% of Asian women are stopped for Moving Violations conditioned on being women.\n",
"\n",
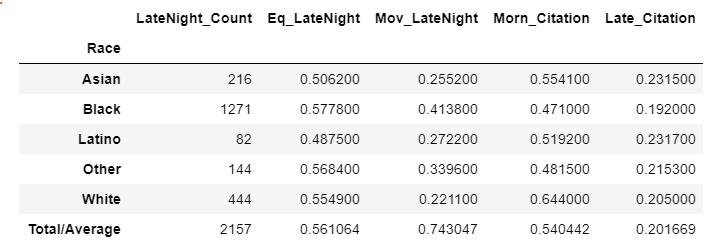
"* Eq_LateNight of 0.25 for Asians indicate that 25% of Asian drivers are stopped for Equipment Violation during latenight conditioned on being Asian\n",
"\n",
"* Morn_Citation of 0.2 for Asians indicate that 20% of Asian drivers recieved during the daytime conditioned of being Asian\n",
"\n",
"#### Longitudinal Analysis\n",
"\n",
"Are there any trends throughout the years?\n",
"\n",
"#### Commercial Analysis\n",
"\n",
"Does the number of stores and type of stores influence the neighborhood? We'll see this visually.\n",
"\n",
"#### Geo-Spatial Analysis\n",
"\n",
"How does Frogtown compare to their neighbors?\n",
"\n"
]
},
{
"cell_type": "markdown",
"metadata": {},
"source": [
"## Analysis \n",
"\n",
"### Standard Analysis \n",
"My strategy below is to create to save the group by values into a single table; the sort index allows the data to be formated in a way to view patterns"
]
},
{
"cell_type": "markdown",
"metadata": {},
"source": [
""
]
},
{
"cell_type": "markdown",
"metadata": {},
"source": [
""
]
},
{
"cell_type": "markdown",
"metadata": {},
"source": [
""
]
},
{
"cell_type": "markdown",
"metadata": {},
"source": [
"### Plotting \n",
"\n",
"We will be taking the results from previous section and graphing it"
]
},
{
"cell_type": "markdown",
"metadata": {
"hide_input": false,
"scrolled": false
},
"source": [
""
]
},
{
"cell_type": "markdown",
"metadata": {
"hide_input": false
},
"source": [
""
]
},
{
"cell_type": "markdown",
"metadata": {
"hide_input": false
},
"source": [
""
]
},
{
"cell_type": "markdown",
"metadata": {
"hide_input": true
},
"source": [
""
]
},
{
"cell_type": "markdown",
"metadata": {
"hide_input": false
},
"source": [
""
]
},
{
"cell_type": "markdown",
"metadata": {},
"source": [
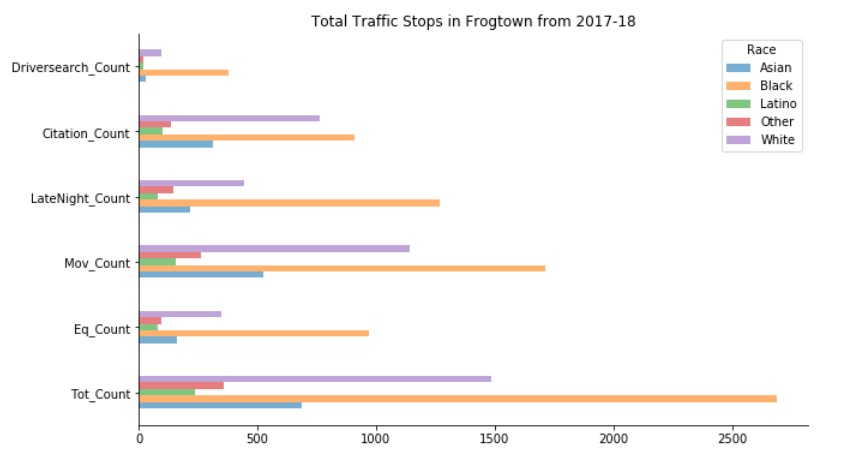
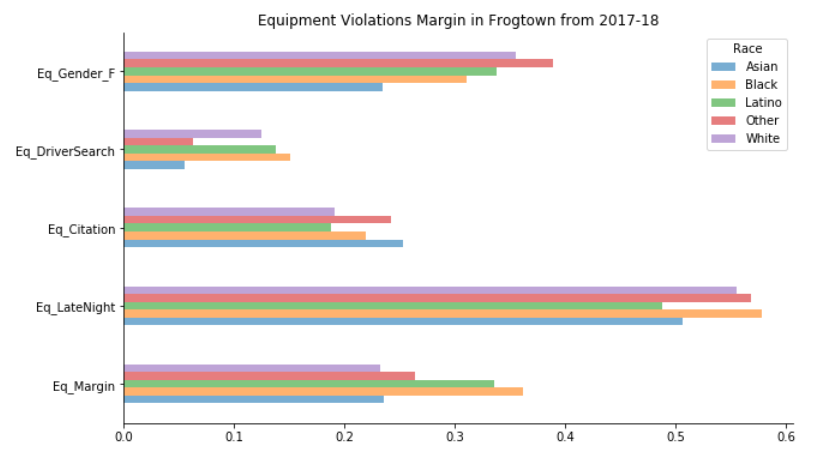
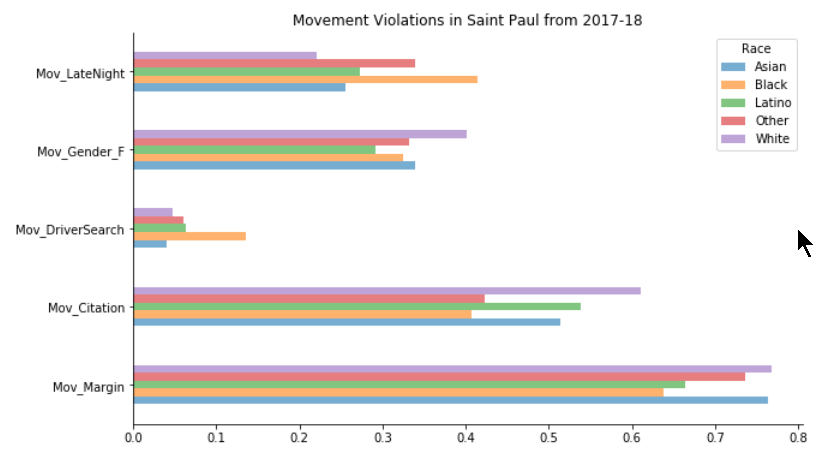
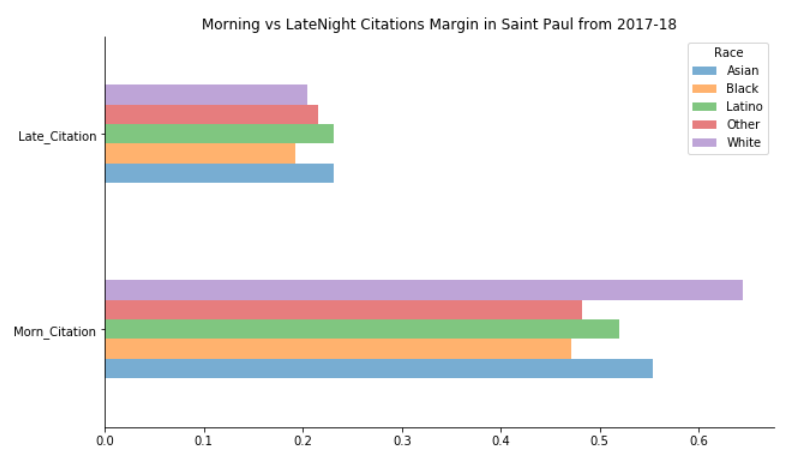
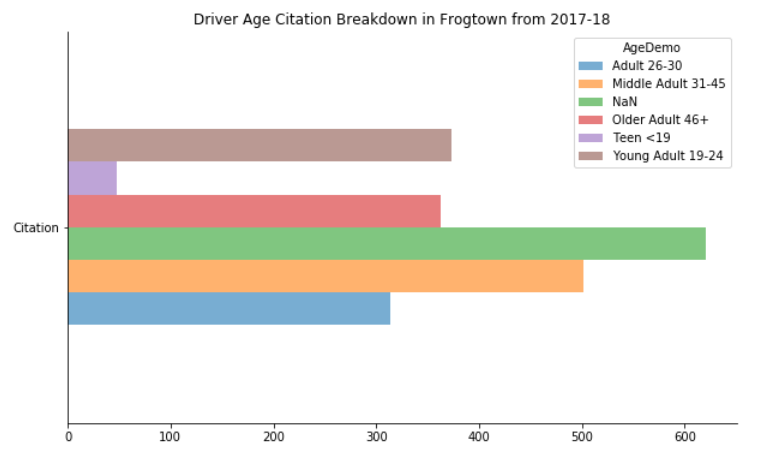
"**Insights**\n",
"\n",
"Recall in Frogtown the racial distribution is 1/3 Black, 1/3 Asian, and 1/5 white. With that said there is greater proportion of both Black and White drivers being stopped.\n",
"\n",
"* Black drivers were stopped the most and by proportion have greater likelihood of being stopped for equipment violation ( \n",
"* Asian drivers were stopped less respect to their proportional population\n",
"* Black drivers were less likely to recieve citations despite being pulled over frequently\n",
"* White drivers were more likely to recieve a citation for moving violations compared to other groups\n",
"* Black drivers are searched much often than their peers despite low citations count\n",
"* Female drivers via proportion are less likely to be stopped; though white females have the highest proportion\n",
"* There are considerably more Equipment violations during latenight than in the morning and less Moving Violations\n",
"* The citation rates are much higher during the daytime vs the nighttime. This makes sense because there is less drivers during late night. Though 1/3 of stops occur during latenight.\n",
"* For the age distribution, nearly 1/3 of citations don't have the driver's age. Based on the available data, middle aged adults are most likely to get citations.\n"
]
},
{
"cell_type": "markdown",
"metadata": {},
"source": [
"### Time Based Analysis\n",
"\n",
"I will be checking out patterns for month, day of the week, and time of hour."
]
},
{
"cell_type": "markdown",
"metadata": {
"hide_input": false
},
"source": [
""
]
},
{
"cell_type": "markdown",
"metadata": {
"hide_input": false
},
"source": [
""
]
},
{
"cell_type": "markdown",
"metadata": {},
"source": [
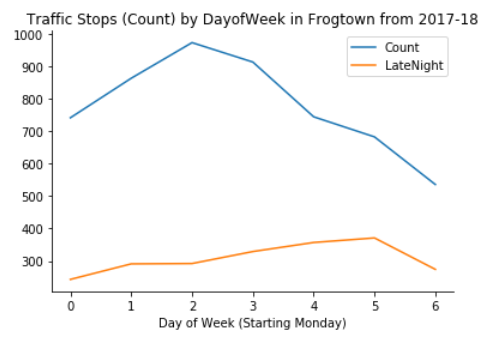
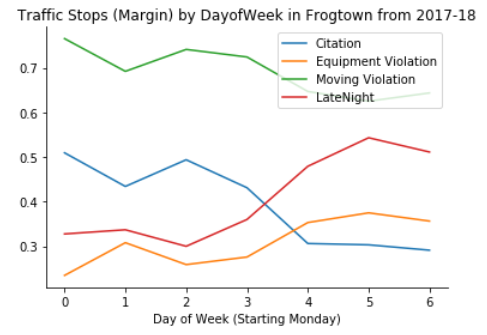
"* The traffic stops are most frequent on Tuesday and less on the weekend\n",
"* Late Night traffic stops increases on the weekend days includes Friday (makes sense)\n",
"* There seems to be strong correlation between moving violation and number of citations\n",
"* There seems to be strong correlation between equipment violation and latenight traffic stops\n",
"* Less citations by proportion is less during the weekend"
]
},
{
"cell_type": "markdown",
"metadata": {
"hide_input": false
},
"source": [
""
]
},
{
"cell_type": "markdown",
"metadata": {
"hide_input": false
},
"source": [
""
]
},
{
"cell_type": "markdown",
"metadata": {},
"source": [
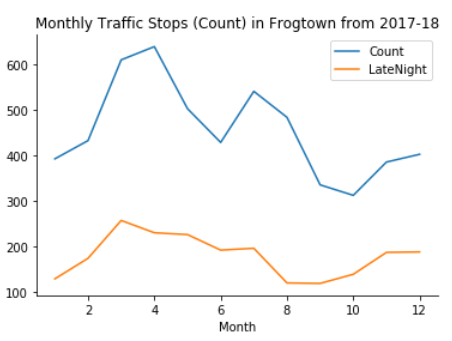
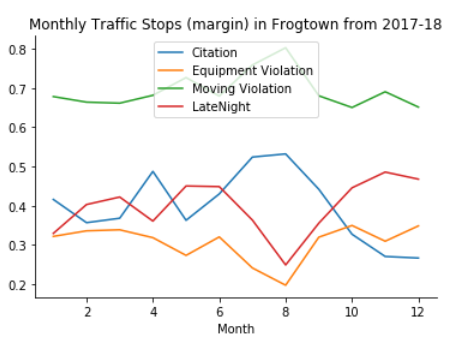
"* There is less traffic stops during the winter months, and steadily more on Spring and Fall\n",
"* There is a significant drop on Equipment and Latenight traffic stops during the summer month\n",
"* There is an increase proportion of moving violations and citations during the summer months\n",
"* Less citiations are given Late Fall and early Winter"
]
},
{
"cell_type": "markdown",
"metadata": {
"hide_input": false
},
"source": [
""
]
},
{
"cell_type": "markdown",
"metadata": {
"hide_input": false
},
"source": [
""
]
},
{
"cell_type": "markdown",
"metadata": {},
"source": [
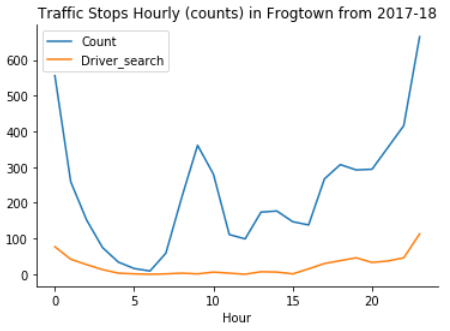
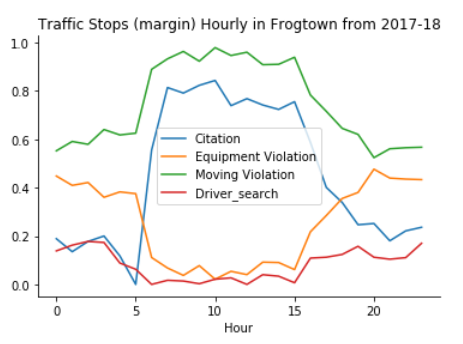
"* There are signficiant more traffic stops during the night hours\n",
"* Moving violations during the day, Equipment violations during the night\n",
"* Very high frequency of citations during the daytime hour matched with moving violations"
]
},
{
"cell_type": "markdown",
"metadata": {},
"source": [
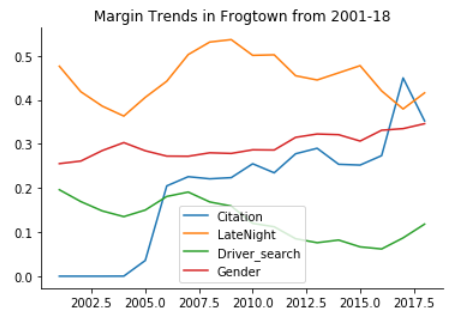
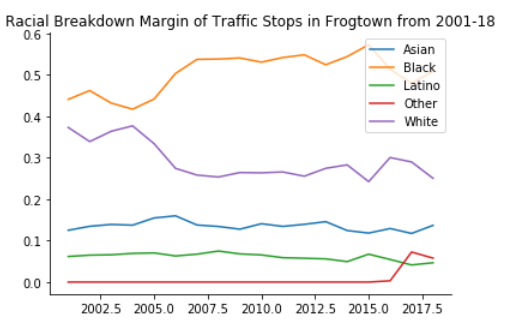
"## Longitudinal Analysis of Frogtown \n",
"\n",
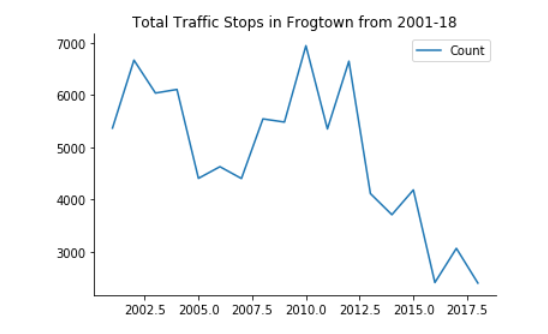
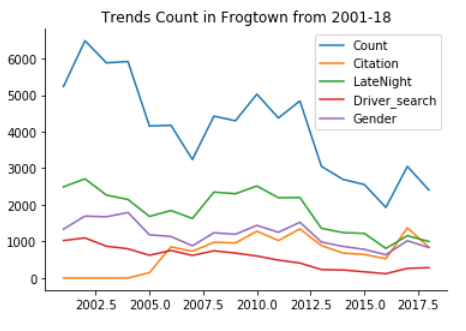
"The full dataset ranges from 2001 to 2018 and has many missing components. For some years, 50% of the data collected are missing key information. The 'total count' will includes all instances of traffic stops in Frogtown even if there is missing supplmental information. "
]
},
{
"cell_type": "markdown",
"metadata": {
"hide_input": false
},
"source": [
"\n"
]
},
{
"cell_type": "markdown",
"metadata": {
"hide_input": false
},
"source": [
""
]
},
{
"cell_type": "markdown",
"metadata": {
"hide_input": false,
"scrolled": true
},
"source": [
""
]
},
{
"cell_type": "markdown",
"metadata": {
"hide_input": false
},
"source": [
""
]
},
{
"cell_type": "markdown",
"metadata": {},
"source": [
"**Preliminary Longitudinal Analysis:**\n",
"\n",
"* There was plenty of past data that indicate a traffic, but there was no information given.Thus the graphs presented are missing many datapoints and can provide a skewed a picture\n",
"* At around 2004 to 2005, a change of data practice/collections probably occured\n",
"* The Citation rate has increased in the last couple of years\n",
"* The racial demogrpahic of traffic stops have been steady with Black drivers being overrepresentated despite some demographic shift in the neighborhood\n",
"* Driver search rate has declined over time"
]
},
{
"cell_type": "markdown",
"metadata": {},
"source": [
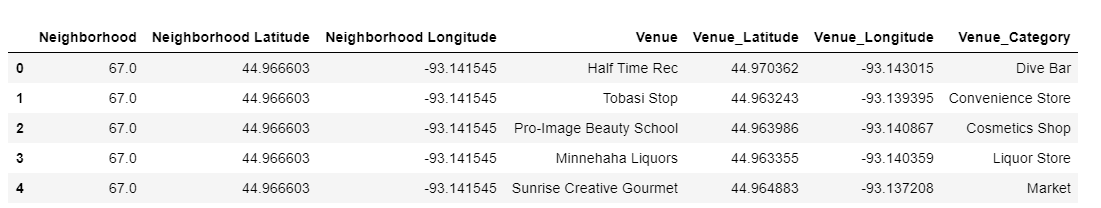
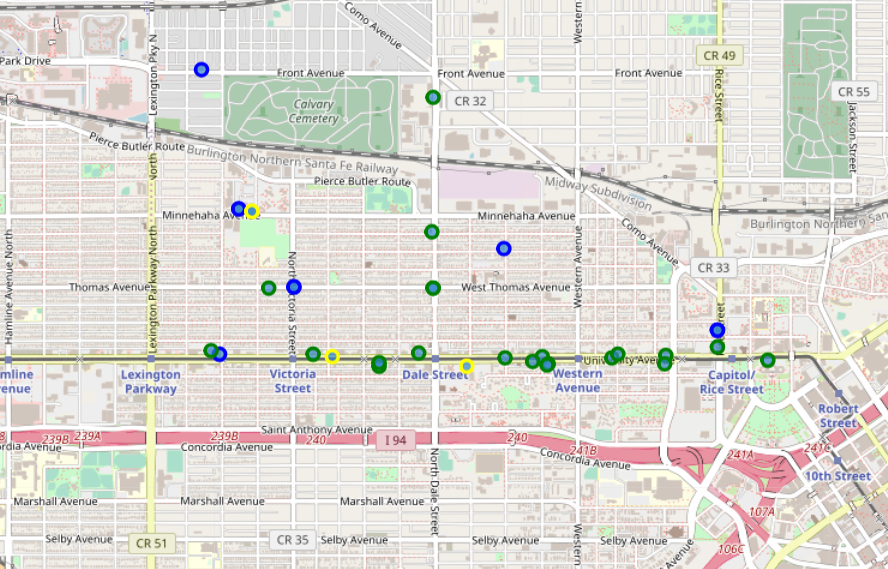
"## Commercial Insight/Analysis \n",
"\n",
"I will be using the Four-Square API to get the nearby venues, within the radius of each police grid. I've separated the venue into three categories of interest.\n",
"\n",
"* Green indicates Restaurant\n",
"* Blue indicates Bars\n",
"* Yellow indicates Convenience/Corner Stores\n"
]
},
{
"cell_type": "markdown",
"metadata": {
"scrolled": true
},
"source": [
""
]
},
{
"cell_type": "markdown",
"metadata": {},
"source": [
""
]
},
{
"cell_type": "markdown",
"metadata": {},
"source": [
"The graph above shows the stores within the Frogtown area. University Avenue has concentrated traffic. There are some neighborhood bars and convenience near the residential homes, we'll see a clearer picture with geo-spatial data"
]
},
{
"cell_type": "markdown",
"metadata": {},
"source": [
"# Geo-Spatial Prep "
]
},
{
"cell_type": "markdown",
"metadata": {},
"source": [
"The Saint Paul Police department has a [json file](https://information.stpaul.gov/Public-Safety/Saint-Paul-Police-Grid-Shapefile/ykwt-ie3e) that maps out the police grid. Note the data is now either grouped by Grid or Neighborhood"
]
},
{
"cell_type": "markdown",
"metadata": {},
"source": [
"## Frogtown Geo-Spatial Data "
]
},
{
"cell_type": "markdown",
"metadata": {
"hide_input": true
},
"source": [
"### Total Traffic Incidents in Frogtown by Grid (W/ Venue marks)"
]
},
{
"cell_type": "markdown",
"metadata": {
"hide_input": false,
"scrolled": false
},
"source": [
""
]
},
{
"cell_type": "markdown",
"metadata": {},
"source": [
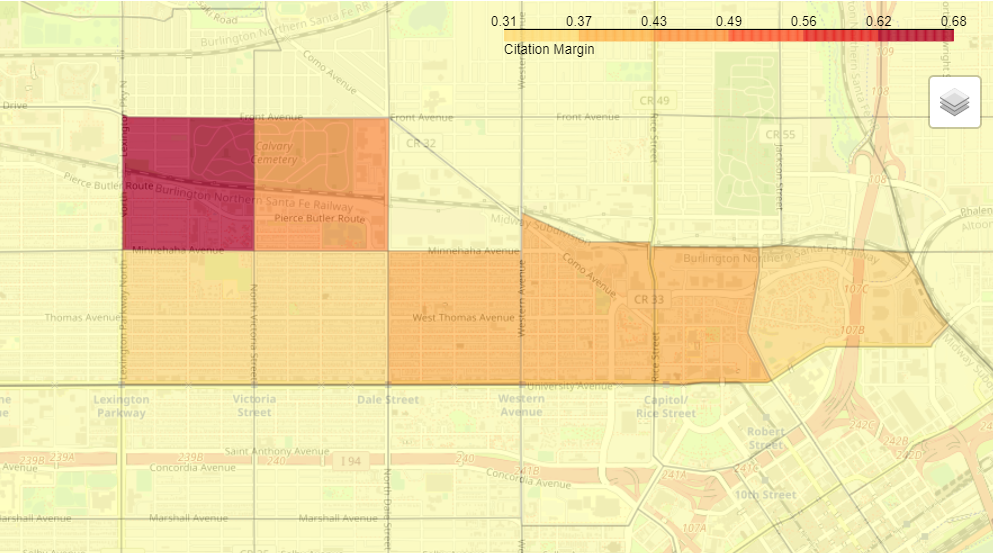
"### Citation Margin in Frogtown by Grid"
]
},
{
"cell_type": "markdown",
"metadata": {
"hide_input": false
},
"source": [
""
]
},
{
"cell_type": "markdown",
"metadata": {},
"source": [
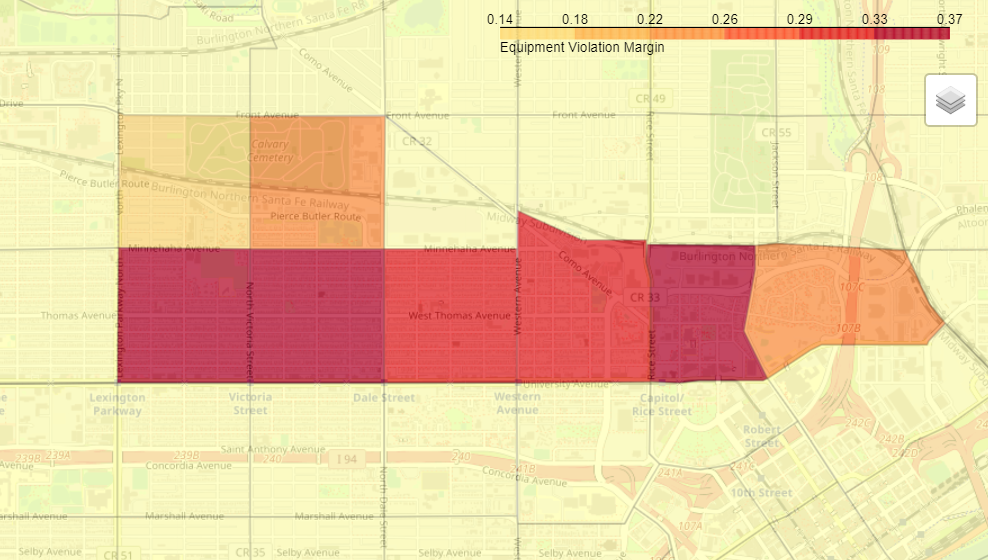
"### Equipment Violation Margin in Frogtown by Grid"
]
},
{
"cell_type": "markdown",
"metadata": {
"hide_input": false
},
"source": [
""
]
},
{
"cell_type": "markdown",
"metadata": {
"hide_input": false
},
"source": [
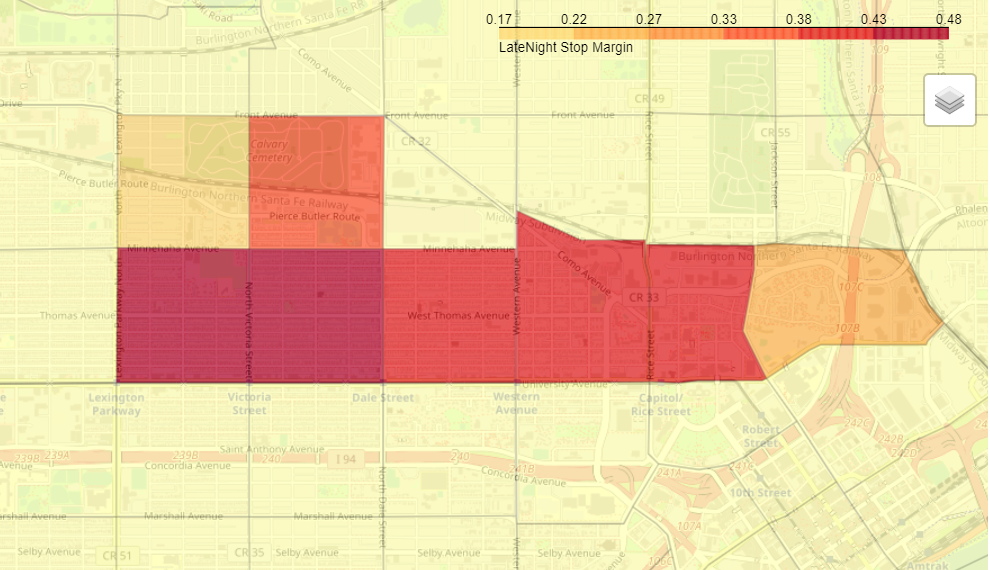
"### LateNight Traffic Stop Margin in Frogtown by Grid"
]
},
{
"cell_type": "markdown",
"metadata": {
"hide_input": false
},
"source": [
""
]
},
{
"cell_type": "markdown",
"metadata": {
"hide_input": true
},
"source": [
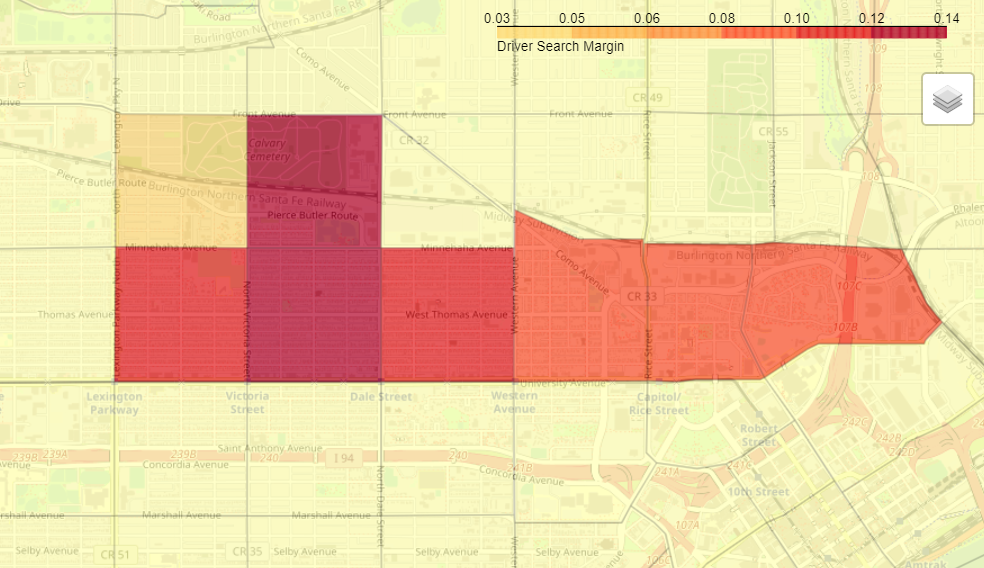
"### Driver Searched Margin In Frogtown by Grid"
]
},
{
"cell_type": "markdown",
"metadata": {
"hide_input": true
},
"source": [
""
]
},
{
"cell_type": "markdown",
"metadata": {},
"source": [
"### Frogtown Summary Stats\n",
"\n",
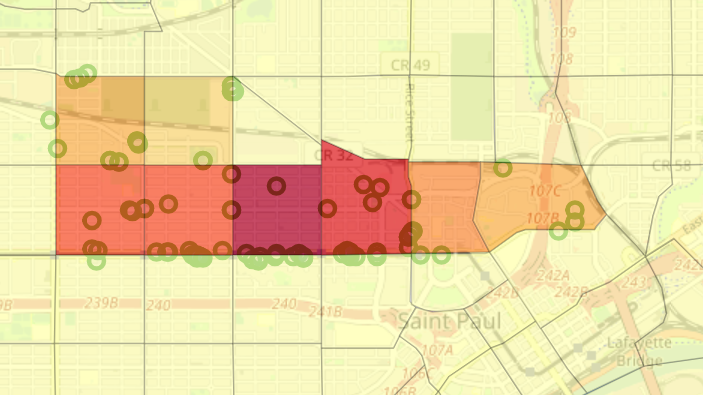
"* For total incidents, high volume of incidents are around University ave around Dale\n",
"* The citation margin is not too high even in the spaces where there is greater frequency of stops\n",
"* The Equipment Violation density is high and located in the same high density rate\n",
"* The LateNight Stop Margin is really high in the University area and the vehicle search rate is also high\n"
]
},
{
"cell_type": "markdown",
"metadata": {},
"source": [
"## Saint Paul Geospatial Data \n",
"\n",
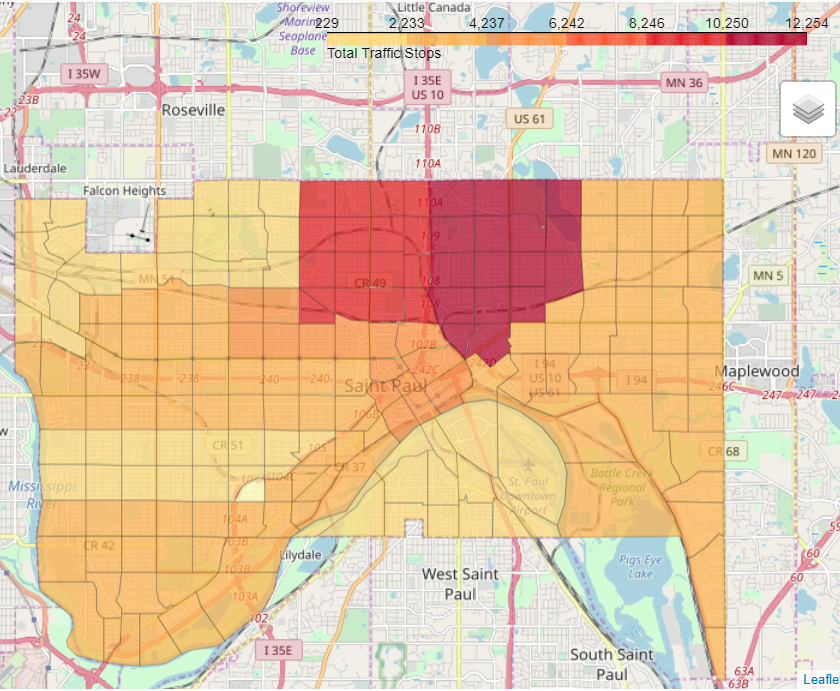
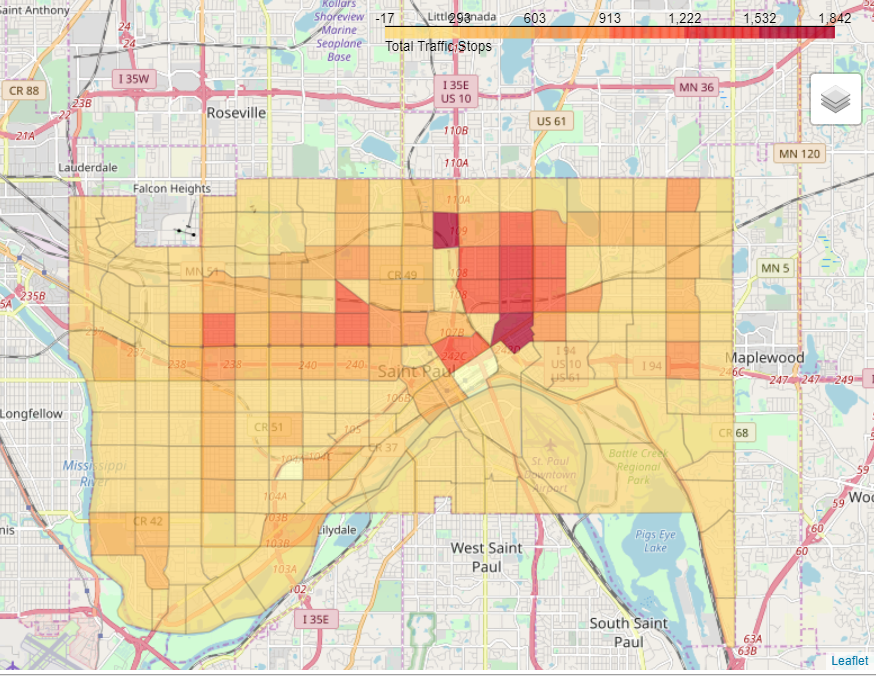
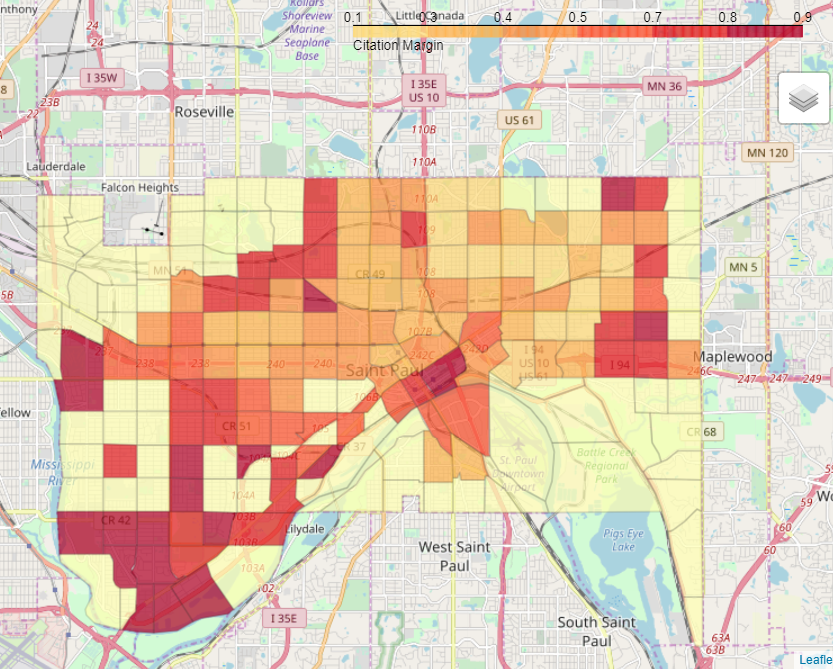
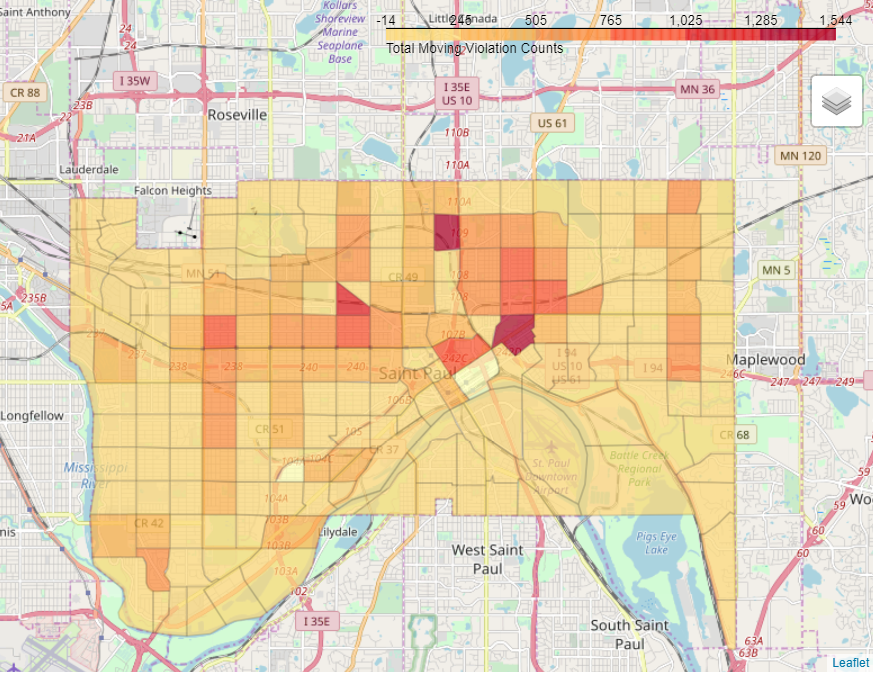
"* For margin specifications, a police grid must have more than 100 total traffic stops. A smaller number creates bigger imbalance on margins\n",
"* The downtown district was excluded when graphing total numbers under grid data because it has very high frequency of stops; influencing the legend gradient.\n",
"* The data is from 2017 to 2018.\n",
"* There is one police grid that has zero traffic stops (try to find it)"
]
},
{
"cell_type": "markdown",
"metadata": {},
"source": [
"### Total Traffic Incidents in Saint Paul by Neighborhood"
]
},
{
"cell_type": "markdown",
"metadata": {},
"source": [
""
]
},
{
"cell_type": "markdown",
"metadata": {},
"source": [
"### Total Traffic Incidents in Saint Paul by Grid"
]
},
{
"cell_type": "markdown",
"metadata": {},
"source": [
""
]
},
{
"cell_type": "markdown",
"metadata": {},
"source": [
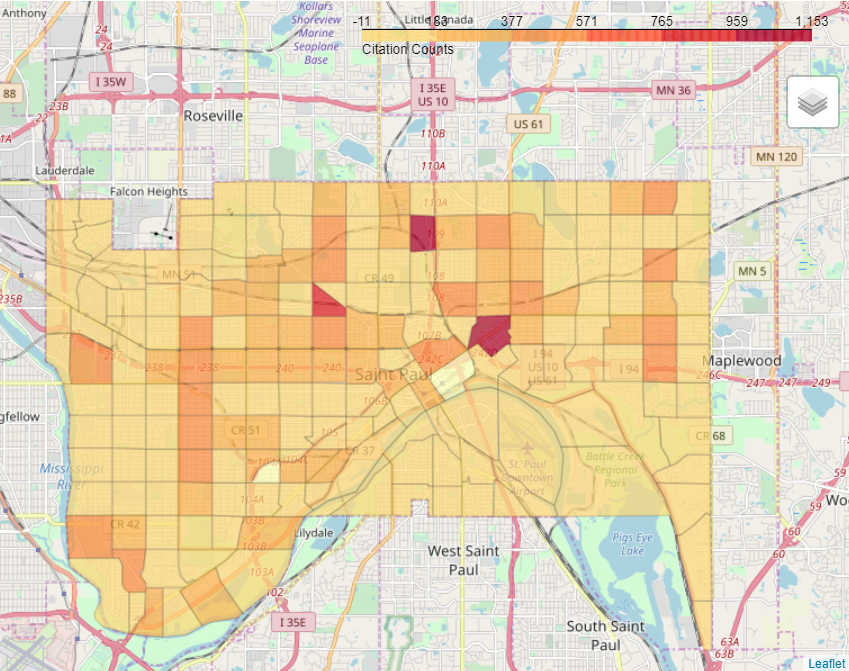
"### Total Citation Count in Saint Paul by Grid"
]
},
{
"cell_type": "markdown",
"metadata": {},
"source": [
""
]
},
{
"cell_type": "markdown",
"metadata": {
"hide_input": true
},
"source": [
"### Citation Margin in Saint Paul by Neighborhood"
]
},
{
"cell_type": "markdown",
"metadata": {},
"source": [
""
]
},
{
"cell_type": "markdown",
"metadata": {},
"source": [
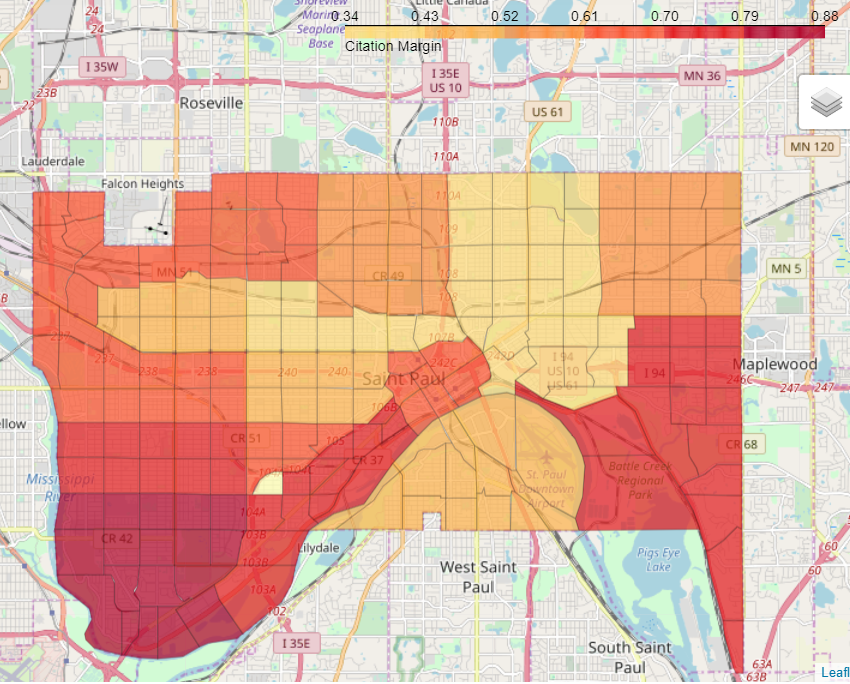
"### Citation Margin in Saint Paul by Grid"
]
},
{
"cell_type": "markdown",
"metadata": {},
"source": [
""
]
},
{
"cell_type": "markdown",
"metadata": {
"hide_input": true
},
"source": [
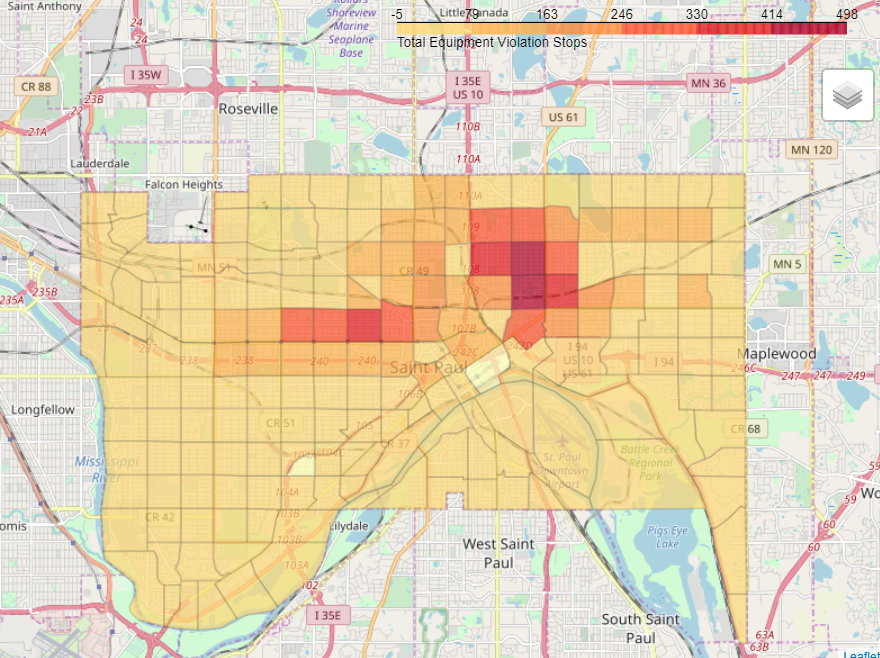
"### Equipment Violation Count in Saint Paul by Grid"
]
},
{
"cell_type": "markdown",
"metadata": {},
"source": [
""
]
},
{
"cell_type": "markdown",
"metadata": {},
"source": [
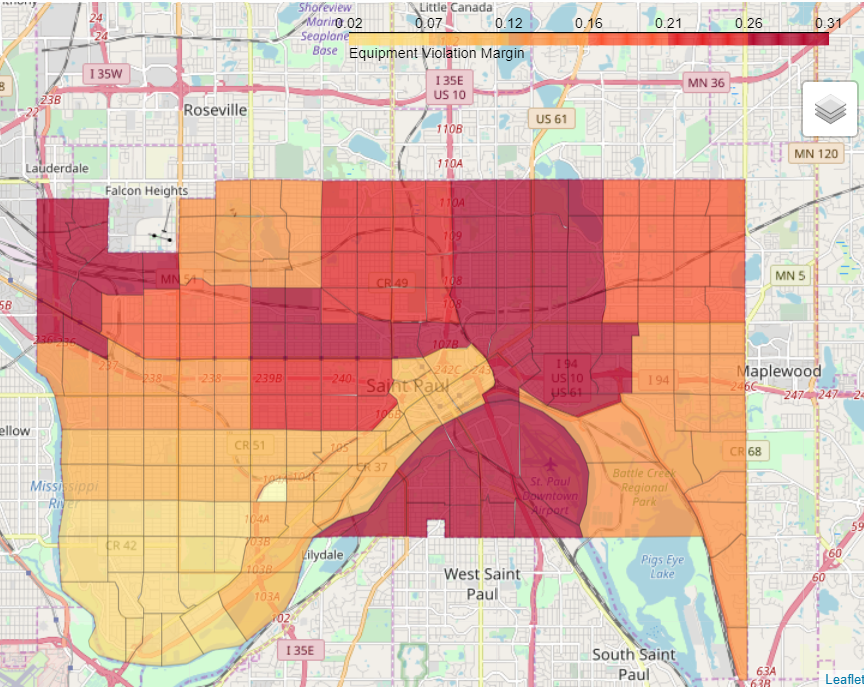
"### Equipment Violation Margin in Saint Paul by Neighborhood"
]
},
{
"cell_type": "markdown",
"metadata": {},
"source": [
""
]
},
{
"cell_type": "markdown",
"metadata": {},
"source": [
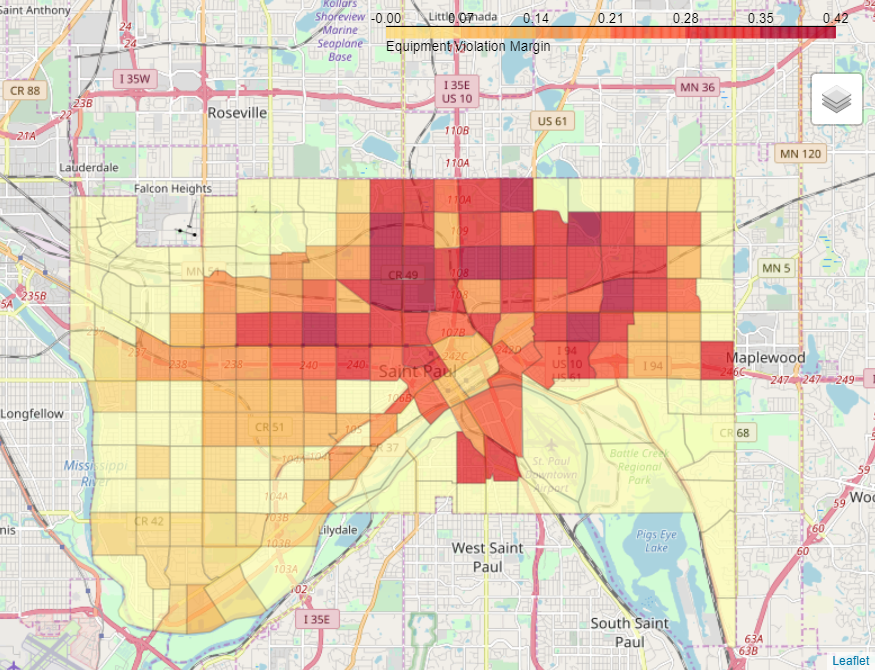
"### Equipment Violation Margin in Saint Paul by Grid"
]
},
{
"cell_type": "markdown",
"metadata": {
"hide_input": false,
"scrolled": true
},
"source": [
""
]
},
{
"cell_type": "markdown",
"metadata": {},
"source": [
"### Moving Violation Count in Saint Paul by Grid"
]
},
{
"cell_type": "markdown",
"metadata": {
"hide_input": false,
"scrolled": true
},
"source": [
""
]
},
{
"cell_type": "markdown",
"metadata": {
"hide_input": true
},
"source": [
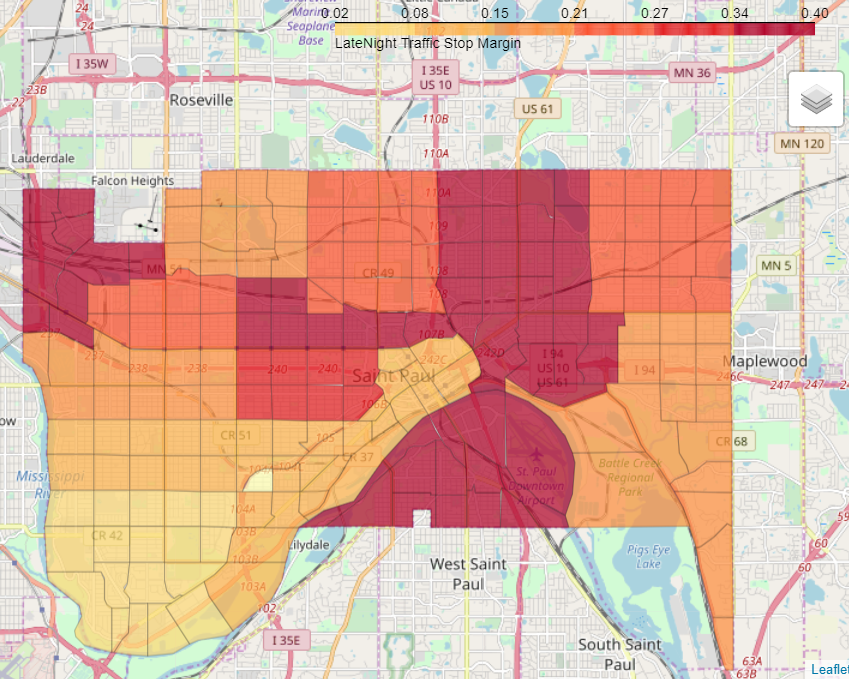
"### LateNight Traffic Stop Margin in Saint Paul by Neighborhood"
]
},
{
"cell_type": "markdown",
"metadata": {},
"source": [
""
]
},
{
"cell_type": "markdown",
"metadata": {},
"source": [
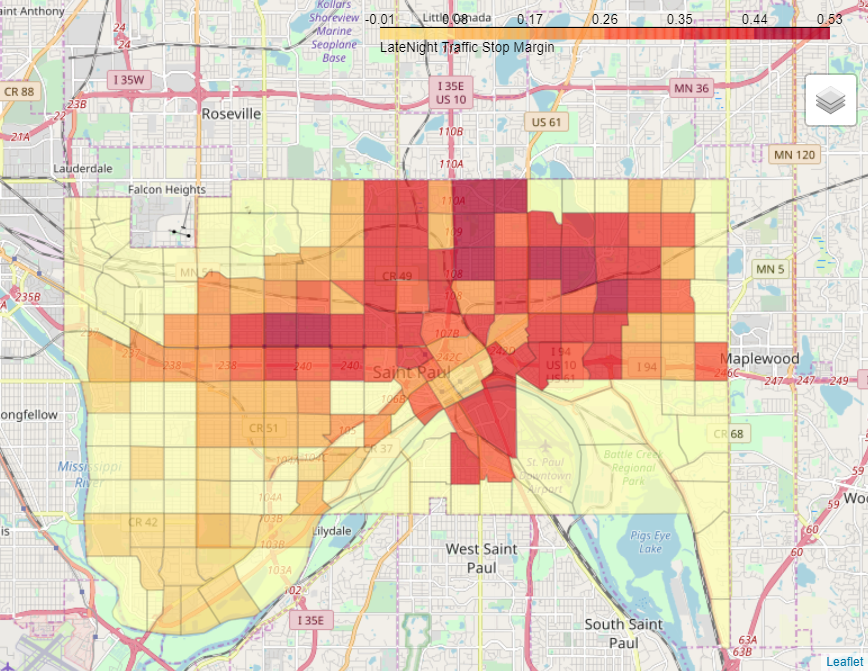
"### LateNight Traffic Stop Margin in Saint Paul by Grid"
]
},
{
"cell_type": "markdown",
"metadata": {
"hide_input": false
},
"source": [
""
]
},
{
"cell_type": "markdown",
"metadata": {},
"source": [
"### Driver Searched Margin in Saint Paul by Neighborhood"
]
},
{
"cell_type": "markdown",
"metadata": {},
"source": [
""
]
},
{
"cell_type": "markdown",
"metadata": {},
"source": [
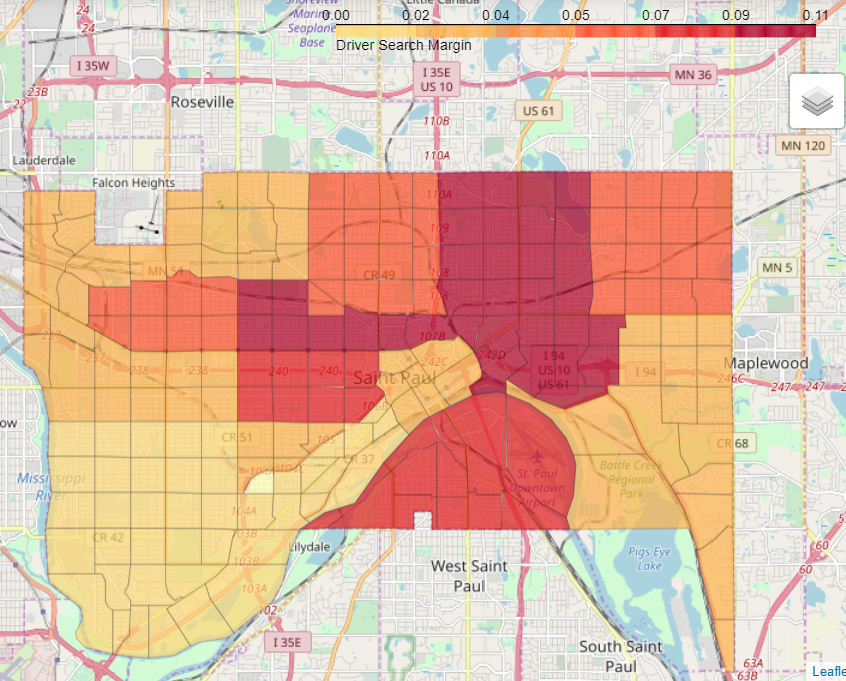
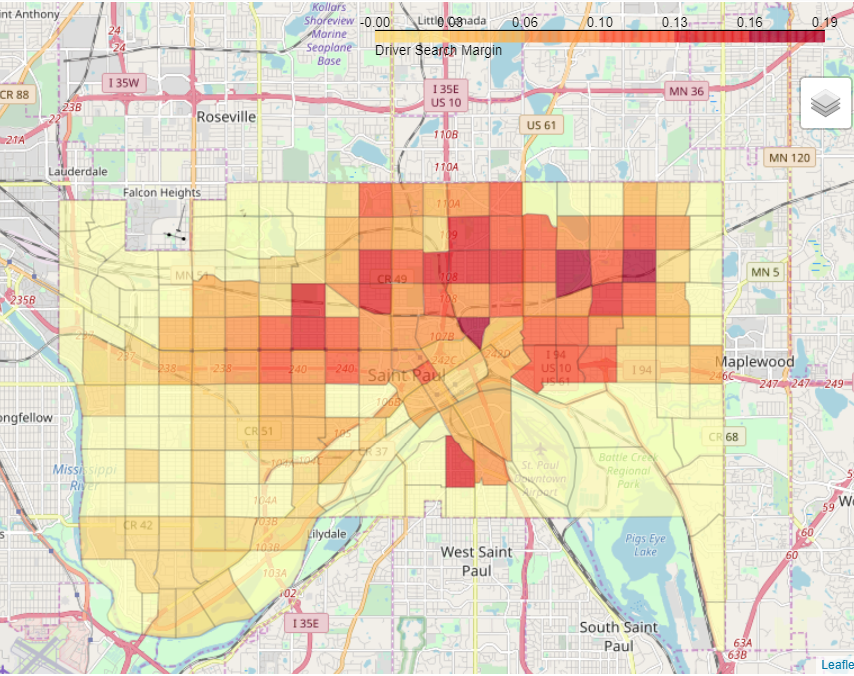
"### Driver Searched Margin in Saint Paul by Grid"
]
},
{
"cell_type": "markdown",
"metadata": {
"hide_input": false,
"scrolled": false
},
"source": [
""
]
},
{
"cell_type": "markdown",
"metadata": {},
"source": [
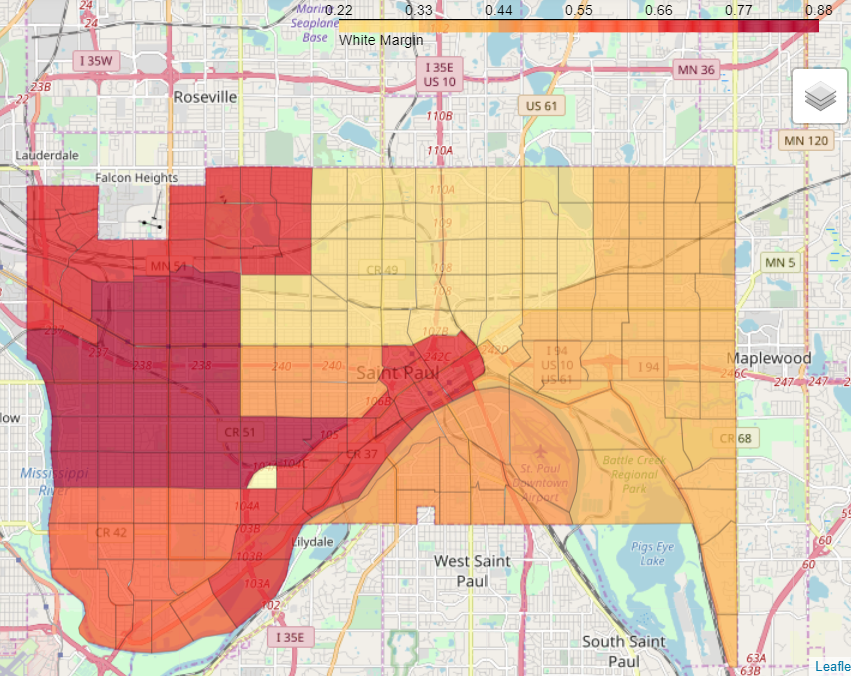
"### White proportion in Saint Paul by Neighborhood (Census)"
]
},
{
"cell_type": "markdown",
"metadata": {},
"source": [
""
]
},
{
"cell_type": "markdown",
"metadata": {},
"source": [
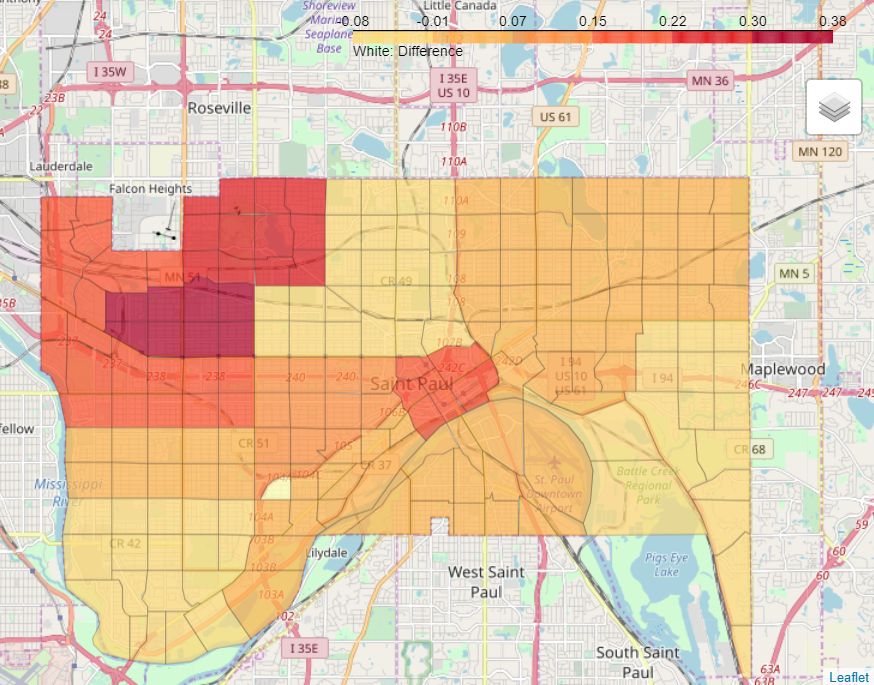
"### White Driver and Census Margin Difference in Saint Paul by Neighborhood\n",
"\n",
"I map out the difference between actual demographic distribution of whites from the margin white drivers stopped. For legend, if lighter indicates over-representation and darker indicates under-representation "
]
},
{
"cell_type": "markdown",
"metadata": {},
"source": [
""
]
},
{
"cell_type": "markdown",
"metadata": {},
"source": [
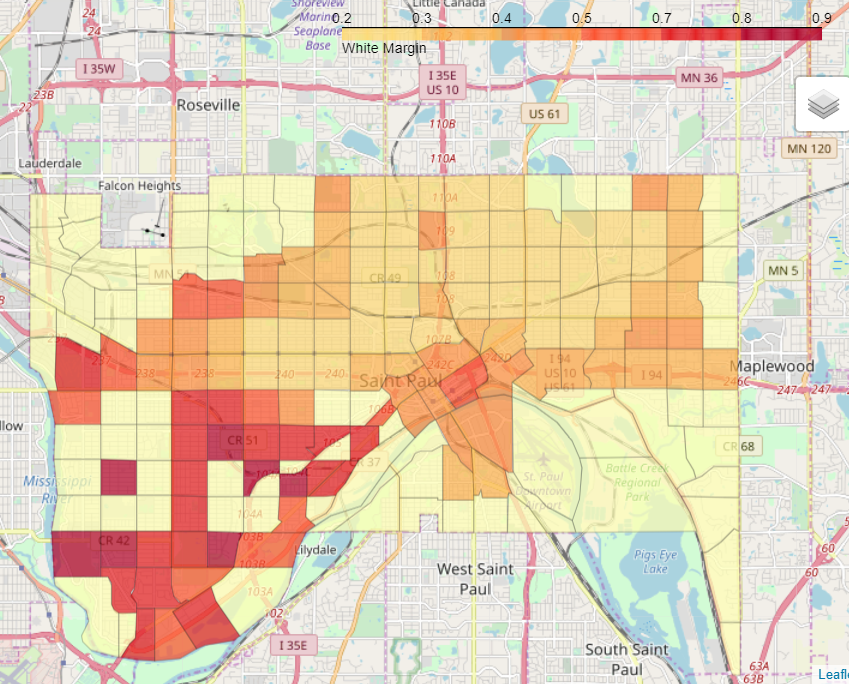
"### White Driver Margin in Saint Paul by Grid"
]
},
{
"cell_type": "markdown",
"metadata": {},
"source": [
""
]
},
{
"cell_type": "markdown",
"metadata": {},
"source": [
"### Black proportion in Saint Paul by Neighborhood(Census)"
]
},
{
"cell_type": "markdown",
"metadata": {},
"source": [
""
]
},
{
"cell_type": "markdown",
"metadata": {},
"source": [
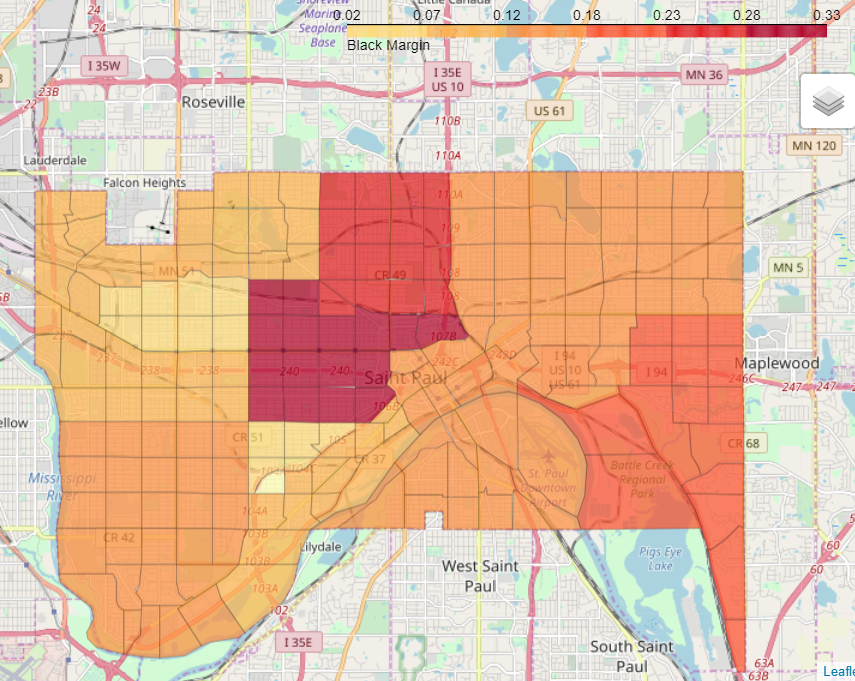
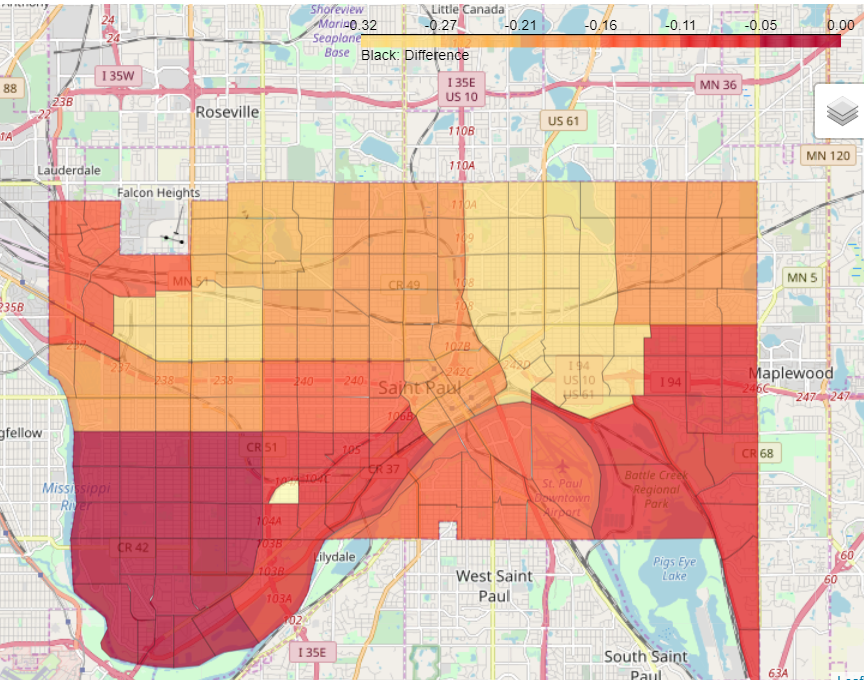
"### Black Drivers and Census Margin Difference in Saint Paul by Neighborhood\n",
"\n",
"I map out the difference between neighborhood of Blacks from the margin black drivers drivers stopped. For legend, Black drivers are by default over-representated!"
]
},
{
"cell_type": "markdown",
"metadata": {},
"source": [
""
]
},
{
"cell_type": "markdown",
"metadata": {},
"source": [
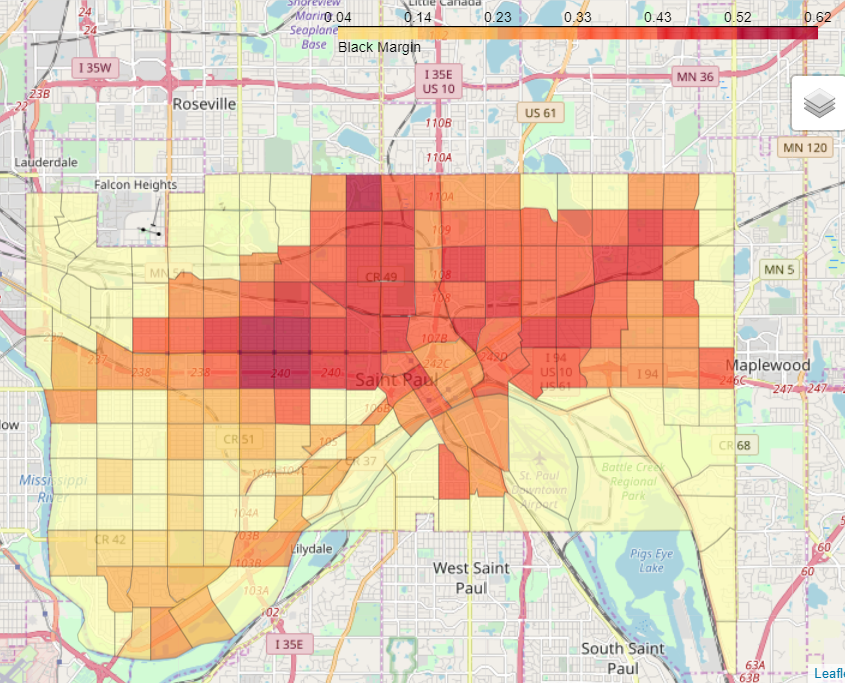
"### Black Drivers proportion in Saint Paul by Grid"
]
},
{
"cell_type": "markdown",
"metadata": {},
"source": [
""
]
},
{
"cell_type": "markdown",
"metadata": {},
"source": [
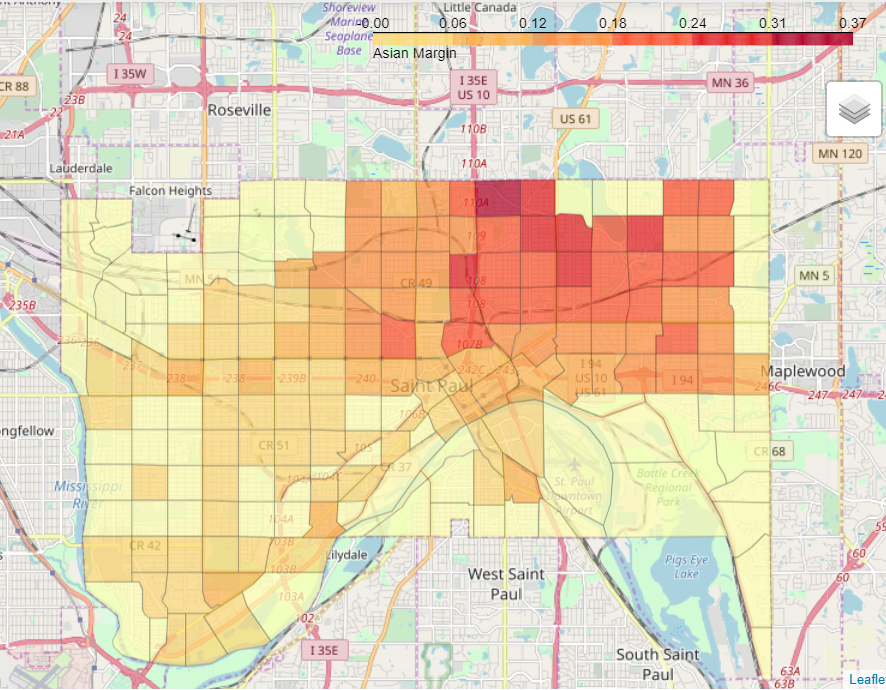
"### Asian proportion in Saint Paul by Neighborhood(Census)"
]
},
{
"cell_type": "markdown",
"metadata": {},
"source": [
""
]
},
{
"cell_type": "markdown",
"metadata": {},
"source": [
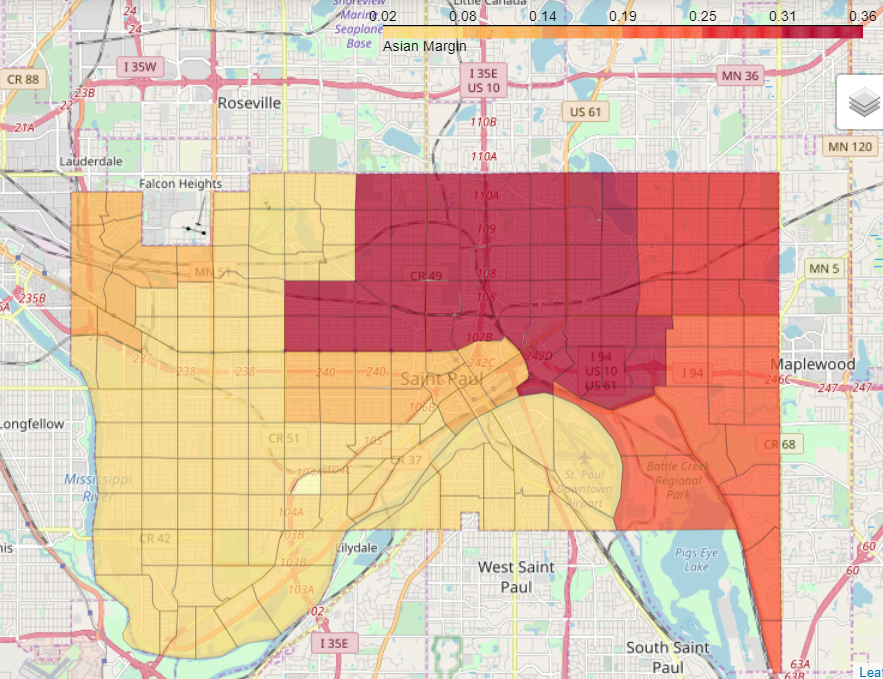
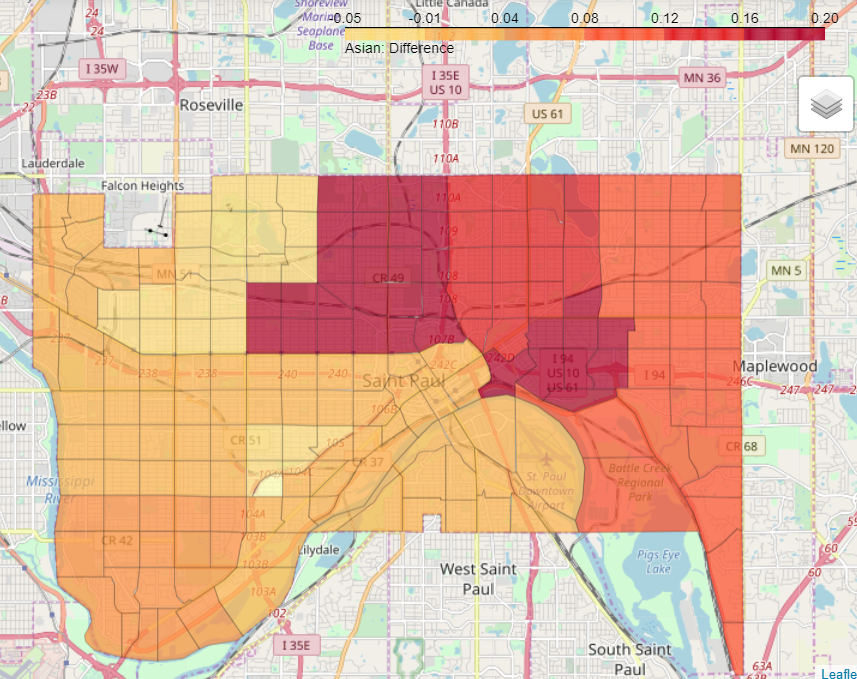
"### Asian Driver and Census Margin Difference in Saint Paul by Neighborhood\n",
"\n",
"I map out the difference between demographic distribution of Asian from the margin os Asian drivers stopped for traffic related incident. For legend, Asian drivers are by mostly underrepresentated."
]
},
{
"cell_type": "markdown",
"metadata": {},
"source": [
""
]
},
{
"cell_type": "markdown",
"metadata": {},
"source": [
"### Asian driver proportion in Saint Paul by Grid"
]
},
{
"cell_type": "markdown",
"metadata": {},
"source": [
""
]
},
{
"cell_type": "markdown",
"metadata": {},
"source": [
"**Quick Analysis**\n",
"\n",
"* The Frogtown community does not have heaviest density of traffic stops, but the cluster is very apparent to nearby grids\n",
"* Despite greater frequency of traffic stops in certain areas, the margin of citations is lower\n",
"* Many lower social economic areas have more equipment violations, which is also representated by their margin\n",
"* Many drivers in lower social economic areas are searched by margin and are stopped more regularly late night\n",
"* Black drivers are over-respresentated, while Asian drivers are under-representated. This is true across the city. \n",
"\n"
]
},
{
"cell_type": "markdown",
"metadata": {},
"source": [
"# Conclusions/Summary \n",
"\n",
"After digging into the data, we get a better grasp on how traffic stops are administered and the citation rate. Within Frogtown, the data shows that movement violations are more frequent during the daytime, which have a high citation rate. During late night, equipment violation is more frequent in the community. When expanding outward to the Saint Paul, we see that traffic stops are more frequent along university avenue, which is both commerical and the light transit runs through the avenue as well. The Frogtown area have more traffic stops than their neighboring community, with greater concentration from Western Ave to Lexington Ave. Within Saint Paul, there are similar communities like Frogtown.\n",
" \n",
"In regards to the racial question within Frogtown, Black and White drivers are over-representated, while Asians are under-representated for total citations given. Black drivers are at least twice more likely to be searched than their white counterparts for moving violations, despite having low citation rates. During the late night hours, black drivers are more likely to be stopped and have greater rates of moving violations. On the other hand, white drivers have greater citation rate during the morning time. Within gender, white female drivers get stopped. Though it's worth nothing that this can be due to the wealth gap between different racial lines. At the city level, we see that black drivers are over-representated on total traffic stops in all neighborhoods. On contrast, Asian drivers are under-representated respect to total traffic stops.\n",
" \n",
"This report created more questions than answers. Why is there discrepancies in the data? What is the criteria for an equipment violation; does crashes count? There is simply not enough volume of 911 calls and invesitgative stops to account for the imbalance.\n",
" \n",
"There is a lot more information that can be gleamed from the results. Please feel free to email me if you have any questions or thoughts.\n",
"\n",
"Please check out the numbers for your respective community in the Appendix.\n",
"\n"
]
},
{
"cell_type": "markdown",
"metadata": {},
"source": [
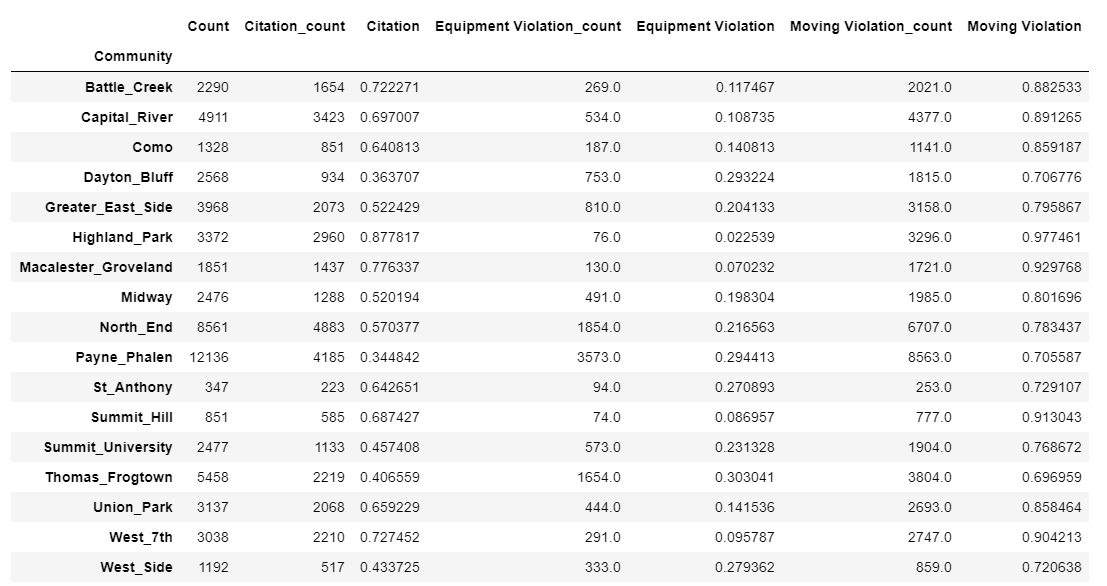
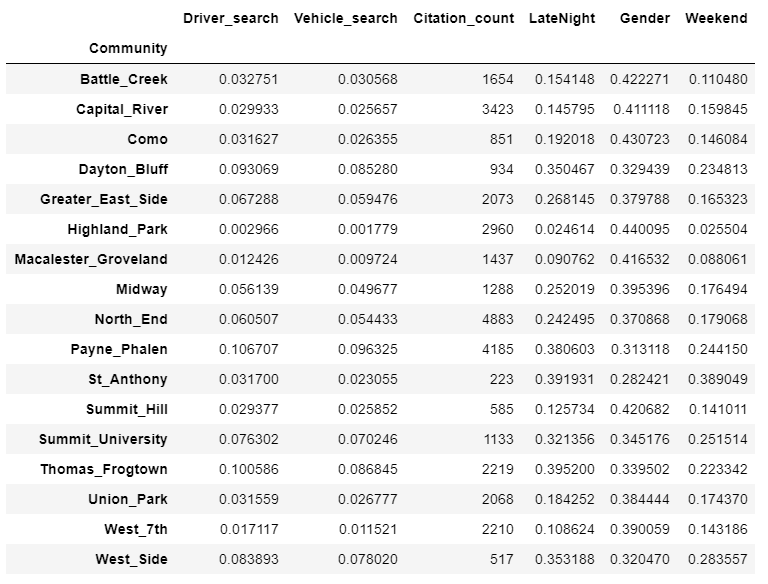
"# Appendix (Neighborhood Tables)"
]
},
{
"cell_type": "markdown",
"metadata": {},
"source": [
""
]
},
{
"cell_type": "markdown",
"metadata": {},
"source": [
""
]
},
{
"cell_type": "markdown",
"metadata": {},
"source": [
""
]
}
],
"metadata": {
"kernelspec": {
"display_name": "Python 3 (ipykernel)",
"language": "python",
"name": "python3"
},
"language_info": {
"codemirror_mode": {
"name": "ipython",
"version": 3
},
"file_extension": ".py",
"mimetype": "text/x-python",
"name": "python",
"nbconvert_exporter": "python",
"pygments_lexer": "ipython3",
"version": "3.12.3"
}
},
"nbformat": 4,
"nbformat_minor": 4
}