**Official Memtrace by Syncable.** Start at [memtrace.io/docs](https://www.memtrace.io/docs/getting-started). The official package is [memtrace on npm](https://www.npmjs.com/package/memtrace), and the public repository is [syncable-dev/memtrace-public](https://github.com/syncable-dev/memtrace-public). Other projects with the same name are unrelated. Compare `memtrace --version` with the [Stable and Nightly release history](https://www.memtrace.io/changelog).
For installation support, open an issue in the official public repository with your operating system, Memtrace version and exact error. Remove credentials and private source from shared logs. The Syncable team maintains this package and its support channels.
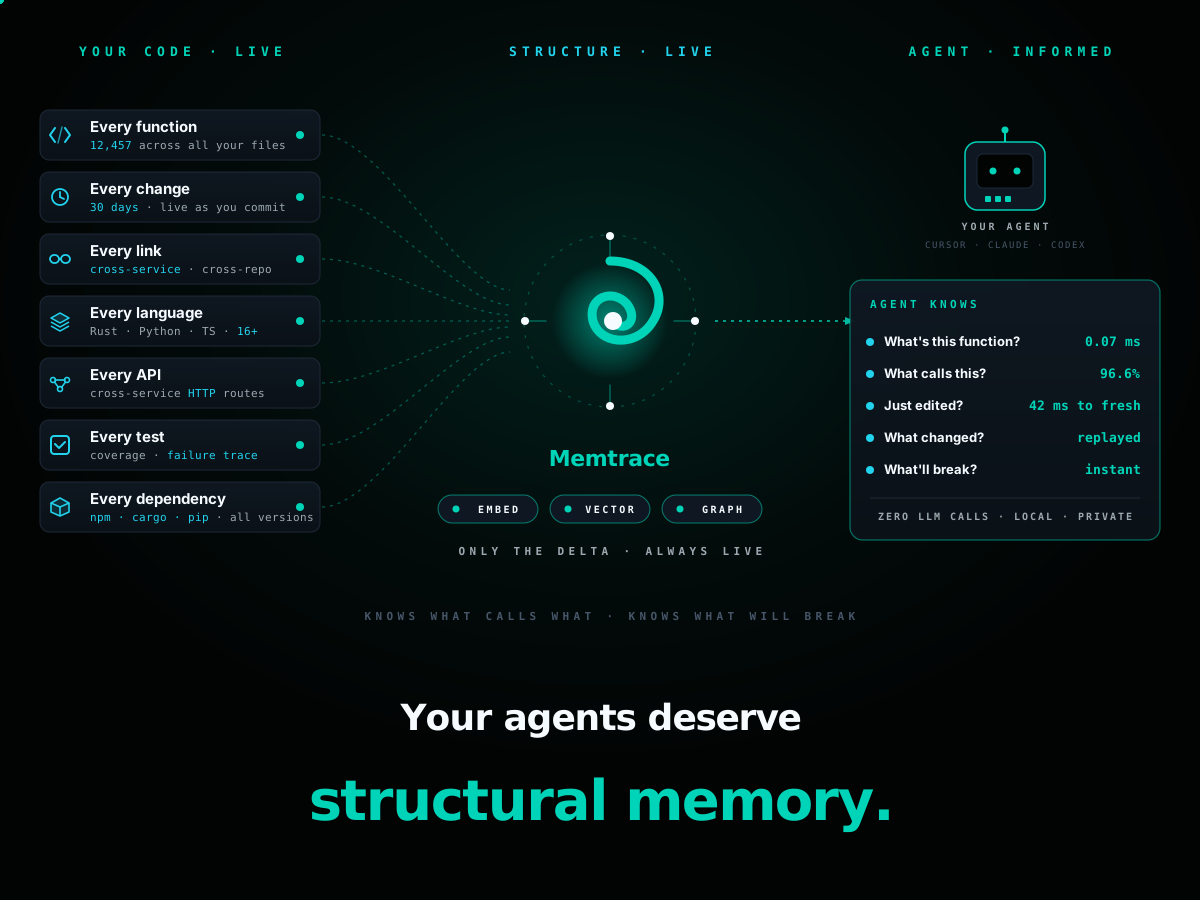
Memtrace turns your codebase into a live knowledge graph that AI coding agents can query in milliseconds — every function, class, call edge, and version, across every session, without re-reading files or breaking things they can't see.
Get your fleet on shared structural memory in under 90 seconds.
Structural · zero LLM calls · Bi-temporal · time-travel queries · Replay-aware · zero blind refactors
---
## DeepSeek Harness
Memtrace runs as a [DeepSeek Harness](https://github.com/deepseek-ai/deepseek-harness) plugin. Install Harness first (`npm install -g @deepseek-ai/dsh` — that is the `dsh` command), then add Memtrace:
```sh
npx -y @deepseek-ai/dsh plugin --profile web add github:syncable-dev/dsh-plugin-memtrace
```
Then ask the agent to index the workspace and pull blast radius, evolution, or an architecture briefing. Details: [syncable-dev/dsh-plugin-memtrace](https://github.com/syncable-dev/dsh-plugin-memtrace).
---
## What it does
**Three things, every release.**
🧭 **Run a fleet of coding agents on the same repo without merge hell.**
Each agent reads the same call graph, sees the same blast radius, inherits the same temporal history. No collisions. No stale context.
🔁 **Replay any refactor with full causal awareness.**
Agents see exactly what depends on what, and what changed when. No more *"I refactored a function and 14 tests broke that nobody saw."*
⚡ **Index a 50k-file repo in under 90 seconds.**
Rust + Tree-sitter, $0 in API costs, 20+ languages plus framework-aware scanners (Vapor, Lapis, Kong, GitHub Actions, Terraform, RLS policies, …), fully local. Your code never leaves your machine.
🆕 **LeanCTX Native — compressed reads, smart trees, and a value ledger.**
Four new compression modes on `get_source_window`, single-call directory maps, real-time token-savings dashboard, and an opt-in adaptive learner that beats the static table by ~14%. Full breakdown: [`docs/leanctx-native.md`](docs/leanctx-native.md). Available in v0.3.57+.
https://github.com/user-attachments/assets/e7d6a1e9-c912-4e65-a421-bd0256dffa5a
---
## Numbers
| Operation | Memtrace | Best alternative | Δ |
|---|---|---|---|
| Index 1,500 files | **1.5s · $0** | Mem0: 31 min · $10–50 | **~1,200× faster** |
| Exact symbol query (acc@1, lat) | **96.6% · 0.07 ms** | GitNexus: 97.0% · 8.95 ms | 128× lower latency |
| Graph callers recall (Django) | **81.6%** | GitNexus: 5.3% | **15.4×** |
| Incremental re-index p95 | **42.5 ms** | CodeGrapher: 613.7 ms | 14.4× |
| Hybrid acc@1 (Django, 3K cases) | **73.9%** | GitNexus: 38.6% | 1.91× |
| PR code-review F1 (50 PRs) | **0.7268** | Cubic v2: 0.6077 | **+19.60%** |
| RSS / process | **26 MB** | ChromaDB: 1,060 MB | **41× tighter** |
| Languages | **16+** (Tree-sitter) | varies | — |
Reproducible benchmark suite: [`benchmarks/`](benchmarks/README.md). Same machine, same corpora, same adapter contract. Ground truth from Python's `ast` and `pyright` LSP — never from any tool's own index. **No system gets a home-field advantage in the dataset.**
Detailed breakdowns: [BENCHMARKS-v0.3.22.md](BENCHMARKS-v0.3.22.md) · [BENCHMARKS-v0.3.29.md](BENCHMARKS-v0.3.29.md) · [Code reviewer benchmark](docs/code-reviewer.md#offline-benchmark-snapshot)
---
## GitHub Star Growth
---
## Get access
Memtrace is in **private beta**. We're rolling out access in batches to keep the feedback loop tight — every cohort lands in a Discord channel where we ship fixes from real bug reports inside a week.
→ **Join the waitlist at [memtrace.io](https://memtrace.io).**
Already have access? `npm install -g memtrace` and you're indexing in 90 seconds. Full setup below.
> 🔒 **Privacy.** Memtrace runs entirely on your machine. Source code never leaves it. The only network traffic is license validation, aggregate node/edge counts, and opt-out crash telemetry — no source, no file paths, no symbol names. Full breakdown: [PRIVACY.md](PRIVACY.md), [TELEMETRY.md](TELEMETRY.md). Disable telemetry with `MEMTRACE_TELEMETRY=off`.
---
## Why Memtrace exists
Good code-intelligence tools already exist. GitNexus and CodeGrapherContext build AST-based graphs that work for *"what's in my repo right now."*
**Memtrace is a bi-temporal episodic structural knowledge graph.** It builds on the same AST foundation and adds two dimensions:
- **Temporal memory** — every symbol carries its full version history. Six scoring algorithms (impact, novelty, recency, directional, compound, overview) let agents ask different temporal questions: *"what changed?"*, *"what's unexpected?"*, *"what'll break?"*.
- **Cross-service API topology** — Memtrace maps HTTP call graphs *between* repositories, detecting which services call which endpoints across your architecture.
On top of that, the structural layer is comprehensive:
| | |
|---|---|
| **Symbols are nodes** | functions, classes, interfaces, types, endpoints |
| **Relationships are edges** | `CALLS`, `IMPLEMENTS`, `IMPORTS`, `EXPORTS`, `CONTAINS` |
| **Community detection** | Louvain algorithm identifies architectural modules automatically |
| **Hybrid retrieval** | Tantivy BM25 + vector embeddings + Reciprocal Rank Fusion + cross-encoder rerank |
| **Rust-native** | compiled binary, no Python/JS runtime overhead, sub-8 ms p95 query latency |
The agent doesn't just search your code. **It remembers it.**
---
## Memtrace vs. general memory systems (Mem0, Graphiti)
Mem0 and Graphiti are strong conversational memory engines designed for tracking entity knowledge (e.g. `User -> Likes -> Apples`). They excel at that. For code intelligence specifically, the tradeoff is that they rely on LLM inference to build their graphs — which adds cost and time when processing thousands of source files.
**Graphiti** processes data through `add_episode()`, which triggers multiple LLM calls per episode — entity extraction, relationship resolution, deduplication. At ~50 episodes/minute ([source](https://github.com/getzep/graphiti)), ingesting 1,500 code files takes **1–2 hours**.
**Mem0** processes data through `client.add()`, which queues async LLM extraction and conflict resolution per memory item ([source](https://mem0.ai)). Bulk ingestion with `infer=True` (default) means every file passes through an LLM pipeline. Throughput is bounded by your LLM provider's rate limits.
**Both** accumulate $10–50+ in API costs for large codebases because every relationship is inferred rather than parsed.
**Memtrace takes a different approach:** it indexes 1,500 files in 1.2–1.8 seconds for $0.00 — no LLM calls, no API costs, no rate limits. Native Tree-sitter AST parsers resolve deterministic symbol references (`CALLS`, `IMPLEMENTS`, `IMPORTS`) locally. The tradeoff is that Memtrace is purpose-built for code — it doesn't handle conversational entity memory the way Mem0 and Graphiti do.
---
## 25+ MCP tools
Memtrace exposes a full structural toolkit via the Model Context Protocol.