--- title: "Introduction" fontsize: 14pt bibliography: bibtex.bib editor_options: chunk_output_type: console type: docs weight: 1 --- > **Note:** if you use *{`systemPipeR`}* in published research, please cite: > Backman, T.W.H and Girke, T. (2016). *systemPipeR*: NGS Workflow and Report Generation Environment. *BMC Bioinformatics*, 17: 388. \>[10.1186/s12859-016-1241-0](https://doi.org/10.1186/s12859-016-1241-0). [*`systemPipeR`*(SPR)](http://www.bioconductor.org/packages/devel/bioc/html/systemPipeR.html) provides flexible utilities for designing, building and running automated end-to-end analysis workflows for a wide range of research applications, including next-generation sequencing (NGS) experiments, such as RNA-Seq, ChIP-Seq, VAR-Seq and Ribo-Seq (H Backman and Girke 2016). Important features include a uniform workflow interface across different data analysis applications, automated report generation, and support for running both R and command-line software, such as NGS aligners or peak/variant callers, on local computers or compute clusters (Figure 1). The latter supports interactive job submissions and batch submissions to queuing systems of clusters. *`systemPipeR`* has been designed to improve the reproducibility of large-scale data analysis projects while substantially reducing the time it takes to analyze complex omics data sets. It provides a uniform workflow interface and management system that allows the users to run selected workflow steps, as well as customize and design entirely new workflows. Additionally, the package take advantage of central community S4 classes of the Bioconductor ecosystem, and enhances them with command-line software support. The main motivation and advantages of using *`systemPipeR`* for complex data analysis tasks are: 1. Design of complex workflows involving multiple R/Bioconductor packages 2. Common workflow interface for different applications 3. User-friendly access to widely used Bioconductor utilities 4. Support of command-line software from within R 5. Reduced complexity of using compute clusters from R 6. Accelerated runtime of workflows via parallelization on computer systems with multiple CPU cores and/or multiple nodes 7. Improved reproducibility by automating the generation of analysis reports
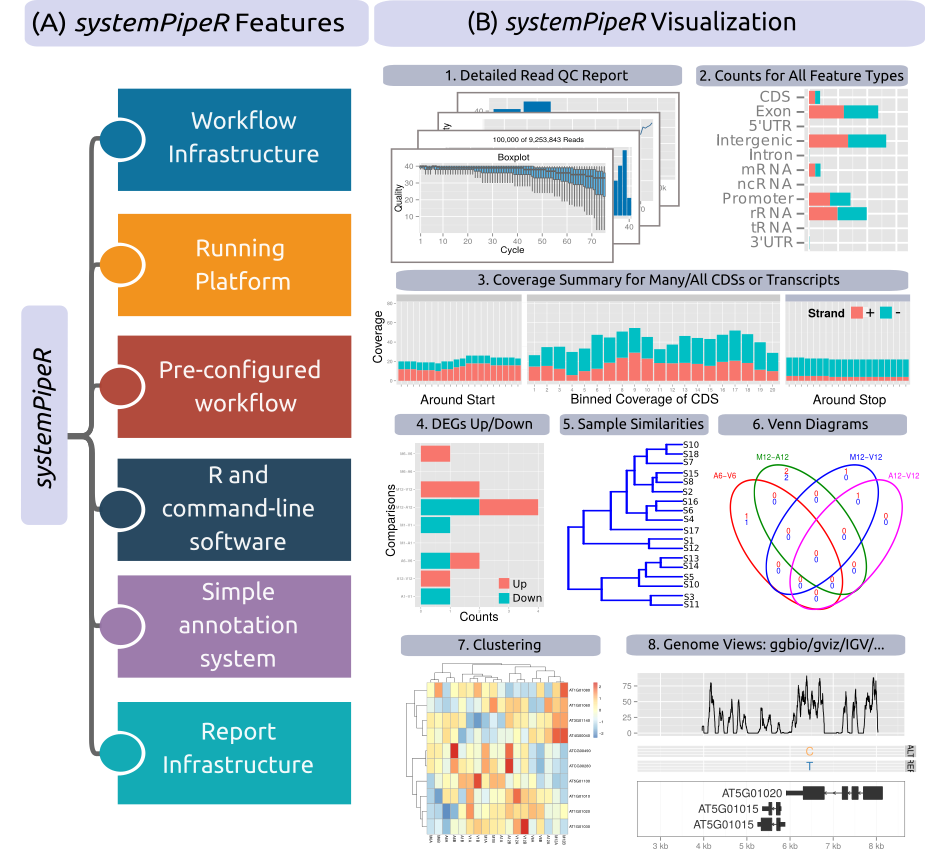
Figure 1: Relevant features in `systemPipeR`. Workflow design concepts are illustrated under (A). Examples of `systemPipeR's` visualization functionalities are given under (B).
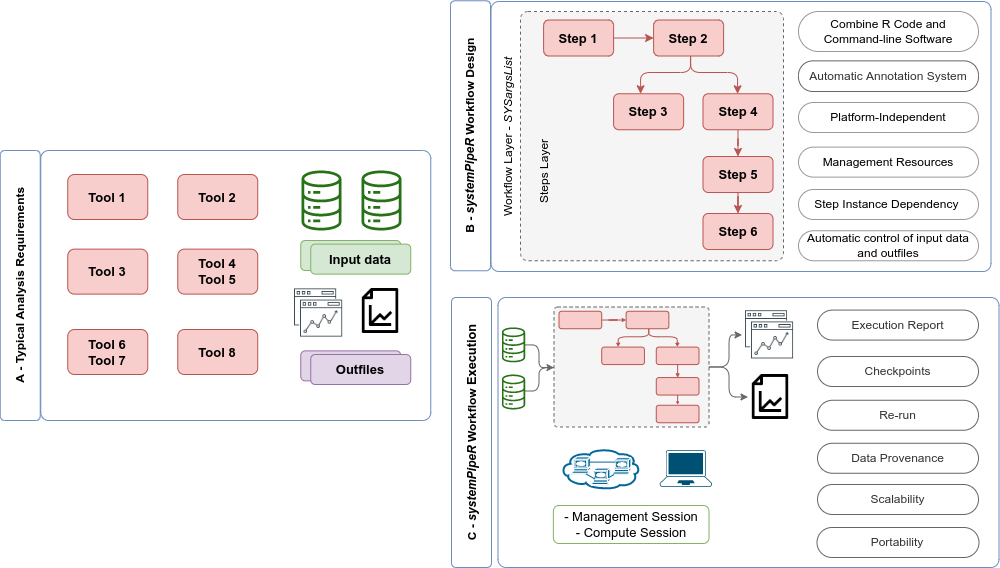
Figure 2: Overview of `systemPipeR` workflows management instances. A) A typical analysis workflow requires multiple software tools (red), as well the description of the input (green) and output files, including analysis reports (purple). B) `systemPipeR` provides multiple utilities to design and build a workflow, allowing multi-instance, integration of R code and command-line software, a simple and efficient annotation system, that allows automatic control of the input and output data, and multiple resources to manage the entire workflow. c) Options are provided to execute single or multiple workflow steps, while enabling scalability, checkpoints, and generation of technical and scientific reports.
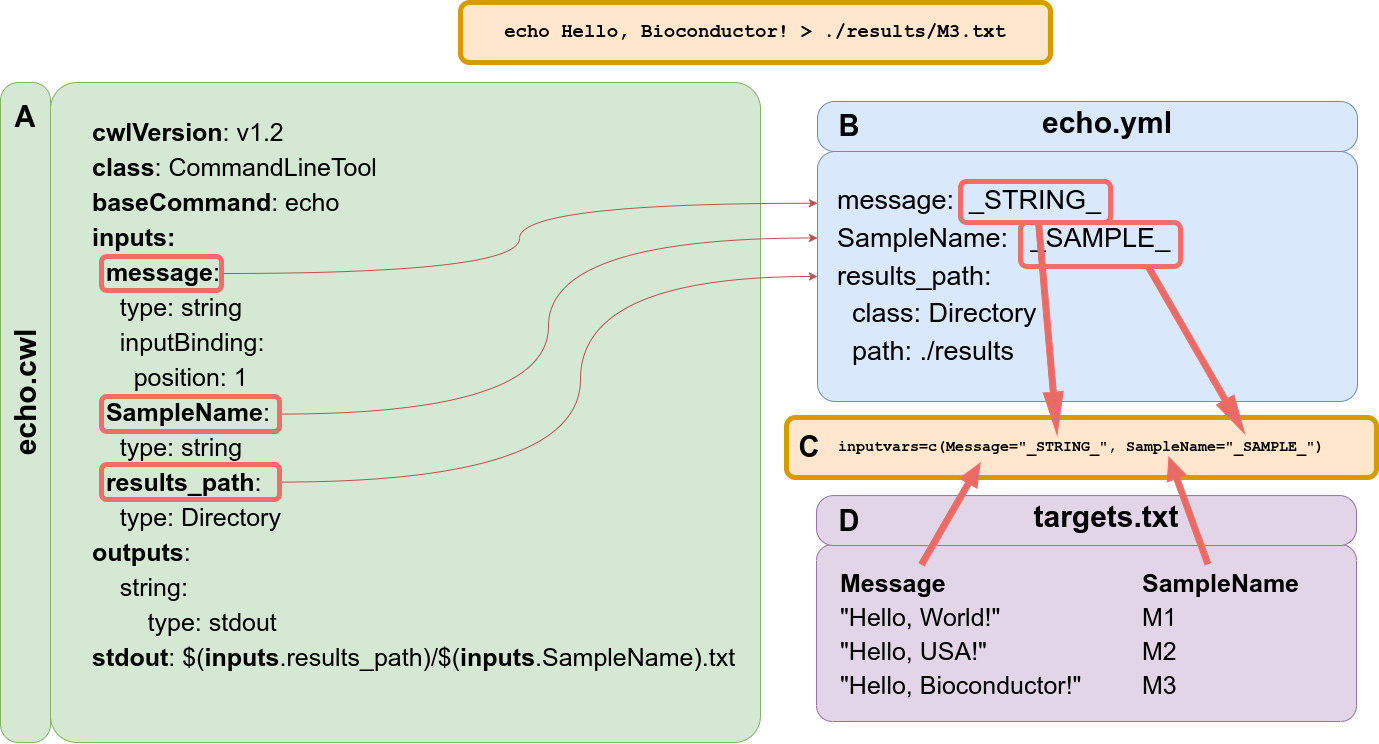
Figure 3: Example of ‘Hello World’ message using CWL syntax and demonstrating the connectivity with `systemPipeR`. (A) This file describes the command-line tool, here using ‘echo’ command. (B) This file describes all the parameters variables connected with the tool specification file. Here the reference value of the input parameter can be specific or can be filled dynamically, adding a variable that connects with the targets files from `systemPipeR`. (C) `SYSargsList` function provides the ‘inputvars’ arguments to build the connectivity between the CWL description of parameters and the targets files. The argument requires a named vector where each vector element is required to be defined in the CWL description of parameters file (B), and the names of the elements are needed to match the column names defined in the targets file (D).