---
title: Interface Overview
nav_order: 3
tags:
- Guide
- External
- User
# exclude-from-main-guides-list
---
## Interface Overview
This section introduces the Walksheds interface, including the sidebar tabs, map controls, and legend.
_For a list of all guides on the TCAT Wiki, refer to the [Guides List](../../guides-list/index.md)._{ .guides-list-ref }
---
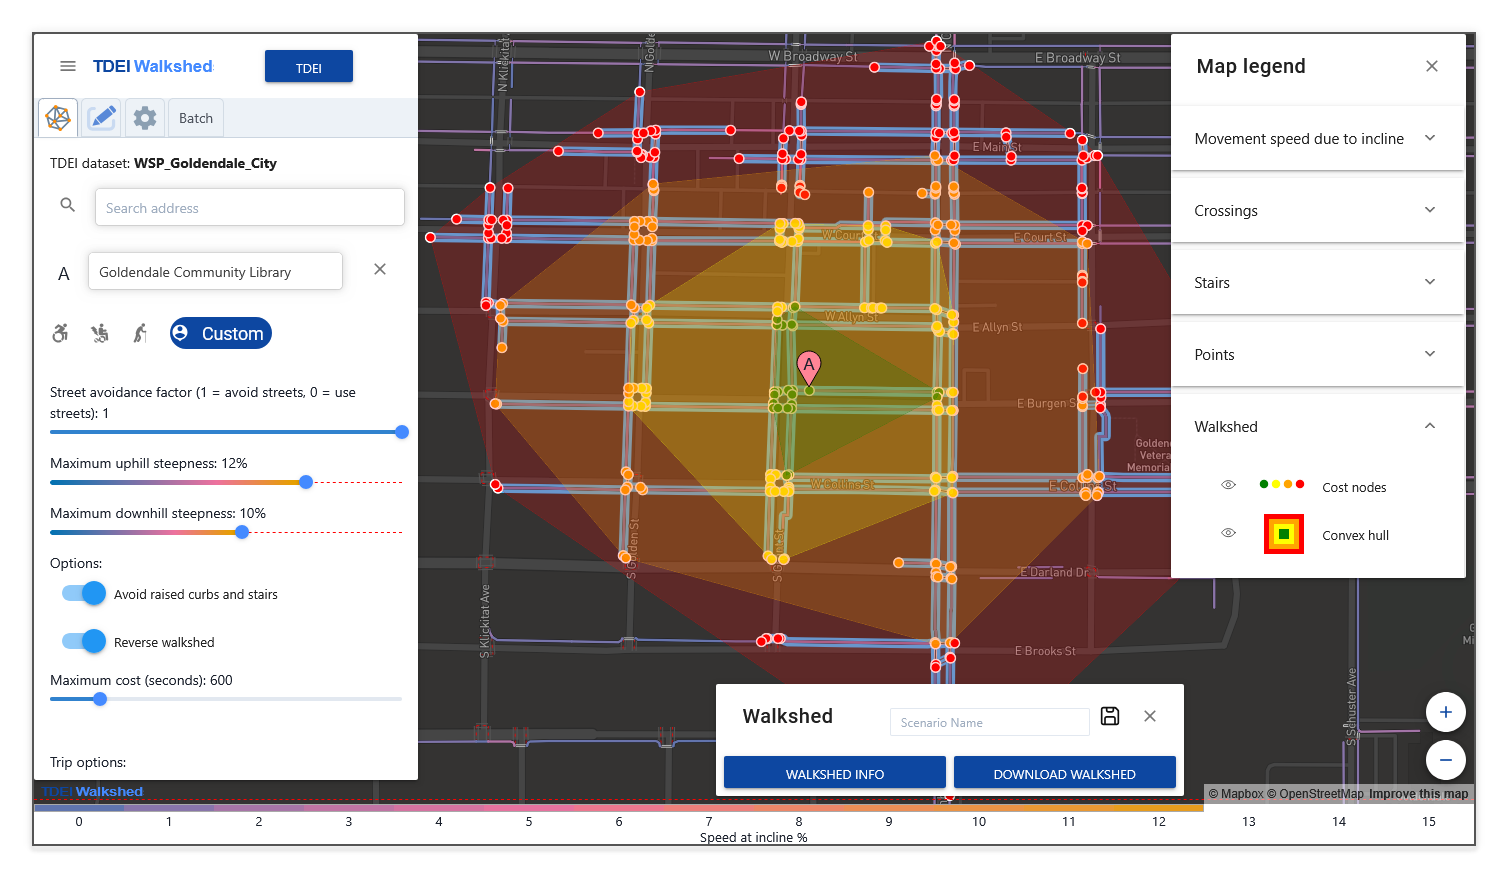
### Map Overview
The Walksheds tool interface consists of two main areas: the **sidebar** on the left, which contains tabs for dataset selection, walkshed configuration, and other functions; and the **map view** on the right, which displays the pedestrian network and the calculated walkshed.

---
### Sidebar
The left sidebar is the primary control panel for the Walksheds tool. It contains the following tabs:
| Tab | Icon | Purpose |
|:-------------------------|:----------------|:------------------------------------------------------------------------------------------------------------------------|
| **Walkshed Preferences** | Network graph | Search for an address and configure walkshed preferences. Refer to [Mobility Profiles and Preferences](preferences.md). |
| **Edits** | Pencil | Review, manage, or remove [Edits](edits.md) and saved [Scenarios](scenarios.md). |
| **Datasets** | Settings (gear) | Select a TDEI dataset and build the routing graph. Refer to [Datasets](datasets.md). |
| **Batch** | _(none)_ | Run multiple walkshed calculations from a CSV file. Refer to [Batches](batches.md). |
---
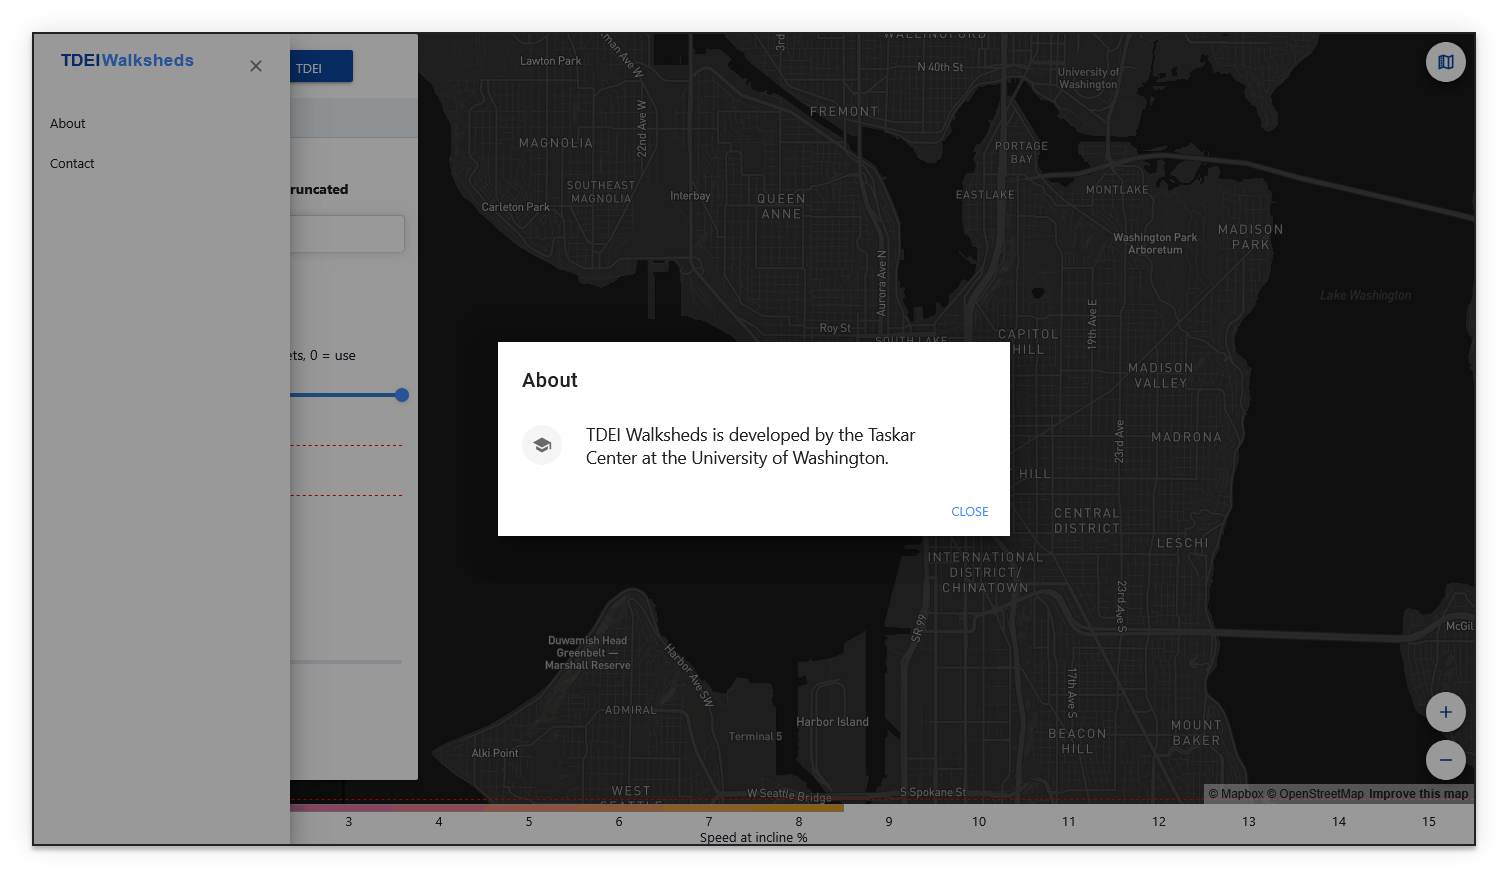
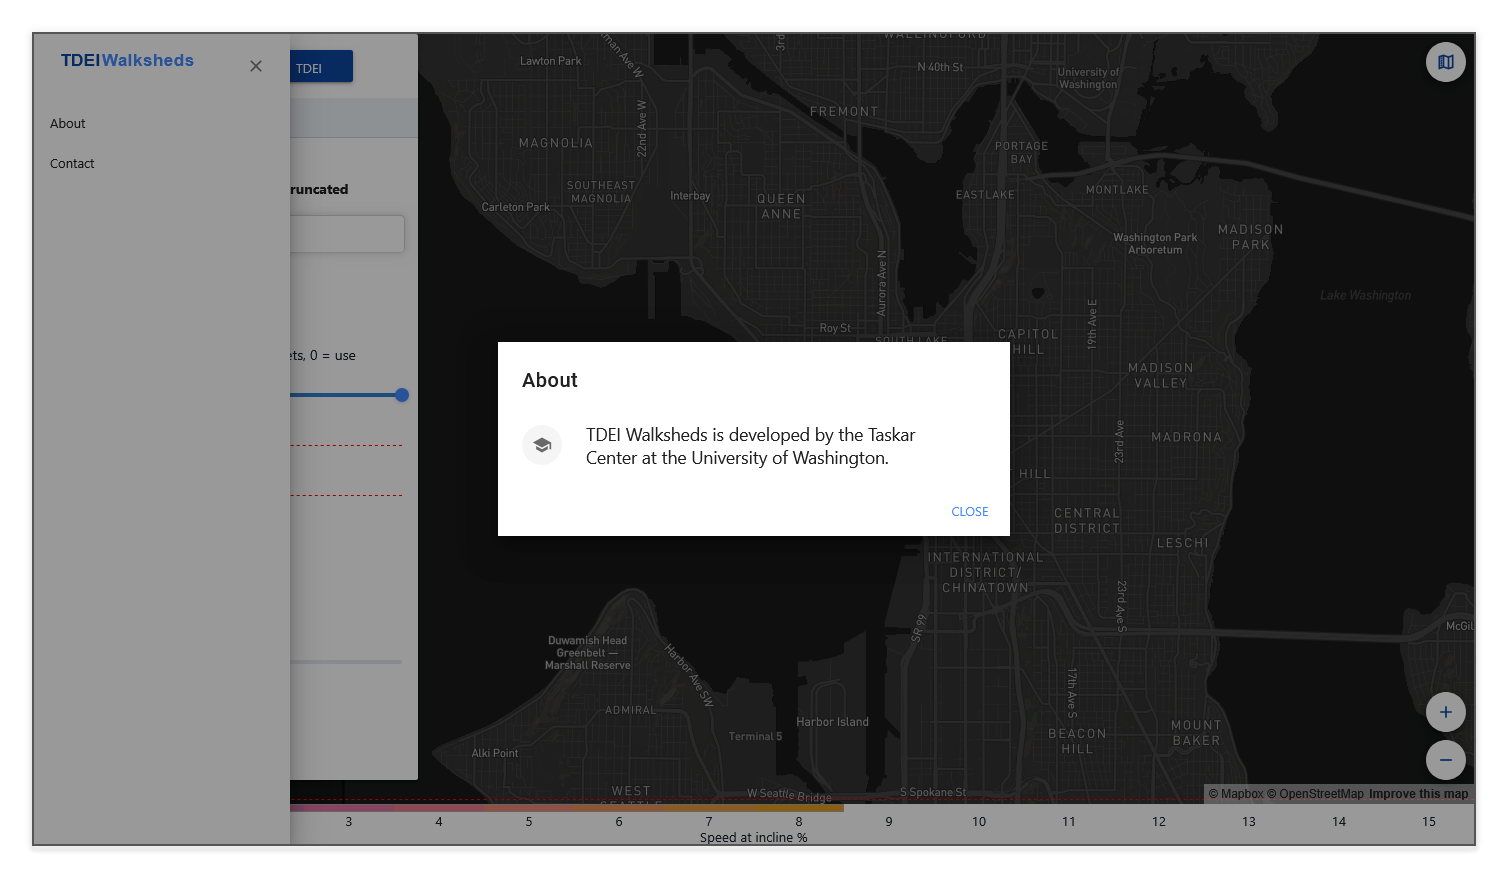
### Main Menu
Select the **Main Menu** button (☰ "hamburger" icon) at the top left of the sidebar to open a panel with the following options:
| Option | Description |
|:------------|:--------------------------------------------------------|
| **About** | Opens a popup with information about the Walksheds tool |
| **Contact** | Opens a popup with contact and support information |
---
### Reading the Map
The walkshed is displayed on the map with all reachable paths (sidewalks, crossings, and other paths) highlighted in **blue**. Areas excluded by slope limits, obstacle avoidance, or street avoidance settings appear as gaps, reflecting real barriers in the pedestrian environment.
Individual walkways are color-coded by how their incline affects movement speed: flat edges appear **blue**, moderately inclined edges shift toward **pink** and **orange**, and edges that exceed the slope limit appear as **red** dotted lines. The [Incline Bar](#incline-bar) at the bottom of the screen provides a live reference for this color scale, updating automatically as you adjust steepness preferences.
---
{ .img-right }
{ .img-right }
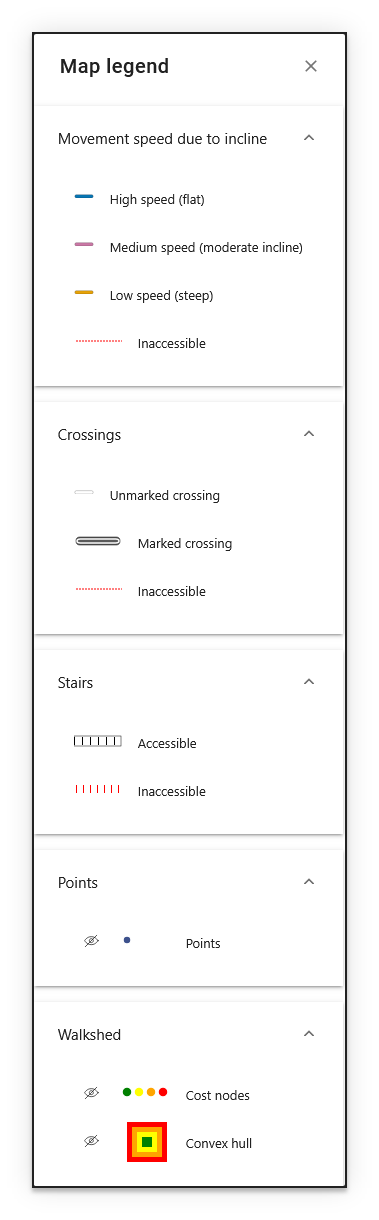
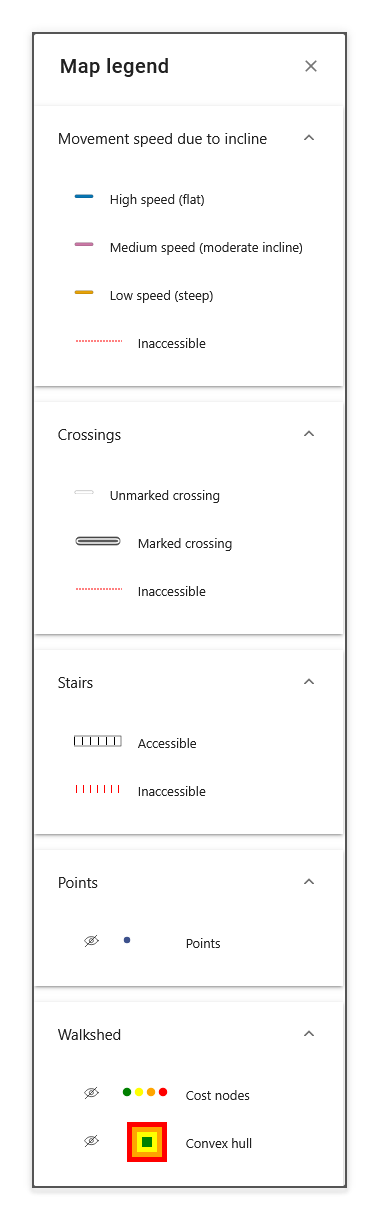
### Map Legend
Select the **Map Legend** button (top right of the map) to open a right sidebar that explains the symbols and colors used on the map. The legend is organized into the following sections:
**Movement Speed Due to Incline**
Walkways are color-coded by how their incline affects movement speed:
- **Blue** solid line — High speed (flat)
- **Pink** solid line — Medium speed (moderate incline)
- **Orange** solid line — Low speed (steep)
- **Red** dotted line — Inaccessible
**Crossings**
- **Light gray** line — Unmarked crossing
- **Striped** line — Marked crossing
- **Red** dotted line — Inaccessible
**Stairs**
- **Black** dashed blocks — Accessible
- **Red** dashed blocks — Inaccessible
**Points**
Point features (such as curb ramps, signals, and other landmarks) are displayed as small dots on the map.
**Walkshed**
- **Cost Nodes** — Network nodes color-coded with their computed travel cost from the origin. The four colors (green, yellow, orange, and red) correspond to isochrones representing quartiles of travel cost from the origin.
- **Convex Hull** — The outer boundary polygon of the walkshed with color-coded isochrones representing quartiles of travel cost from the origin.
!!! tip "Cost nodes or convex hull not visible on the map view?"
Toggle their visibility (eye icon) from the Map Legend panel.
---
### Incline Bar
At the very bottom of the screen, a horizontal bar displays a color gradient labeled **Speed at incline %**. This bar maps incline percentages (from flat to steep) to the colors used on the map, which update in real time based on the currently selected mobility profile's maximum uphill and downhill steepness settings, providing a quick reference for interpreting path colors without opening the full map legend.
!!! tip
The image comparison slider above compares two map views: one where the steepness values are set to the minimum possible, and one where the steepness values are set to the maximum possible. This highlights how the steepness sliders, incline bar, and map contents all update in sync.
---
### Action Pop-up
After a walkshed is generated, an action pop-up appears at the bottom of the screen with options to [view walkshed information](sidewalk-score.md), download results as a GeoJSON file, and save [scenarios](scenarios.md) for later comparison.
---
Previous: [Getting Started](getting-started.md)
Next: [Mobility Profiles and Preferences](preferences.md)


