Cartesian coordinates with x and y flipped
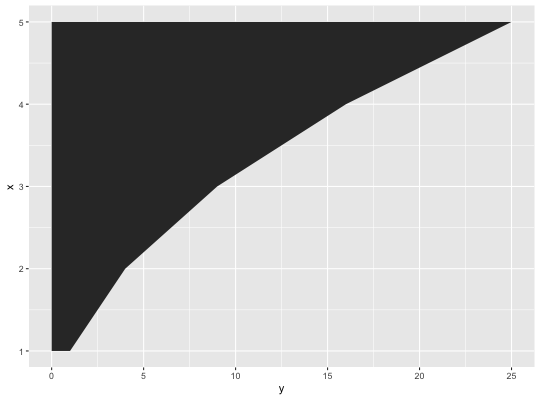
Flip cartesian coordinates so that horizontal becomes vertical, and vertical, horizontal. This is primarily useful for converting geoms and statistics which display y conditional on x, to x conditional on y.
coord_flip(xlim = NULL, ylim = NULL, expand = TRUE)
Arguments
| xlim | Limits for the x and y axes. |
|---|---|
| ylim | Limits for the x and y axes. |
| expand | If |
Examples
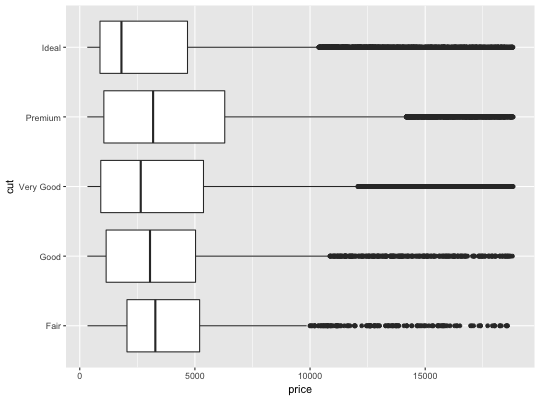
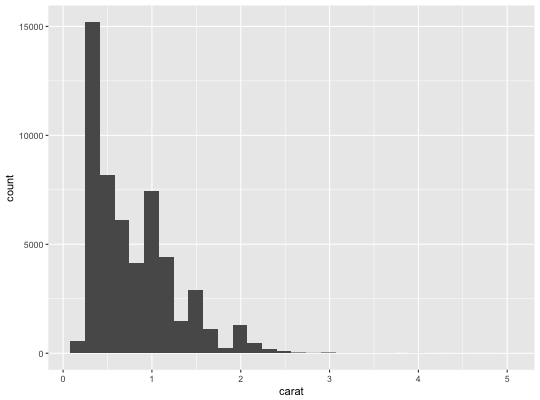
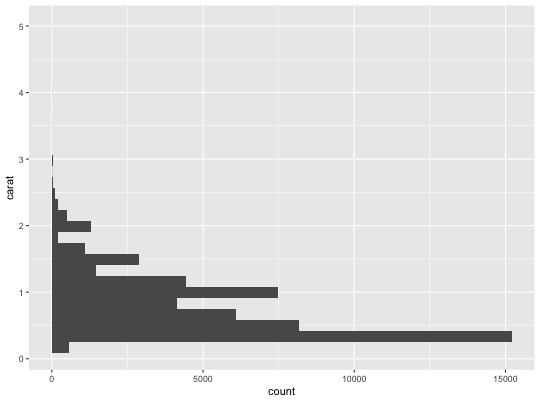
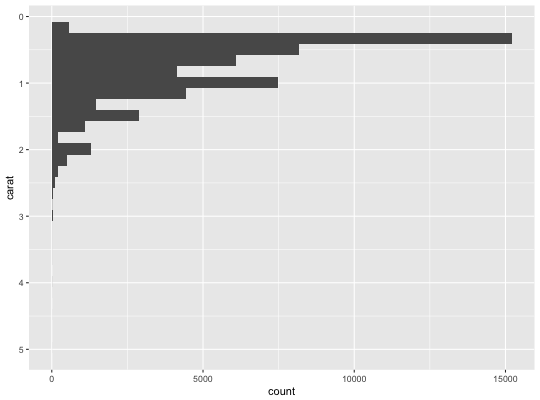
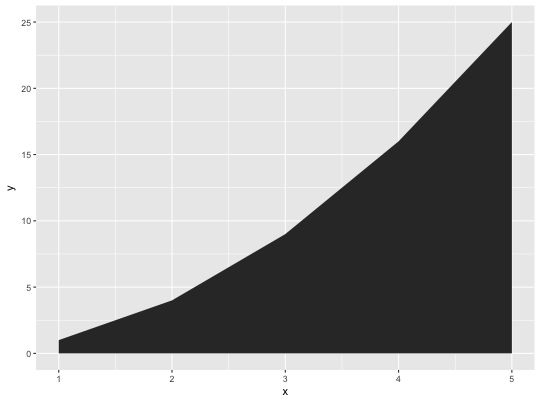
# Very useful for creating boxplots, and other interval # geoms in the horizontal instead of vertical position. ggplot(diamonds, aes(cut, price)) + geom_boxplot() + coord_flip()#>h + coord_flip()#>#># You can also use it to flip line and area plots: df <- data.frame(x = 1:5, y = (1:5) ^ 2) ggplot(df, aes(x, y)) + geom_area()last_plot() + coord_flip()