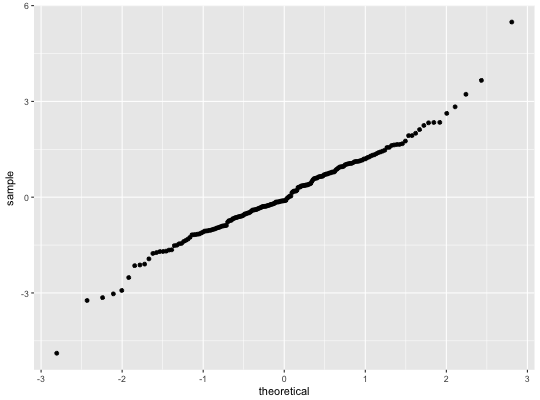
A quantile-quantile plot
A quantile-quantile plot
geom_qq(mapping = NULL, data = NULL, geom = "point",
  position = "identity", ..., distribution = stats::qnorm,
  dparams = list(), na.rm = FALSE, show.legend = NA, inherit.aes = TRUE)

stat_qq(mapping = NULL, data = NULL, geom = "point",
  position = "identity", ..., distribution = stats::qnorm,
  dparams = list(), na.rm = FALSE, show.legend = NA, inherit.aes = TRUE)
Arguments
| mapping | Set of aesthetic mappings created by |
|---|---|
| data | The data to be displayed in this layer. There are three options: If A A |
| geom | The geometric object to use display the data |
| position | Position adjustment, either as a string, or the result of a call to a position adjustment function. |
| ... | other arguments passed on to |
| distribution | Distribution function to use, if x not specified |
| dparams | Additional parameters passed on to |
| na.rm | If |
| show.legend | logical. Should this layer be included in the legends?
|
| inherit.aes | If |
Aesthetics
stat_qq understands the following aesthetics (required aesthetics are in bold):
samplegroupxy
Computed variables
- sample
sample quantiles
- theoretical
theoretical quantiles
Examples
# Use fitdistr from MASS to estimate distribution params params <- as.list(MASS::fitdistr(df$y, "t")$estimate)#> Warning: NaNs produced#> Warning: NaNs produced