Create a data frame of map data
Easily turn data from the maps package in to a data frame suitable for plotting with ggplot2.
map_data(map, region = ".", exact = FALSE, ...)
Arguments
| map | name of map provided by the maps package. These
include |
|---|---|
| region | name of subregions to include. Defaults to |
| exact | should the |
| ... | all other arguments passed on to |
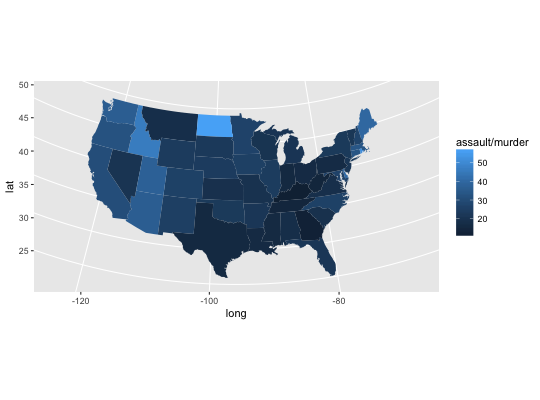
Examples
if (require("maps")) {
states <- map_data("state")
arrests <- USArrests
names(arrests) <- tolower(names(arrests))
arrests$region <- tolower(rownames(USArrests))

choro <- merge(states, arrests, sort = FALSE, by = "region")
choro <- choro[order(choro$order), ]
ggplot(choro, aes(long, lat)) +
  geom_polygon(aes(group = group, fill = assault)) +
  coord_map("albers",  at0 = 45.5, lat1 = 29.5)

ggplot(choro, aes(long, lat)) +
  geom_polygon(aes(group = group, fill = assault / murder)) +
  coord_map("albers",  at0 = 45.5, lat1 = 29.5)
}