Position scales for date/time data
These are the default scales for the three date/time class. These will
usually be added automatically. To override manually, use
scale_*_date for dates (class Date),
scale_*_datetime for datetimes (class POSIXct), and
scale_*_time for times (class hms).
scale_x_date(name = waiver(), breaks = waiver(), date_breaks = waiver(),
  labels = waiver(), date_labels = waiver(), minor_breaks = waiver(),
  date_minor_breaks = waiver(), limits = NULL, expand = waiver(),
  position = "bottom")

scale_y_date(name = waiver(), breaks = waiver(), date_breaks = waiver(),
  labels = waiver(), date_labels = waiver(), minor_breaks = waiver(),
  date_minor_breaks = waiver(), limits = NULL, expand = waiver(),
  position = "left")

scale_x_datetime(name = waiver(), breaks = waiver(),
  date_breaks = waiver(), labels = waiver(), date_labels = waiver(),
  minor_breaks = waiver(), date_minor_breaks = waiver(), timezone = NULL,
  limits = NULL, expand = waiver(), position = "bottom")

scale_y_datetime(name = waiver(), breaks = waiver(),
  date_breaks = waiver(), labels = waiver(), date_labels = waiver(),
  minor_breaks = waiver(), date_minor_breaks = waiver(), timezone = NULL,
  limits = NULL, expand = waiver(), position = "left")

scale_x_time(name = waiver(), breaks = waiver(), minor_breaks = waiver(),
  labels = waiver(), limits = NULL, expand = waiver(), oob = censor,
  na.value = NA_real_, position = "bottom")

scale_y_time(name = waiver(), breaks = waiver(), minor_breaks = waiver(),
  labels = waiver(), limits = NULL, expand = waiver(), oob = censor,
  na.value = NA_real_, position = "left")
Arguments
| name | The name of the scale. Used as axis or legend title. If
|
|---|---|
| breaks | One of:
|
| date_breaks | A string giving the distance between breaks like "2
weeks", or "10 years". If both |
| labels | One of:
|
| date_labels | A string giving the formatting specification for the
labels. Codes are defined in |
| minor_breaks | One of:
|
| date_minor_breaks | A string giving the distance between minor breaks
like "2 weeks", or "10 years". If both |
| limits | A numeric vector of length two providing limits of the scale.
Use |
| expand | A numeric vector of length two giving multiplicative and
additive expansion constants. These constants ensure that the data is
placed some distance away from the axes. The defaults are
|
| position | The position of the axis. "left" or "right" for vertical scales, "top" or "bottom" for horizontal scales |
| timezone | The timezone to use for display on the axes. The default
( |
| oob | Function that handles limits outside of the scale limits (out of bounds). The default replaces out of bounds values with NA. |
| na.value | Missing values will be replaced with this value. |
See also
Other position scales: scale_x_continuous,
scale_x_discrete
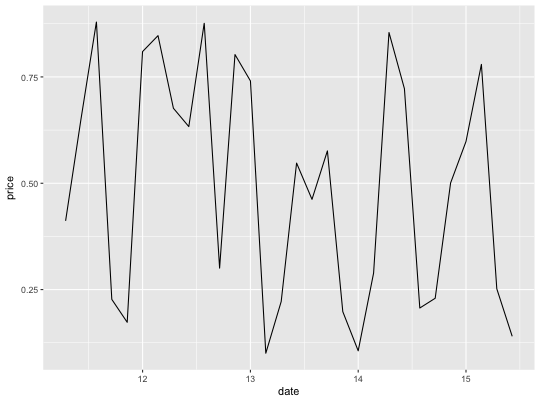
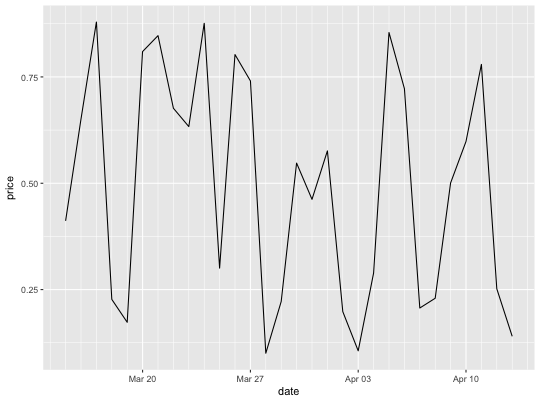
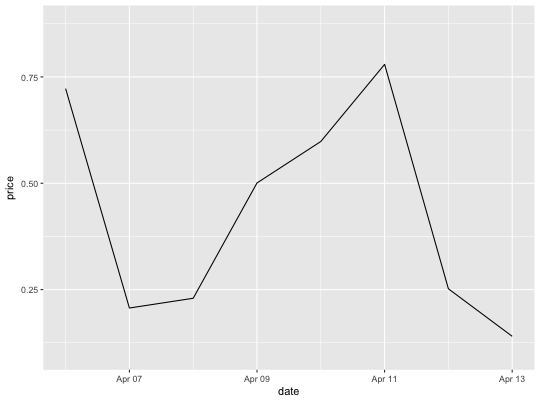
Examples
last_month <- Sys.Date() - 0:29 df <- data.frame( date = last_month, price = runif(30) ) base <- ggplot(df, aes(date, price)) + geom_line() # The date scale will attempt to pick sensible defaults for # major and minor tick marks. Override with date_breaks, date_labels # date_minor_breaks arguments. base + scale_x_date(date_labels = "%b %d")base + scale_x_date(date_breaks = "1 week", date_labels = "%W")base + scale_x_date(date_minor_breaks = "1 day")# Set limits base + scale_x_date(limits = c(Sys.Date() - 7, NA))#> Warning: Removed 22 rows containing missing values (geom_path).