Create your own discrete scale
This allows you to specify you own set of mappings from levels in the data to aesthetic values.
scale_colour_manual(..., values)

scale_fill_manual(..., values)

scale_size_manual(..., values)

scale_shape_manual(..., values)

scale_linetype_manual(..., values)

scale_alpha_manual(..., values)
Arguments
| ... | common discrete scale parameters: |
|---|---|
| values | a set of aesthetic values to map data values to. If this
is a named vector, then the values will be matched based on the names.
If unnamed, values will be matched in order (usually alphabetical) with
the limits of the scale. Any data values that don't match will be
given |
Examples
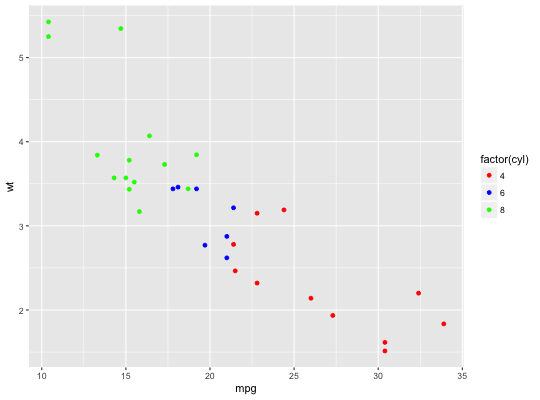
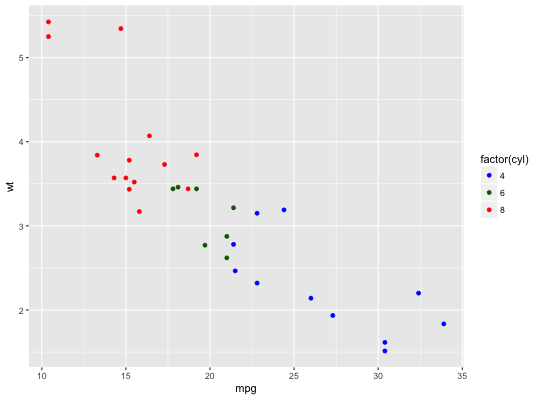
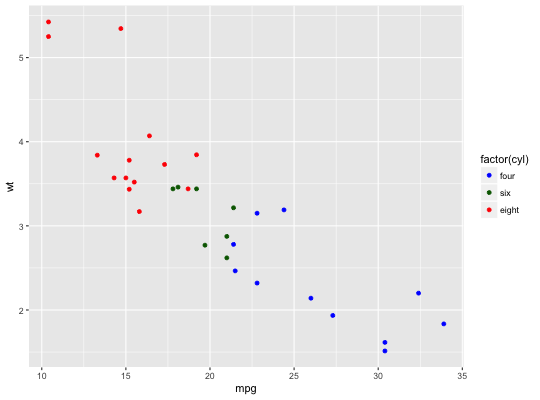
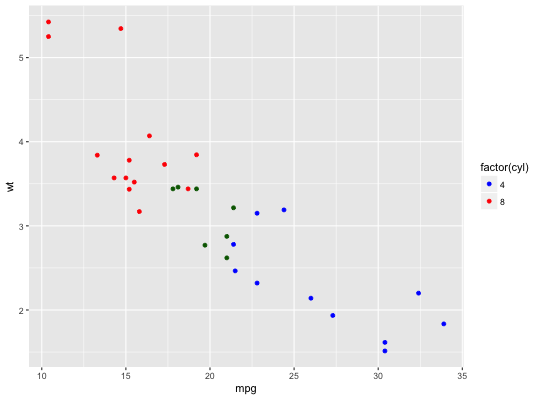
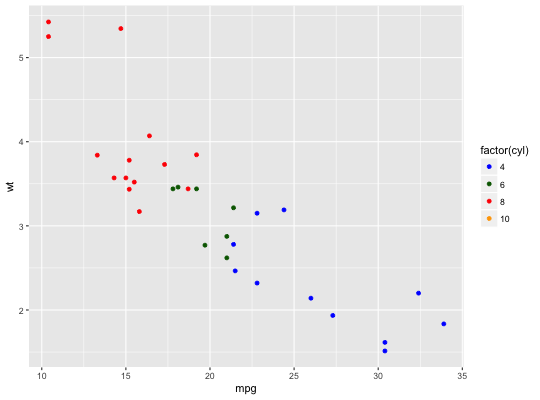
p <- ggplot(mtcars, aes(mpg, wt)) + geom_point(aes(colour = factor(cyl))) p + scale_colour_manual(values = c("red", "blue", "green"))# It's recommended to use a named vector cols <- c("8" = "red", "4" = "blue", "6" = "darkgreen", "10" = "orange") p + scale_colour_manual(values = cols)# As with other scales you can use breaks to control the appearance # of the legend. p + scale_colour_manual(values = cols)p + scale_colour_manual( values = cols, breaks = c("4", "6", "8"), labels = c("four", "six", "eight") )# And limits to control the possible values of the scale p + scale_colour_manual(values = cols, limits = c("4", "8"))p + scale_colour_manual(values = cols, limits = c("4", "6", "8", "10"))