<!-- Generated by pkgdown: do not edit by hand -->
<!DOCTYPE html>
<html>
  <head>
  <meta charset="utf-8">
<meta http-equiv="X-UA-Compatible" content="IE=edge">
<meta name="viewport" content="width=device-width, initial-scale=1.0">

<title>Compute function for each x value — stat_function • ggplot2</title>

<!-- jquery -->
<script src="https://code.jquery.com/jquery-3.1.0.min.js" integrity="sha384-nrOSfDHtoPMzJHjVTdCopGqIqeYETSXhZDFyniQ8ZHcVy08QesyHcnOUpMpqnmWq" crossorigin="anonymous"></script>

<!-- Bootstrap -->
<link href="../tidyverse.css" rel="stylesheet">
<script src="https://maxcdn.bootstrapcdn.com/bootstrap/3.3.7/js/bootstrap.min.js" integrity="sha384-Tc5IQib027qvyjSMfHjOMaLkfuWVxZxUPnCJA7l2mCWNIpG9mGCD8wGNIcPD7Txa" crossorigin="anonymous"></script>

<!-- Font Awesome icons -->
<link href="https://maxcdn.bootstrapcdn.com/font-awesome/4.6.3/css/font-awesome.min.css" rel="stylesheet" integrity="sha384-T8Gy5hrqNKT+hzMclPo118YTQO6cYprQmhrYwIiQ/3axmI1hQomh7Ud2hPOy8SP1" crossorigin="anonymous">

<!-- tidyverse -->
<link href="../pkgdown.css" rel="stylesheet">
<script src="../jquery.sticky-kit.min.js"></script>
<script src="../pkgdown.js"></script>

<!-- mathjax -->
<script src='https://cdn.mathjax.org/mathjax/latest/MathJax.js?config=TeX-AMS-MML_HTMLorMML'></script>

<!--[if lt IE 9]>
<script src="https://oss.maxcdn.com/html5shiv/3.7.3/html5shiv.min.js"></script>
<script src="https://oss.maxcdn.com/respond/1.4.2/respond.min.js"></script>
<![endif]-->
  </head>

  <body>
    <div class="container template-reference-topic">
      <header>
      <div class="navbar navbar-default navbar-fixed-top" role="navigation">
  <div class="container">
    <div class="navbar-header">
      <button type="button" class="navbar-toggle collapsed" data-toggle="collapse" data-target="#navbar">
        <span class="icon-bar"></span>
        <span class="icon-bar"></span>
        <span class="icon-bar"></span>
      </button>

      <div class="navbar-brand-container">
        <a class="navbar-brand" href="../index.html">ggplot2</a>
        <small class="tidyverse">part of the <a href="http://tidyverse.org">tidyverse</a></small>
      </div>
    </div>
    <div id="navbar" class="navbar-collapse collapse">
      <ul class="nav navbar-nav navbar-right">
        <li>
  <a href="../reference/index.html">Reference</a>
</li>
<li class="dropdown">
  <a href="#" class="dropdown-toggle" data-toggle="dropdown" role="button" aria-expanded="false">
    Articles
     
    <span class="caret"></span>
  </a>
  <ul class="dropdown-menu" role="menu">
    <li>
      <a href="../articles/ggplot2-specs.html">Aesthetic specifications</a>
    </li>
    <li>
      <a href="../articles/extending-ggplot2.html">Extending ggplot2</a>
    </li>
  </ul>
</li>
<li class="dropdown">
  <a href="#" class="dropdown-toggle" data-toggle="dropdown" role="button" aria-expanded="false">
    News
     
    <span class="caret"></span>
  </a>
  <ul class="dropdown-menu" role="menu">
    <li class="dropdown-header">Release notes</li>
    <li>
      <a href="../articles/releases/ggplot2-2.2.0.html">Version 2.2.0</a>
    </li>
    <li>
      <a href="../articles/releases/ggplot2-2.1.0.html">Version 2.1.0</a>
    </li>
    <li>
      <a href="../articles/releases/ggplot2-2.0.0.html">Version 2.0.0</a>
    </li>
    <li>
      <a href="../articles/releases/ggplot2-1.0.0.html">Version 1.0.0</a>
    </li>
    <li class="divider"></li>
    <li>
      <a href="../news/index.html">Change log</a>
    </li>
  </ul>
</li>
        <li>
  <a href="https://github.com/tidyverse/ggplot2">
    <span class="fa fa-github fa-lg"></span>
     
  </a>
</li>
      </ul>
    </div><!--/.nav-collapse -->
  </div><!--/.container -->
</div><!--/.navbar -->

      
      </header>

<div class="row">
  <div class="col-md-9 contents">
    <div class="page-header">
    <h1>Compute function for each x value</h1>
    <small class="dont-index">Source: <a href='https://github.com/tidyverse/ggplot2/blob/master/R/stat-function.r'><code>R/stat-function.r</code></a></small>
    <div class="hidden name"><code>stat_function.Rd</code></div>
    </div>

    <div class="ref-description">
    
    <p>This stat makes it easy to superimpose a function on top of an existing
plot. The function is called with a grid of evenly spaced values along
the x axis, and the results are drawn (by default) with a line.</p>
    
    </div>

    <pre class="usage"><span class='fu'>stat_function</span>(<span class='kw'>mapping</span> <span class='kw'>=</span> <span class='kw'>NULL</span>, <span class='kw'>data</span> <span class='kw'>=</span> <span class='kw'>NULL</span>, <span class='kw'>geom</span> <span class='kw'>=</span> <span class='st'>"path"</span>,
  <span class='kw'>position</span> <span class='kw'>=</span> <span class='st'>"identity"</span>, <span class='no'>...</span>, <span class='no'>fun</span>, <span class='kw'>xlim</span> <span class='kw'>=</span> <span class='kw'>NULL</span>, <span class='kw'>n</span> <span class='kw'>=</span> <span class='fl'>101</span>, <span class='kw'>args</span> <span class='kw'>=</span> <span class='fu'>list</span>(),
  <span class='kw'>na.rm</span> <span class='kw'>=</span> <span class='fl'>FALSE</span>, <span class='kw'>show.legend</span> <span class='kw'>=</span> <span class='fl'>NA</span>, <span class='kw'>inherit.aes</span> <span class='kw'>=</span> <span class='fl'>TRUE</span>)</pre>
    
    <h2 class="hasAnchor" id="arguments"><a class="anchor" href="#arguments"></a>Arguments</h2>
    <table class="ref-arguments">
    <colgroup><col class="name" /><col class="desc" /></colgroup>
    <tr>
      <th>mapping</th>
      <td><p>Set of aesthetic mappings created by <code><a href='aes.html'>aes()</a></code> or
<code><a href='aes_.html'>aes_()</a></code>. If specified and <code>inherit.aes = TRUE</code> (the
default), it is combined with the default mapping at the top level of the
plot. You must supply <code>mapping</code> if there is no plot mapping.</p></td>
    </tr>
    <tr>
      <th>data</th>
      <td><p>The data to be displayed in this layer. There are three
options:</p>
<p>If <code>NULL</code>, the default, the data is inherited from the plot
data as specified in the call to <code><a href='ggplot.html'>ggplot()</a></code>.</p>
<p>A <code>data.frame</code>, or other object, will override the plot
data. All objects will be fortified to produce a data frame. See
<code><a href='fortify.html'>fortify()</a></code> for which variables will be created.</p>
<p>A <code>function</code> will be called with a single argument,
the plot data. The return value must be a <code>data.frame.</code>, and
will be used as the layer data.</p></td>
    </tr>
    <tr>
      <th>geom</th>
      <td><p>The geometric object to use display the data</p></td>
    </tr>
    <tr>
      <th>position</th>
      <td><p>Position adjustment, either as a string, or the result of
a call to a position adjustment function.</p></td>
    </tr>
    <tr>
      <th>...</th>
      <td><p>Other arguments passed on to <code><a href='layer.html'>layer()</a></code>. These are
often aesthetics, used to set an aesthetic to a fixed value, like
<code>color = "red"</code> or <code>size = 3</code>. They may also be parameters
to the paired geom/stat.</p></td>
    </tr>
    <tr>
      <th>fun</th>
      <td><p>function to use. Must be vectorised.</p></td>
    </tr>
    <tr>
      <th>xlim</th>
      <td><p>Optionally, restrict the range of the function to this range.</p></td>
    </tr>
    <tr>
      <th>n</th>
      <td><p>number of points to interpolate along</p></td>
    </tr>
    <tr>
      <th>args</th>
      <td><p>list of additional arguments to pass to <code>fun</code></p></td>
    </tr>
    <tr>
      <th>na.rm</th>
      <td><p>If <code>FALSE</code>, the default, missing values are removed with
a warning. If <code>TRUE</code>, missing values are silently removed.</p></td>
    </tr>
    <tr>
      <th>show.legend</th>
      <td><p>logical. Should this layer be included in the legends?
<code>NA</code>, the default, includes if any aesthetics are mapped.
<code>FALSE</code> never includes, and <code>TRUE</code> always includes.
It can also be a named logical vector to finely select the aesthetics to
display.</p></td>
    </tr>
    <tr>
      <th>inherit.aes</th>
      <td><p>If <code>FALSE</code>, overrides the default aesthetics,
rather than combining with them. This is most useful for helper functions
that define both data and aesthetics and shouldn't inherit behaviour from
the default plot specification, e.g. <code><a href='borders.html'>borders()</a></code>.</p></td>
    </tr>
    </table>
    
    <h2 class="hasAnchor" id="aesthetics"><a class="anchor" href="#aesthetics"></a>Aesthetics</h2>

    
    <p><code>stat_function</code> understands the following aesthetics (required aesthetics are in bold):</p><ul>
<li><p><code>group</code></p></li>
<li><p><code>y</code></p></li>
</ul><p>Learn more about setting these aesthetics in <code><a href='../articles/ggplot2-specs.html'>vignette("ggplot2-specs")</a></code></p>
    
    <h2 class="hasAnchor" id="computed-variables"><a class="anchor" href="#computed-variables"></a>Computed variables</h2>

    
    <dl class='dl-horizontal'>
<dt>x</dt><dd><p>x's along a grid</p></dd>
<dt>y</dt><dd><p>value of function evaluated at corresponding x
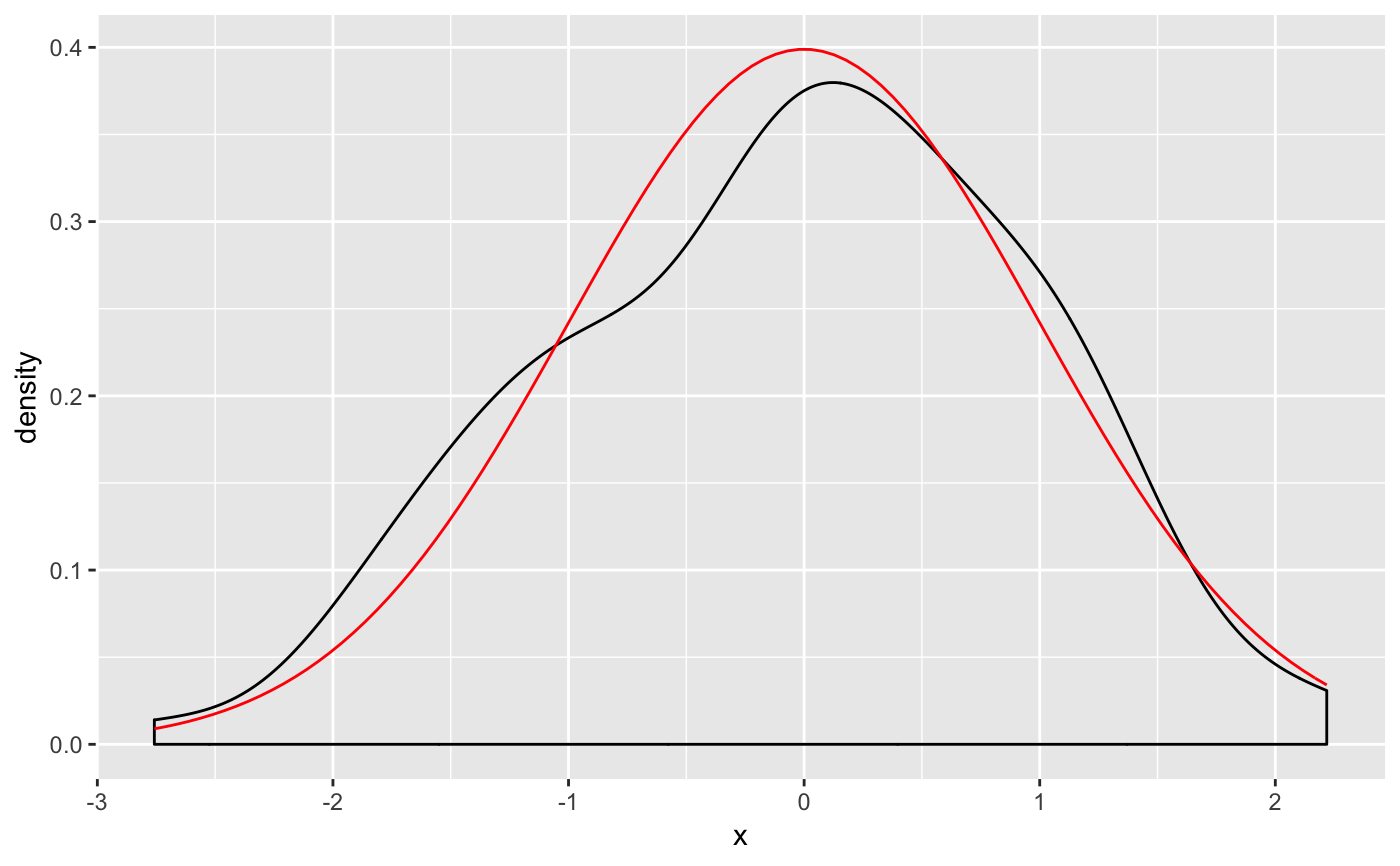
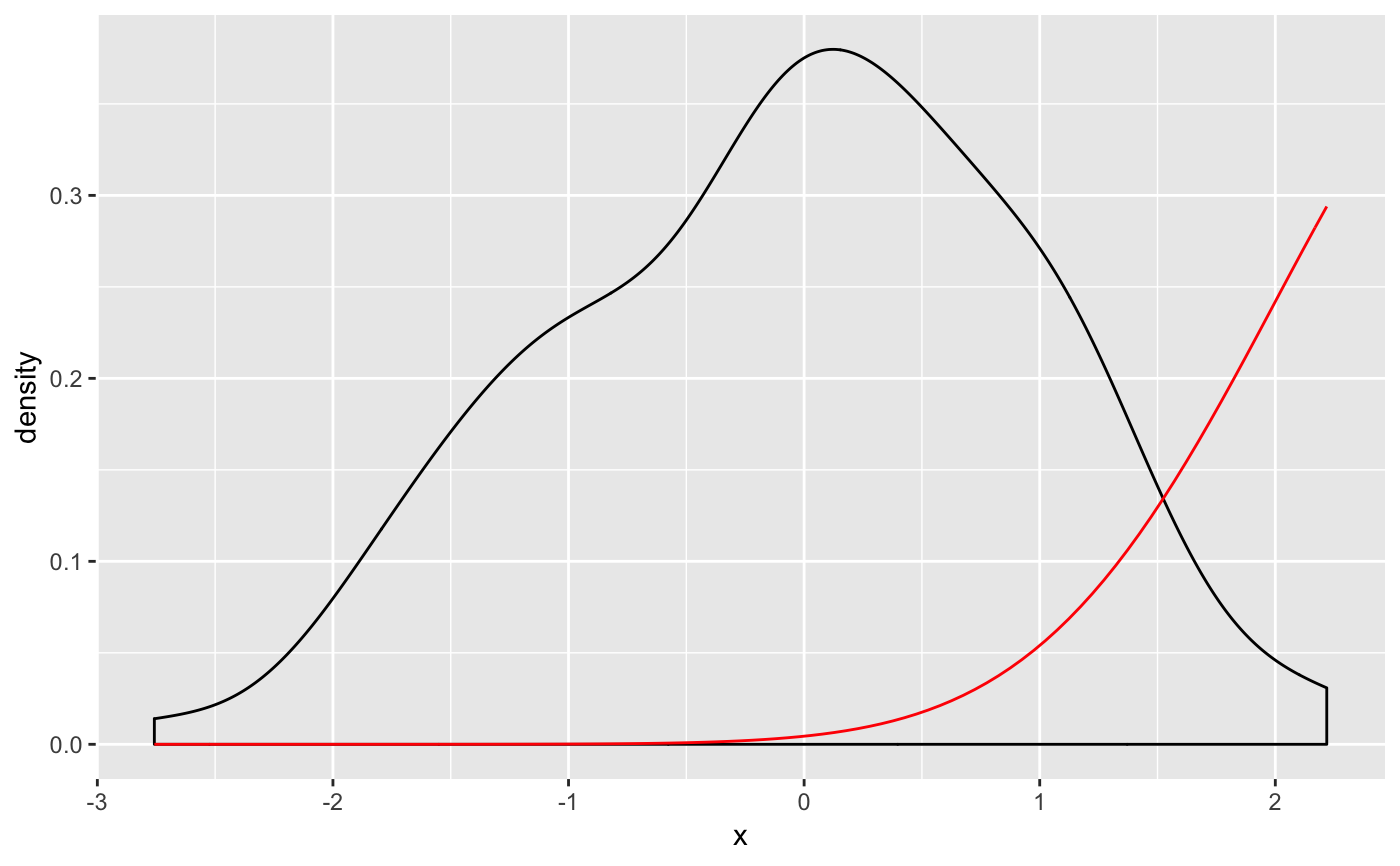
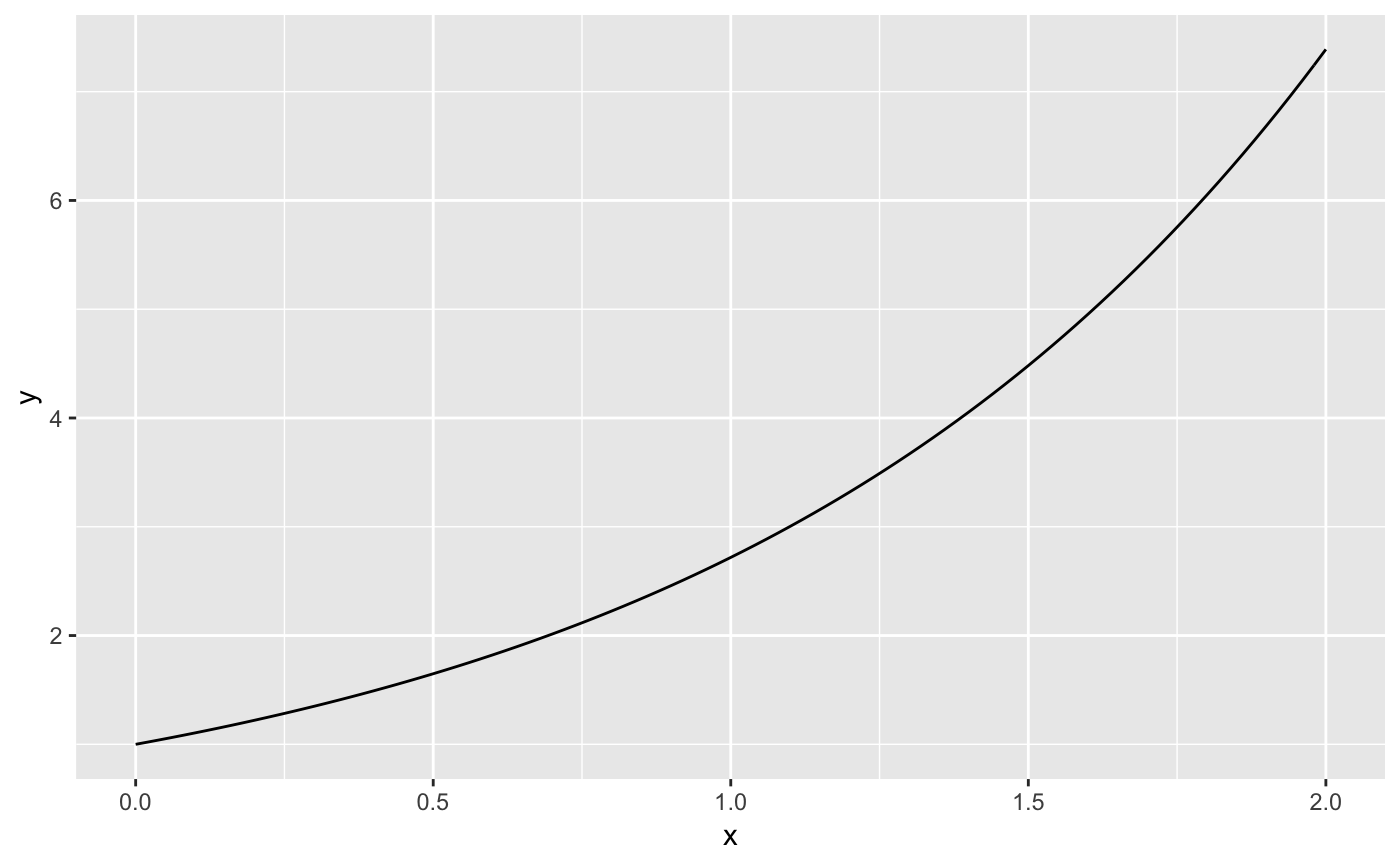
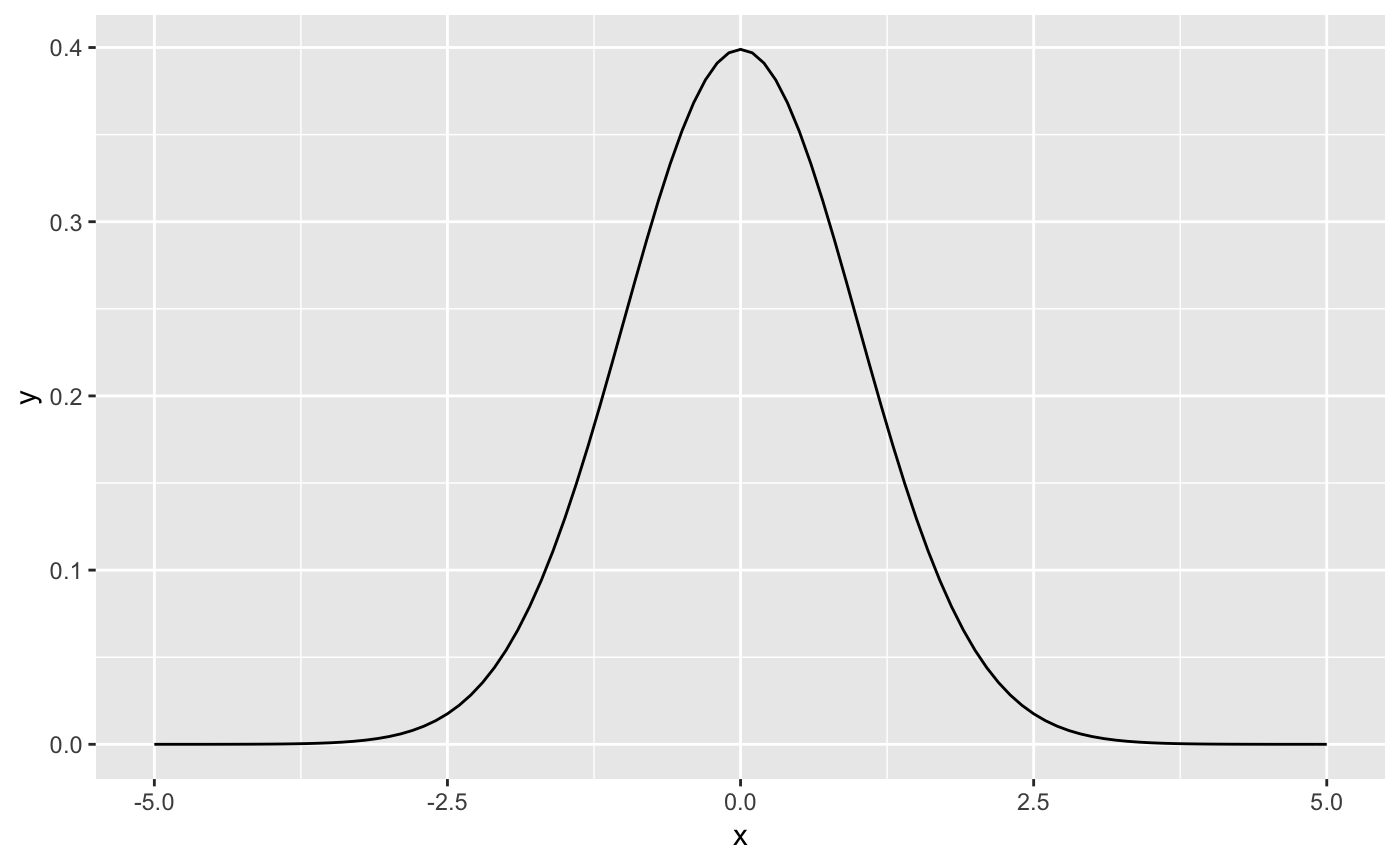
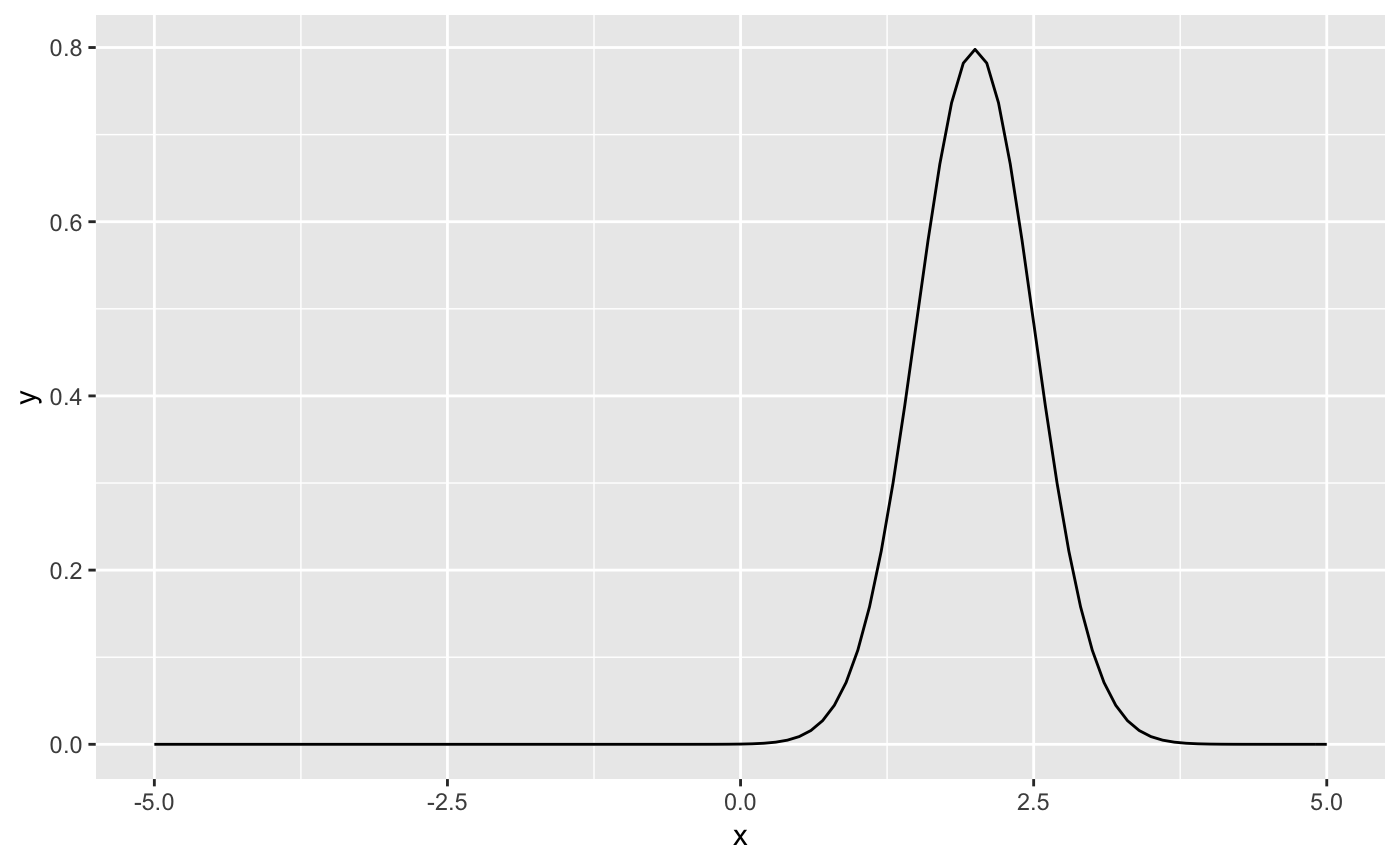
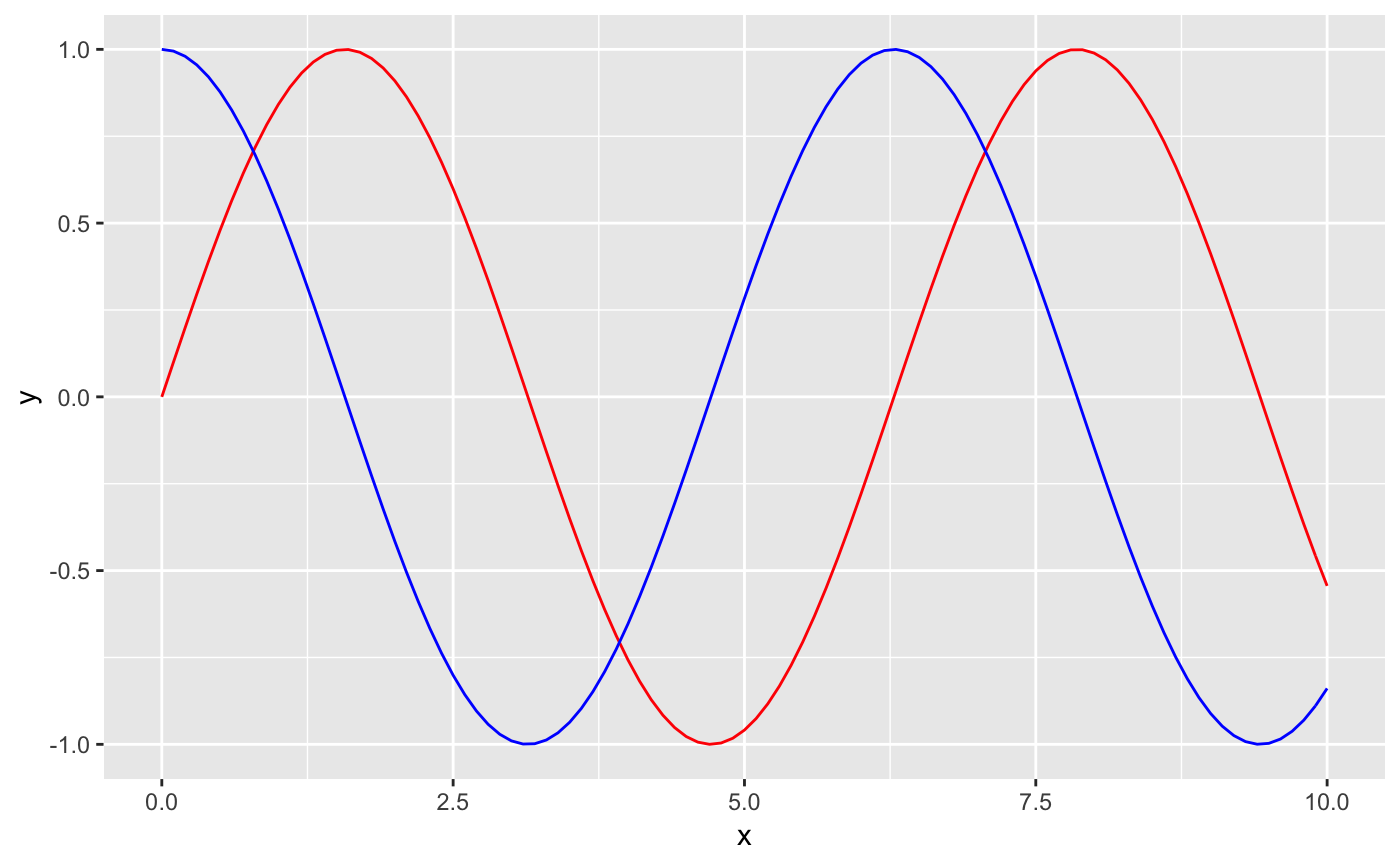
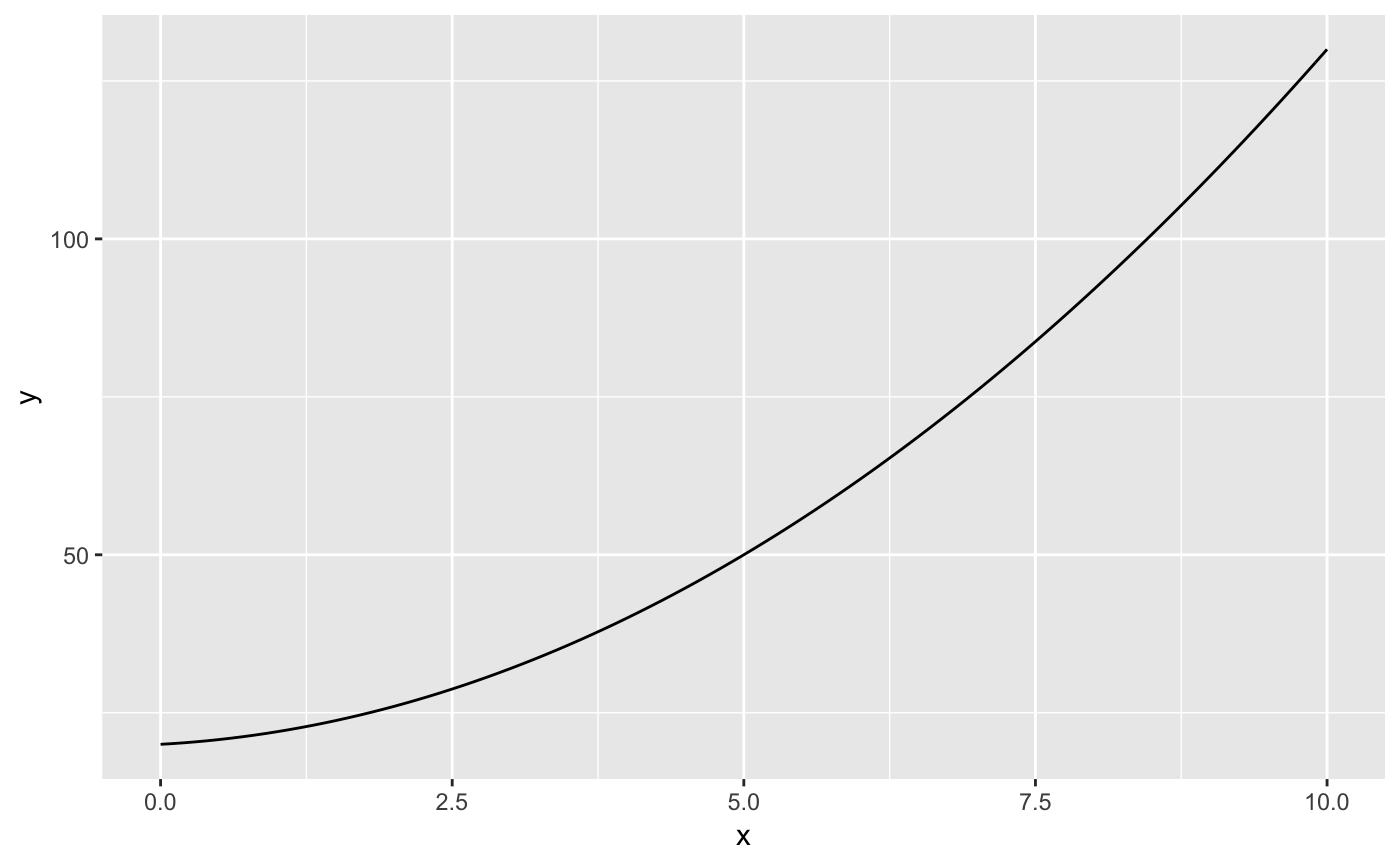
</p></dd>
</dl>
    

    <h2 class="hasAnchor" id="examples"><a class="anchor" href="#examples"></a>Examples</h2>
    <pre class="examples"><div class='input'><span class='fu'>set.seed</span>(<span class='fl'>1492</span>)
<span class='no'>df</span> <span class='kw'>&lt;-</span> <span class='fu'>data.frame</span>(
  <span class='kw'>x</span> <span class='kw'>=</span> <span class='fu'>rnorm</span>(<span class='fl'>100</span>)
)
<span class='no'>x</span> <span class='kw'>&lt;-</span> <span class='no'>df</span>$<span class='no'>x</span>
<span class='no'>base</span> <span class='kw'>&lt;-</span> <span class='fu'><a href='ggplot.html'>ggplot</a></span>(<span class='no'>df</span>, <span class='fu'><a href='aes.html'>aes</a></span>(<span class='no'>x</span>)) + <span class='fu'><a href='geom_density.html'>geom_density</a></span>()
<span class='no'>base</span> + <span class='fu'>stat_function</span>(<span class='kw'>fun</span> <span class='kw'>=</span> <span class='no'>dnorm</span>, <span class='kw'>colour</span> <span class='kw'>=</span> <span class='st'>"red"</span>)</div><div class='img'><img src='stat_function-1.png' alt='' width='700' height='433' /></div><div class='input'><span class='no'>base</span> + <span class='fu'>stat_function</span>(<span class='kw'>fun</span> <span class='kw'>=</span> <span class='no'>dnorm</span>, <span class='kw'>colour</span> <span class='kw'>=</span> <span class='st'>"red"</span>, <span class='kw'>args</span> <span class='kw'>=</span> <span class='fu'>list</span>(<span class='kw'>mean</span> <span class='kw'>=</span> <span class='fl'>3</span>))</div><div class='img'><img src='stat_function-2.png' alt='' width='700' height='433' /></div><div class='input'>
<span class='co'># Plot functions without data</span>
<span class='co'># Examples adapted from Kohske Takahashi</span>

<span class='co'># Specify range of x-axis</span>
<span class='fu'><a href='ggplot.html'>ggplot</a></span>(<span class='fu'>data.frame</span>(<span class='kw'>x</span> <span class='kw'>=</span> <span class='fu'>c</span>(<span class='fl'>0</span>, <span class='fl'>2</span>)), <span class='fu'><a href='aes.html'>aes</a></span>(<span class='no'>x</span>)) +
  <span class='fu'>stat_function</span>(<span class='kw'>fun</span> <span class='kw'>=</span> <span class='no'>exp</span>, <span class='kw'>geom</span> <span class='kw'>=</span> <span class='st'>"line"</span>)</div><div class='img'><img src='stat_function-3.png' alt='' width='700' height='433' /></div><div class='input'>
<span class='co'># Plot a normal curve</span>
<span class='fu'><a href='ggplot.html'>ggplot</a></span>(<span class='fu'>data.frame</span>(<span class='kw'>x</span> <span class='kw'>=</span> <span class='fu'>c</span>(-<span class='fl'>5</span>, <span class='fl'>5</span>)), <span class='fu'><a href='aes.html'>aes</a></span>(<span class='no'>x</span>)) + <span class='fu'>stat_function</span>(<span class='kw'>fun</span> <span class='kw'>=</span> <span class='no'>dnorm</span>)</div><div class='img'><img src='stat_function-4.png' alt='' width='700' height='433' /></div><div class='input'>
<span class='co'># To specify a different mean or sd, use the args parameter to supply new values</span>
<span class='fu'><a href='ggplot.html'>ggplot</a></span>(<span class='fu'>data.frame</span>(<span class='kw'>x</span> <span class='kw'>=</span> <span class='fu'>c</span>(-<span class='fl'>5</span>, <span class='fl'>5</span>)), <span class='fu'><a href='aes.html'>aes</a></span>(<span class='no'>x</span>)) +
  <span class='fu'>stat_function</span>(<span class='kw'>fun</span> <span class='kw'>=</span> <span class='no'>dnorm</span>, <span class='kw'>args</span> <span class='kw'>=</span> <span class='fu'>list</span>(<span class='kw'>mean</span> <span class='kw'>=</span> <span class='fl'>2</span>, <span class='kw'>sd</span> <span class='kw'>=</span> <span class='fl'>.5</span>))</div><div class='img'><img src='stat_function-5.png' alt='' width='700' height='433' /></div><div class='input'>
<span class='co'># Two functions on the same plot</span>
<span class='no'>f</span> <span class='kw'>&lt;-</span> <span class='fu'><a href='ggplot.html'>ggplot</a></span>(<span class='fu'>data.frame</span>(<span class='kw'>x</span> <span class='kw'>=</span> <span class='fu'>c</span>(<span class='fl'>0</span>, <span class='fl'>10</span>)), <span class='fu'><a href='aes.html'>aes</a></span>(<span class='no'>x</span>))
<span class='no'>f</span> + <span class='fu'>stat_function</span>(<span class='kw'>fun</span> <span class='kw'>=</span> <span class='no'>sin</span>, <span class='kw'>colour</span> <span class='kw'>=</span> <span class='st'>"red"</span>) +
  <span class='fu'>stat_function</span>(<span class='kw'>fun</span> <span class='kw'>=</span> <span class='no'>cos</span>, <span class='kw'>colour</span> <span class='kw'>=</span> <span class='st'>"blue"</span>)</div><div class='img'><img src='stat_function-6.png' alt='' width='700' height='433' /></div><div class='input'>
<span class='co'># Using a custom function</span>
<span class='no'>test</span> <span class='kw'>&lt;-</span> <span class='kw'>function</span>(<span class='no'>x</span>) {<span class='no'>x</span> ^ <span class='fl'>2</span> + <span class='no'>x</span> + <span class='fl'>20</span>}
<span class='no'>f</span> + <span class='fu'>stat_function</span>(<span class='kw'>fun</span> <span class='kw'>=</span> <span class='no'>test</span>)</div><div class='img'><img src='stat_function-7.png' alt='' width='700' height='433' /></div></pre>
  </div>
  <div class="col-md-3 hidden-xs hidden-sm" id="sidebar">
    <h2>Contents</h2>
    <ul class="nav nav-pills nav-stacked">
      <li><a href="#arguments">Arguments</a></li>
      
      <li><a href="#aesthetics">Aesthetics</a></li>

      <li><a href="#computed-variables">Computed variables</a></li>
      
      <li><a href="#examples">Examples</a></li>
    </ul>

  </div>
</div>

      <footer>
      <div class="tidyverse">
  <p>ggplot2 is a part of the <strong>tidyverse</strong>, an ecosystem of packages designed with common APIs and a shared philosophy. Learn more at <a href="http://tidyverse.org">tidyverse.org</a>.</p>
</div>

<div class="author">
  <p>Developed by <a href='http://hadley.nz'>Hadley Wickham</a>, Winston Chang, Lionel Henry, Thomas Lin Pedersen, Kohske Takahashi, Claus Wilke, Kara Woo.</p>
  <p>Site built by <a href="http://pkgdown.r-lib.org">pkgdown</a>.</p>
</div>

<script async src="https://www.googletagmanager.com/gtag/js?id=UA-115082821-1"></script>
<script>
 window.dataLayer = window.dataLayer || [];
 function gtag(){dataLayer.push(arguments);}
 gtag('js', new Date());

 gtag('config', 'UA-115082821-1');
</script>
      </footer>
   </div>


  </body>
</html>