# Hearth
**One-pane-of-glass monitoring for your home AI compute cluster.**
A self-hosted observability dashboard for people who run LLMs at home — one box or many.
vLLM, llama.cpp, SGLang, Ollama, LiteLLM gateway — auto-discovered, real metrics, honestly labeled.
[](LICENSE)
[](#status)
**English** · [简体中文](README.zh-CN.md) · [繁體中文](README.zh-TW.md)
## Why Hearth
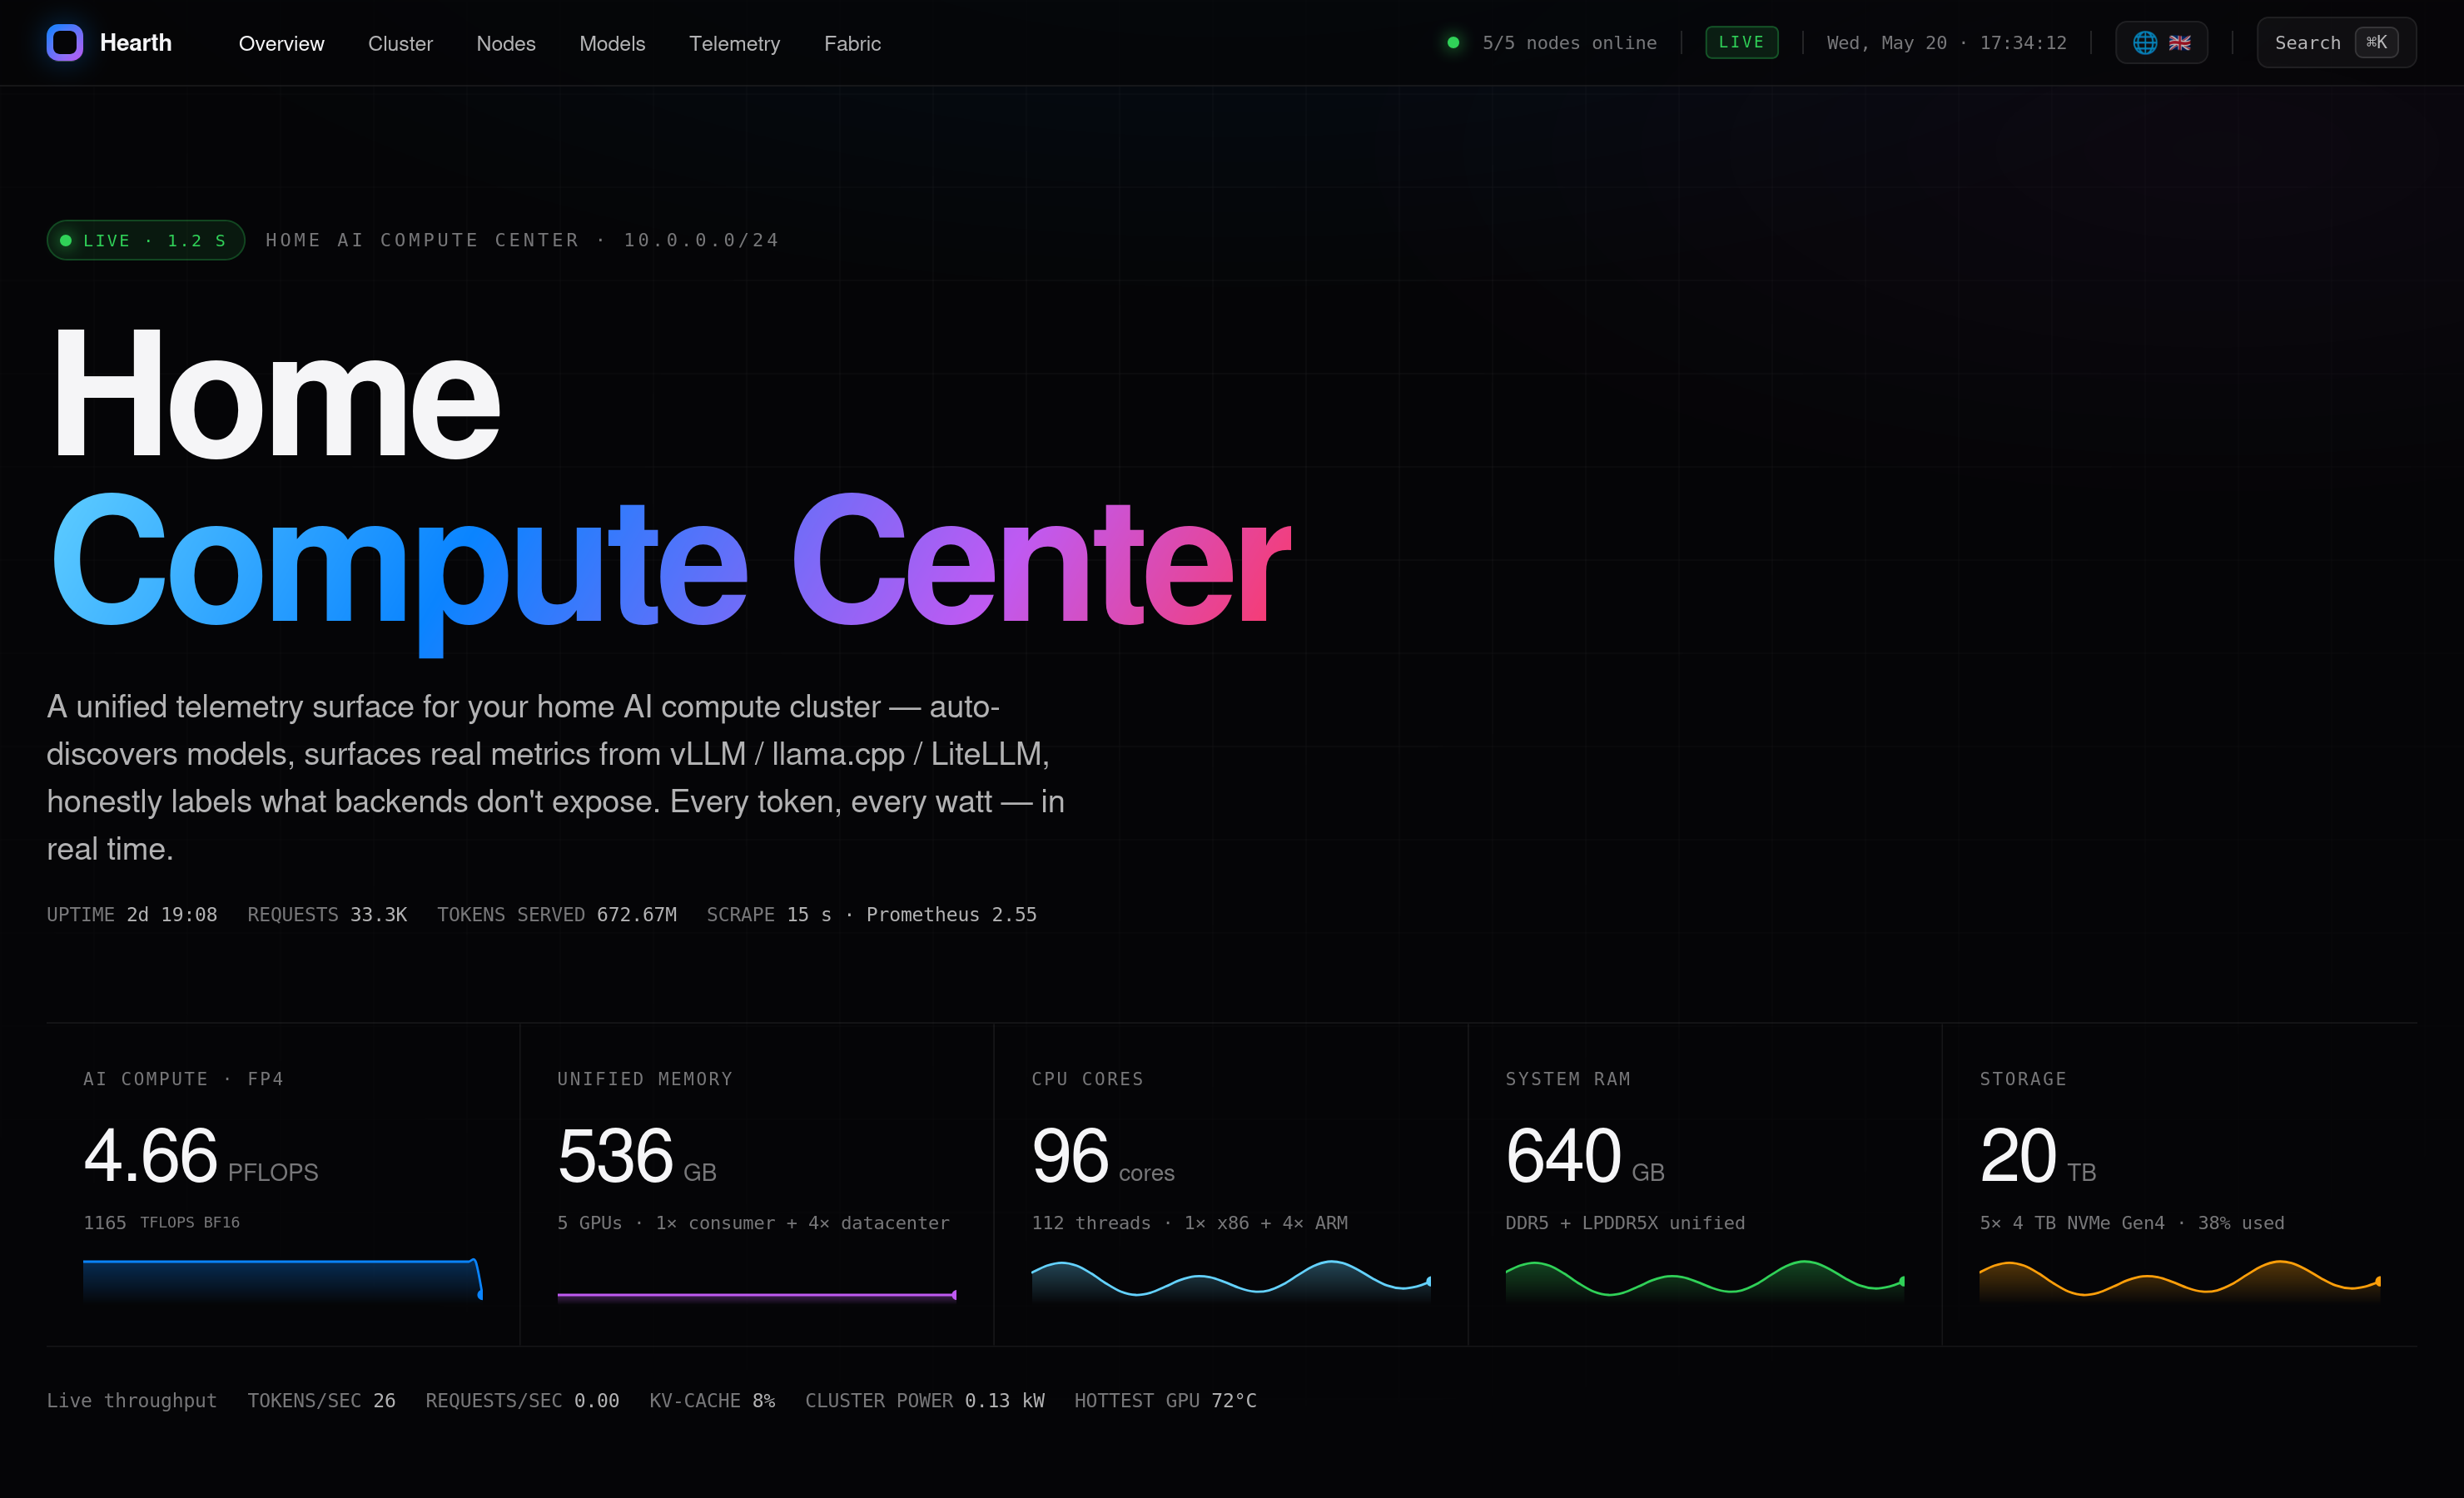
Most home-lab monitoring is **either** generic (Grafana / Netdata — great at host metrics, blind to LLM serving) **or** LLM-specific but cloud-first (Phoenix, LangSmith). Hearth sits at the intersection: **one dashboard that knows both your hosts and your models**, designed for the kind of person who runs DeepSeek / Qwen / Gemma on their own GPUs at home.
The visual language is deliberately **Apple Pro Display console**: deep black, tabular numerals, ring gauges, subtle borders. Not because it's trendy, but because density + restraint is the right grammar for telemetry you'll glance at fifty times a day.
---
## What it is
Hearth shows you, in one place:
- **Your nodes** — GPU / VRAM / CPU / RAM / temps / power, real-time
- **Your models** — which are serving, throughput (t/s), TTFT, TPOT, KV-cache, p50/p95/p99 — auto-discovered from your LiteLLM gateway, vLLM, or llama.cpp `/metrics`
- **Your gateway traffic** — recent requests, errors, latencies (reads LiteLLM's OSS Postgres `SpendLogs` directly — no enterprise license needed)
- **Your training runs** — loss curve, step / ETA, throughput, plus per-rank GPU, collective-interconnect bandwidth, straggler skew, and a silent-stall (hung-collective) heuristic. The training signal is auto-detected from TensorBoard event files, a Prometheus textfile/endpoint, or a metrics JSON — read-only, zero impact on the run
- **Honest gaps** — when a backend doesn't expose a metric (e.g. llama.cpp has no TTFT histogram), it shows `—`, not a fake number
Designed for the **home compute cluster** target: 1 to ~10 nodes, mixed GPUs, mixed serving frameworks, possibly behind a LiteLLM gateway. Single-machine setup works too.
## Status
🏗️ **Alpha — under active development.**
This project was originally built as a personal monitor for a 5-node home cluster and is being progressively generalized for general home-lab use. Configuration is being moved from hard-coded constants to declarative YAML. See [`CHANGELOG.md`](CHANGELOG.md) and the roadmap below.
`v0.1.0-alpha` is shipped — configuration as data is in, the 5-node upstream cluster has been re-verified end-to-end against a YAML config. APIs (`/api/nodes`, `/api/models`, `/api/cluster`) return identical results to the hardcoded reference. Welcome to try it; expect rough edges on edge-case topologies until `v0.2.0` adds the adapter plugin layer.
## Quick start
> **Prerequisites:** Docker + Docker Compose on the host that will run Hearth. Optional: Prometheus + DCGM exporter on each GPU node (Hearth degrades gracefully if absent).
```bash
git clone https://github.com/tonyliu312/hearth.git
cd hearth/server
cp .env.example .env # edit secrets (LiteLLM master key, etc.)
docker compose up -d
open http://localhost:8080
```
For multi-node configuration, see [`docs/topology.md`](docs/topology.md) (coming in v0.1.0 / P1).
## Features
- 📊 **Real metrics, no fakes** — every number shown is sourced from a real backend; missing data is honestly labeled
- 🔌 **Auto-discovery** — models, backends, and their up/down state are discovered from the LiteLLM gateway `/health` + direct backend probes (resilient if gateway flaps)
- 🏋️ **Training observability** — distributed runs, not just inference: loss / grad-norm / step→ETA, per-rank skew, collective-interconnect throughput, and silent-stall detection (the classic hung-collective failure where GPUs read 100% util while making zero progress). Signal source is auto-detected across TensorBoard / Prometheus / JSON, so any trainer that writes one of them works — see [`docs/training-observability.md`](docs/training-observability.md)
- 🌍 **Multi-language** — English, 简体中文, 繁體中文 (PRs welcome for more)
- 📱 **Mobile-friendly** — responsive layout, mobile hamburger nav
- 🎨 **Apple-style aesthetic** — dark theme, tabular numerals, subtle borders
- 🔐 **Read-only by design** — no model control, no production impact (you keep using your existing tools to manage models)
## What it monitors (out of the box)
| Backend / source | Today | Metrics | OSS user fit |
|---|---|---|---|
| **vLLM** `/metrics` | ✅ Full | tps · TTFT · TPOT · KV% · p50/p95/p99 · running · waiting · resident | 🟢 Drop-in |
| **llama.cpp** `/metrics` | ✅ Partial (upstream limit) | tps · TPOT · running · waiting (TTFT / KV / p* not exposed by upstream — shown as `—`) | 🟢 Drop-in |
| **LiteLLM gateway** `/health` + `/model/info` | ✅ Auto-discovery | Model list, up/down, route → backend | 🟢 Drop-in |
| **LiteLLM gateway** `LiteLLM_SpendLogs` Postgres | ✅ Read-only SELECT | Per-request log: model, status, latency, tokens | 🟢 Drop-in |
| **Gateway-healthy, no `/metrics`** | ✅ Honest "online" | State only, no fake numbers | 🟢 Drop-in |
| **node_exporter + dcgm-exporter** (Prometheus) | ✅ Via your obs stack | CPU · RAM · GPU util · VRAM · network · disk · temps · power | 🟢 Drop-in |
| **SGLang** `sglang:*` | ✅ Full *(untested-live)* | tps · TTFT · TPOT · KV% · p50/p95/p99 · running · waiting | 🟢 Drop-in — report if metric names differ in your version |
| **Ollama** native | 🟡 OS-level only | Per-model metrics absent (Ollama doesn't ship `/metrics`) | 🟡 v0.2.0 adapter OR put Ollama behind LiteLLM |
| **Training signal** — TensorBoard `*.tfevents` · Prometheus textfile/endpoint · metrics JSON | ✅ Auto-detect, zero-dep parser | loss · grad-norm · lr · step/total · epoch · ETA · s-it — normalized across all three sources | 🟢 Drop-in — any trainer that writes one of the three (PyTorch / HF / Lightning / Keras / custom exporter) |
| **Distributed-training substrate** (DCGM + node_exporter) | ✅ Via your obs stack | Per-rank GPU · unified-memory headroom · RoCE/InfiniBand collective bandwidth · straggler skew · silent-stall heuristic | 🟢 Drop-in |
| **Alert push** (ntfy / Telegram / Discord / Slack / webhook) | ✅ fire + resolve | node-down / overheat / mem / disk / gateway-errors → your phone, transition-only (no spam) | 🟢 Drop-in · see [`docs/alerts.md`](docs/alerts.md) |
> **alpha reality check**: best fit today is *LiteLLM gateway + vLLM and/or llama.cpp + node_exporter + dcgm-exporter*. That's how Hearth was developed and tested. Other configurations work but with the caveats above.
**New here?** Read [`docs/getting-started.md`](docs/getting-started.md) — 5-min walkthrough from `git clone` to a running dashboard, including common gotchas.
Adding a new backend type = one adapter file. See [`docs/adapters.md`](docs/adapters.md) (stub; full guide in v0.2.0).
## Screenshots
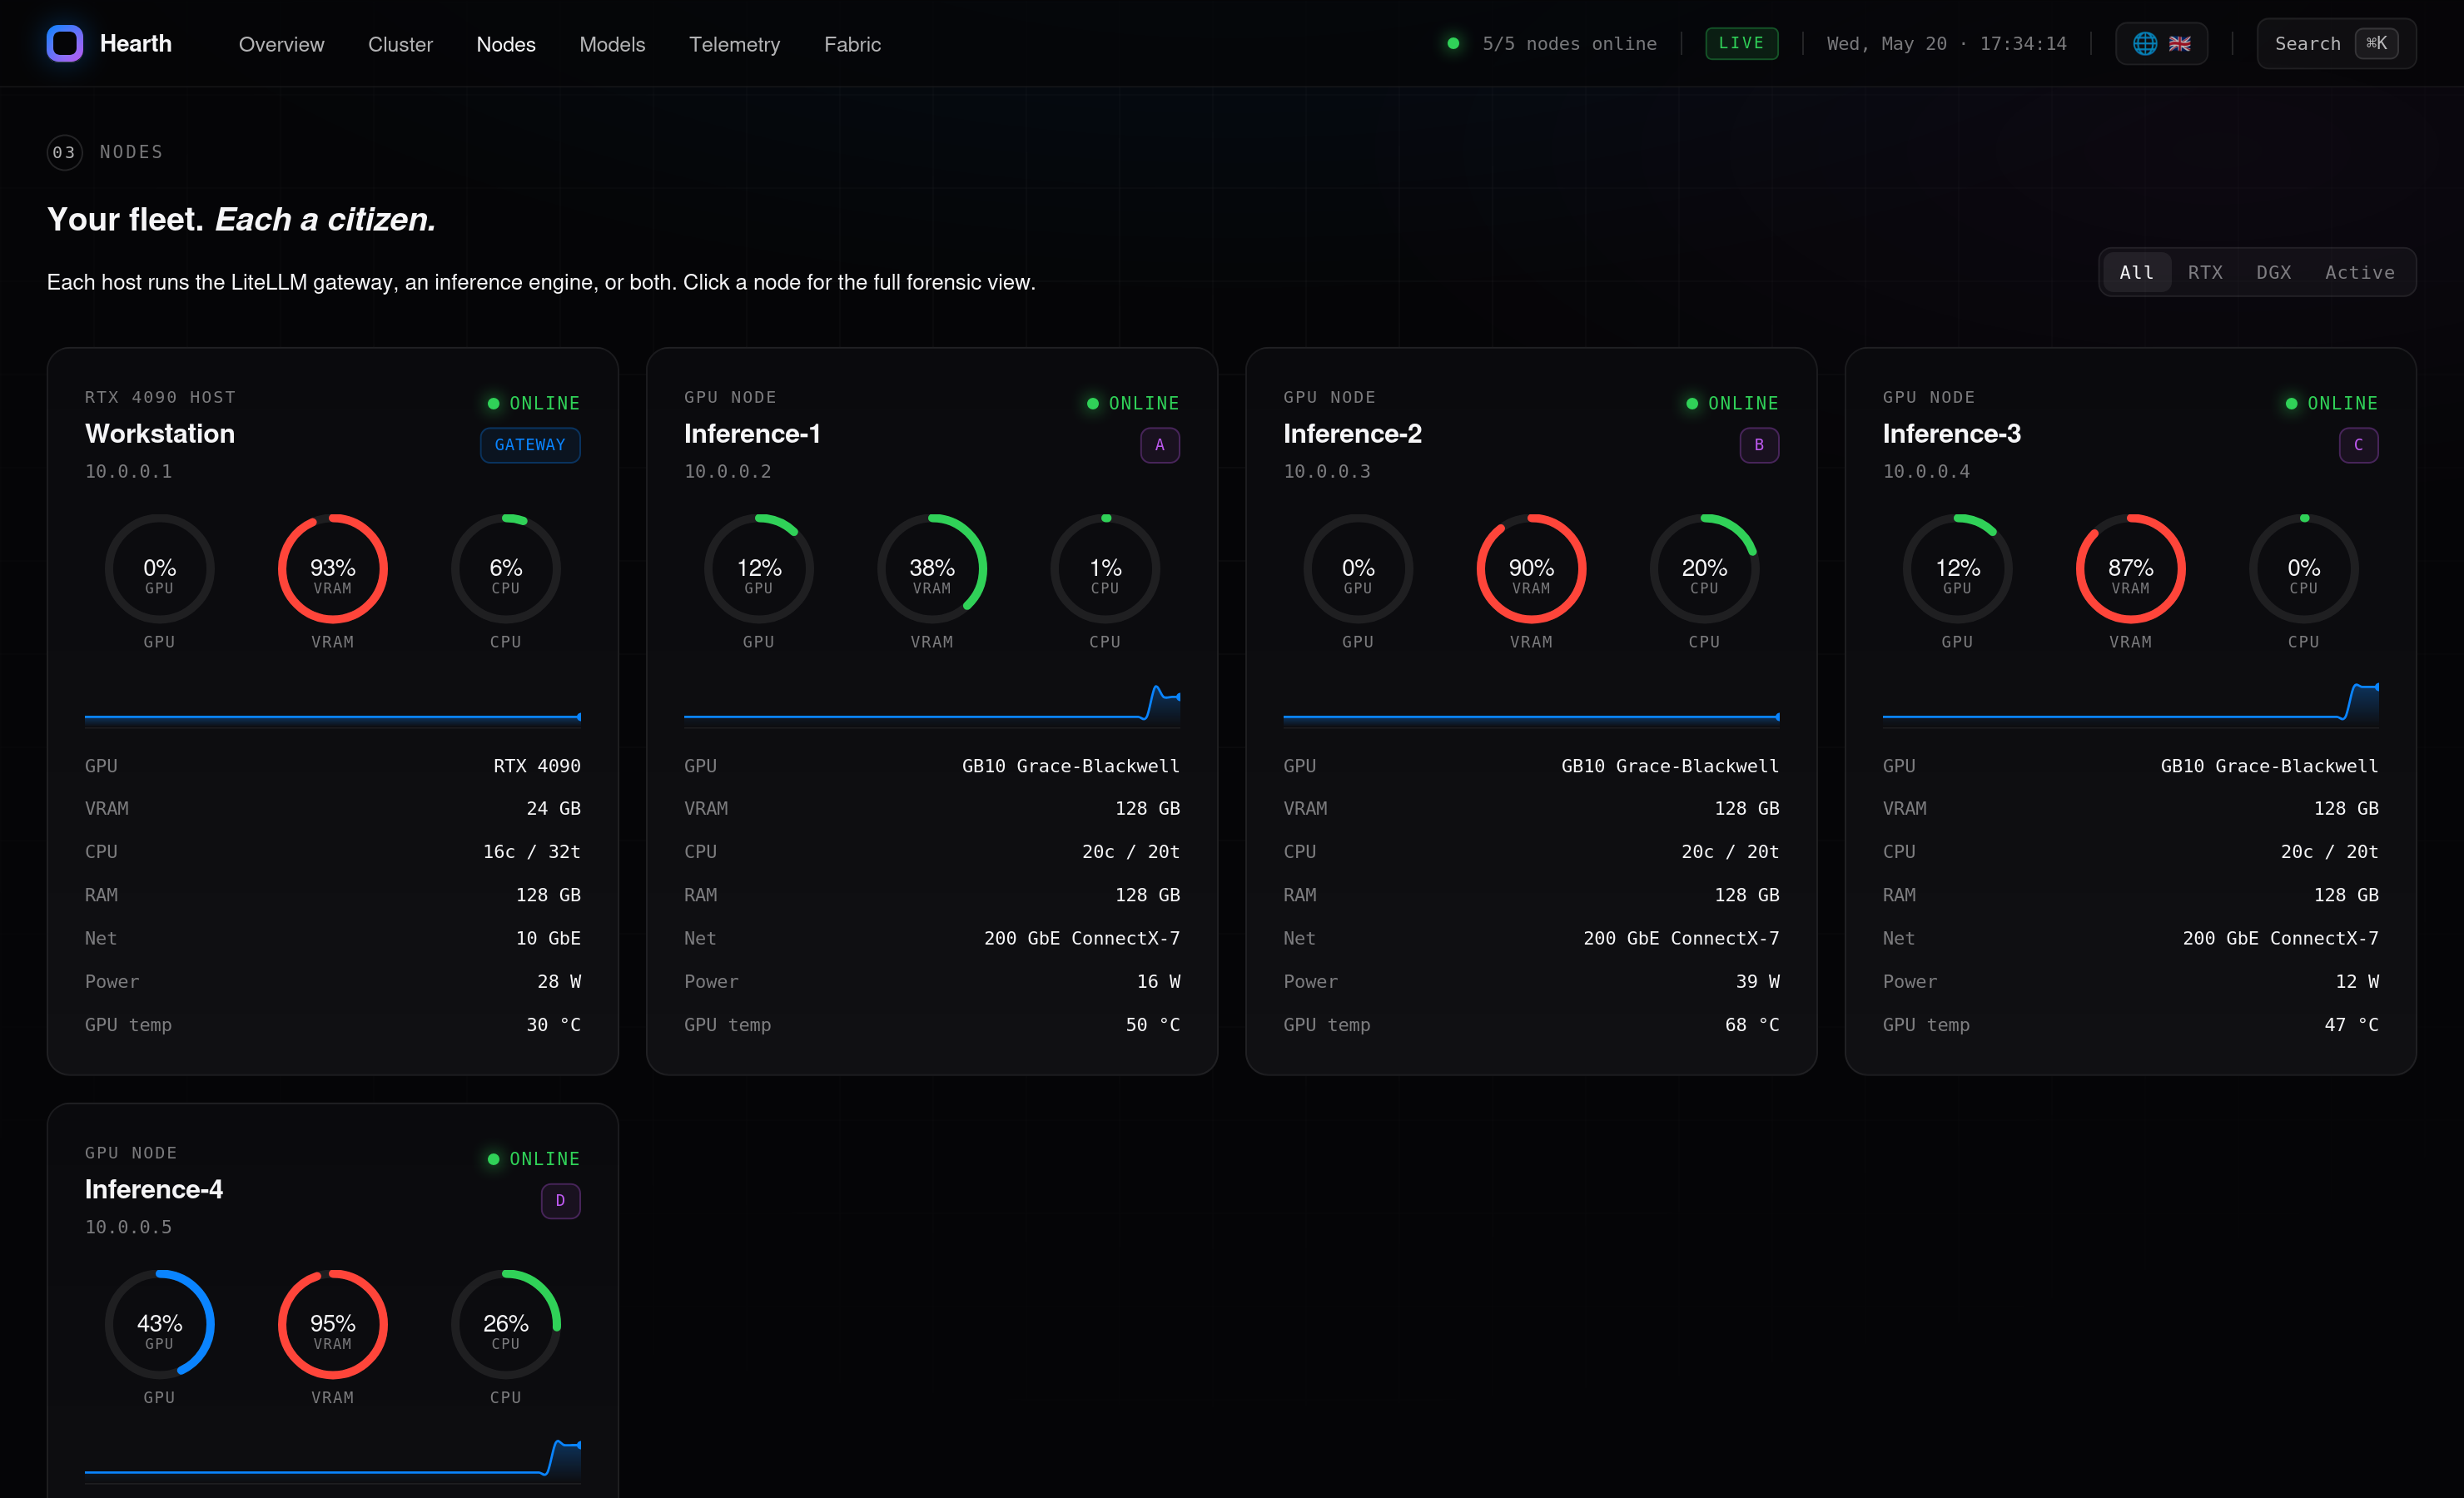 Nodes — GPU / VRAM / CPU rings, hardware fingerprint, live temps & power per host |
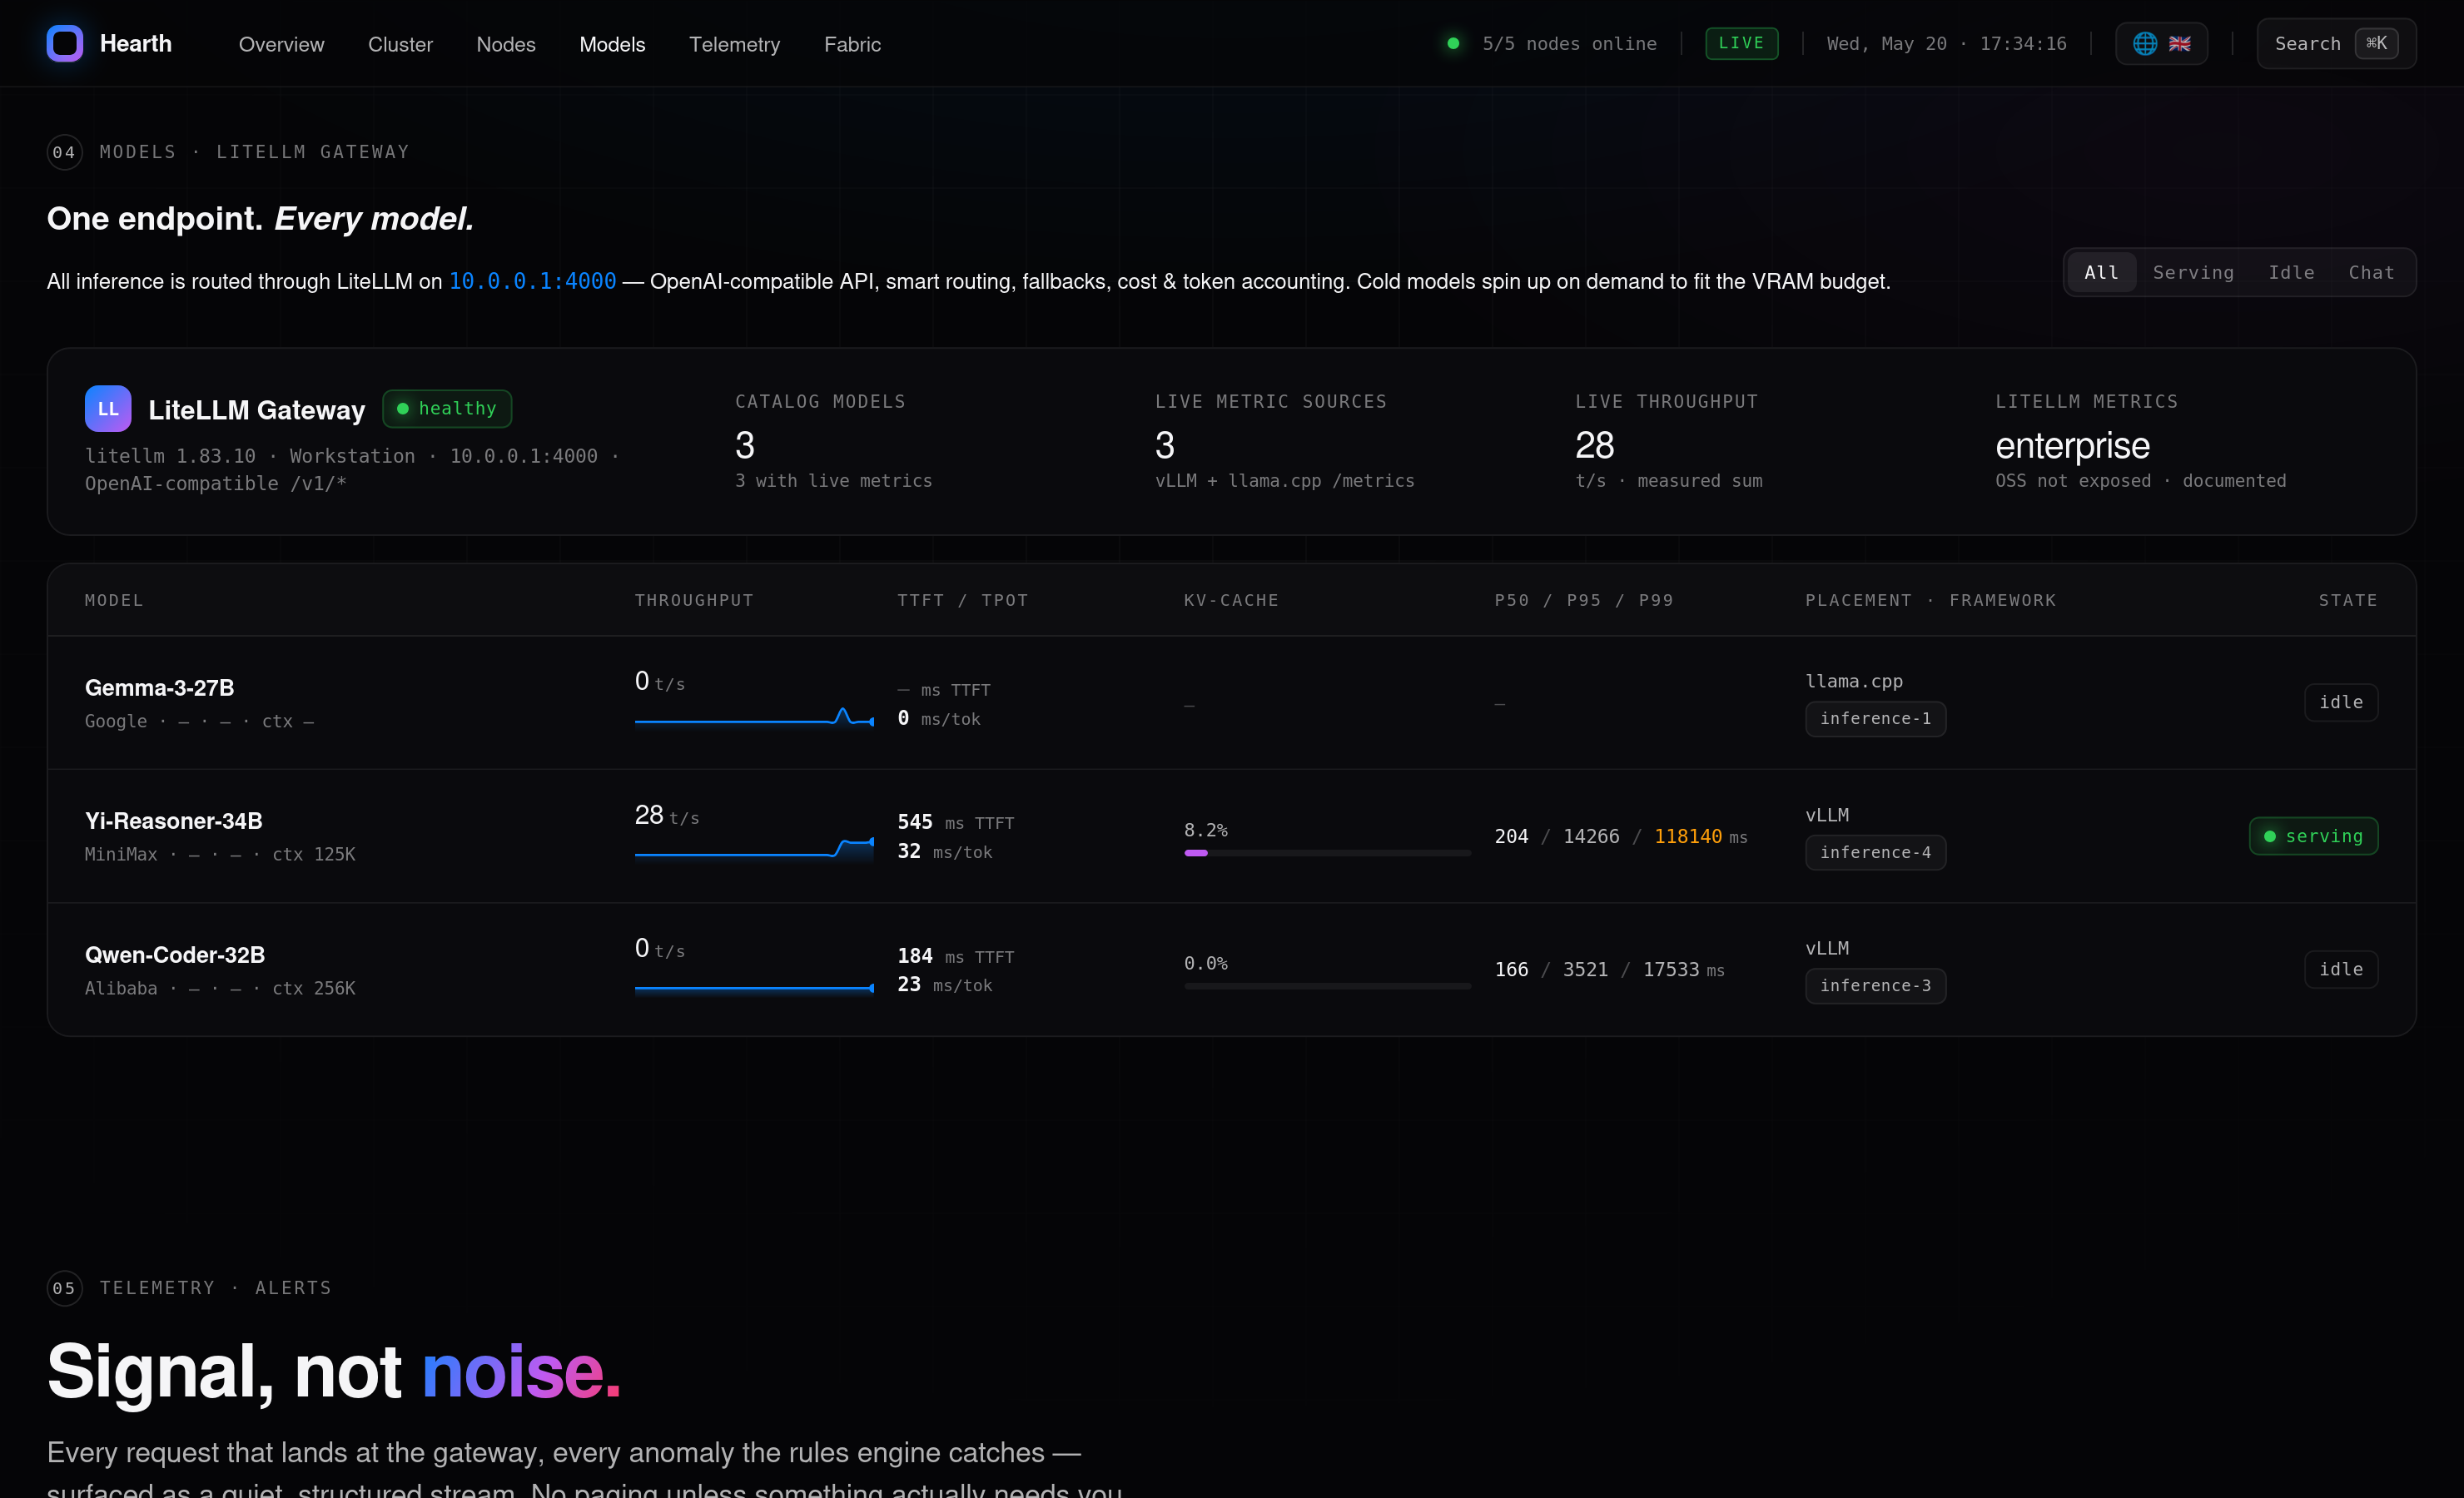 Models — auto-discovered from LiteLLM, real tps / TTFT / TPOT / KV from vLLM + llama.cpp /metrics |
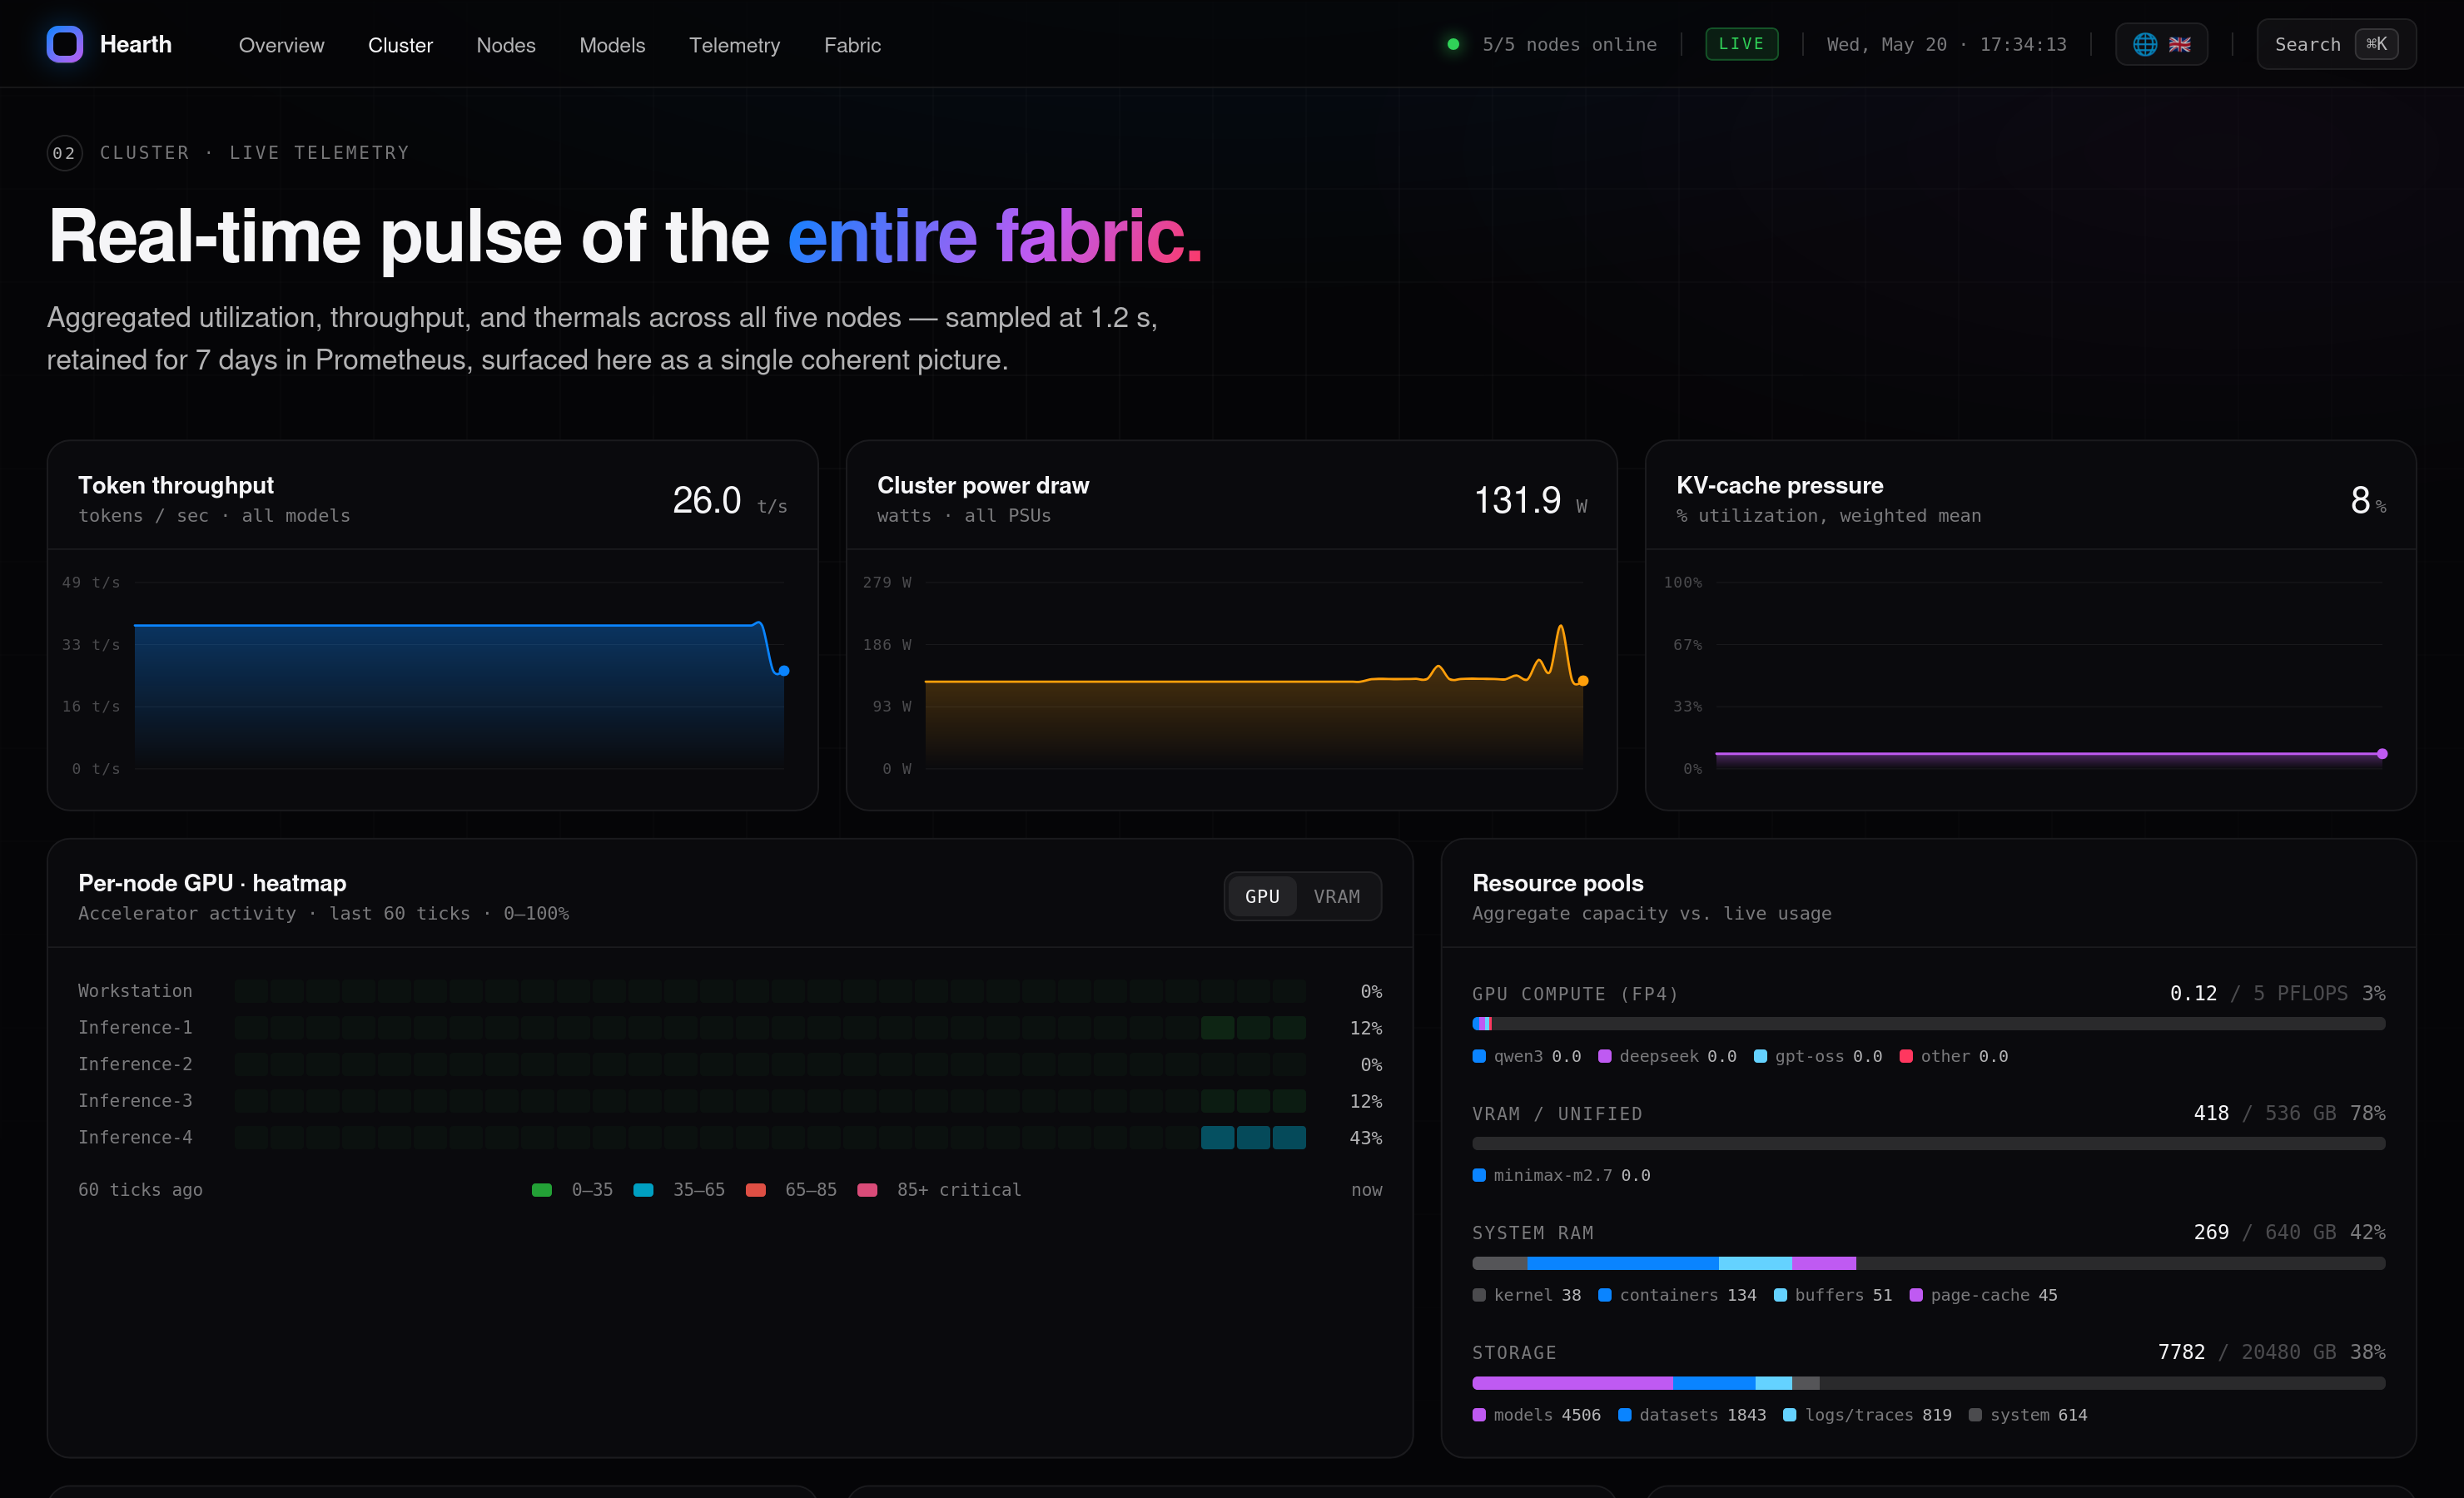 Cluster — token throughput, cluster power draw, KV-cache pressure — pulse charts |
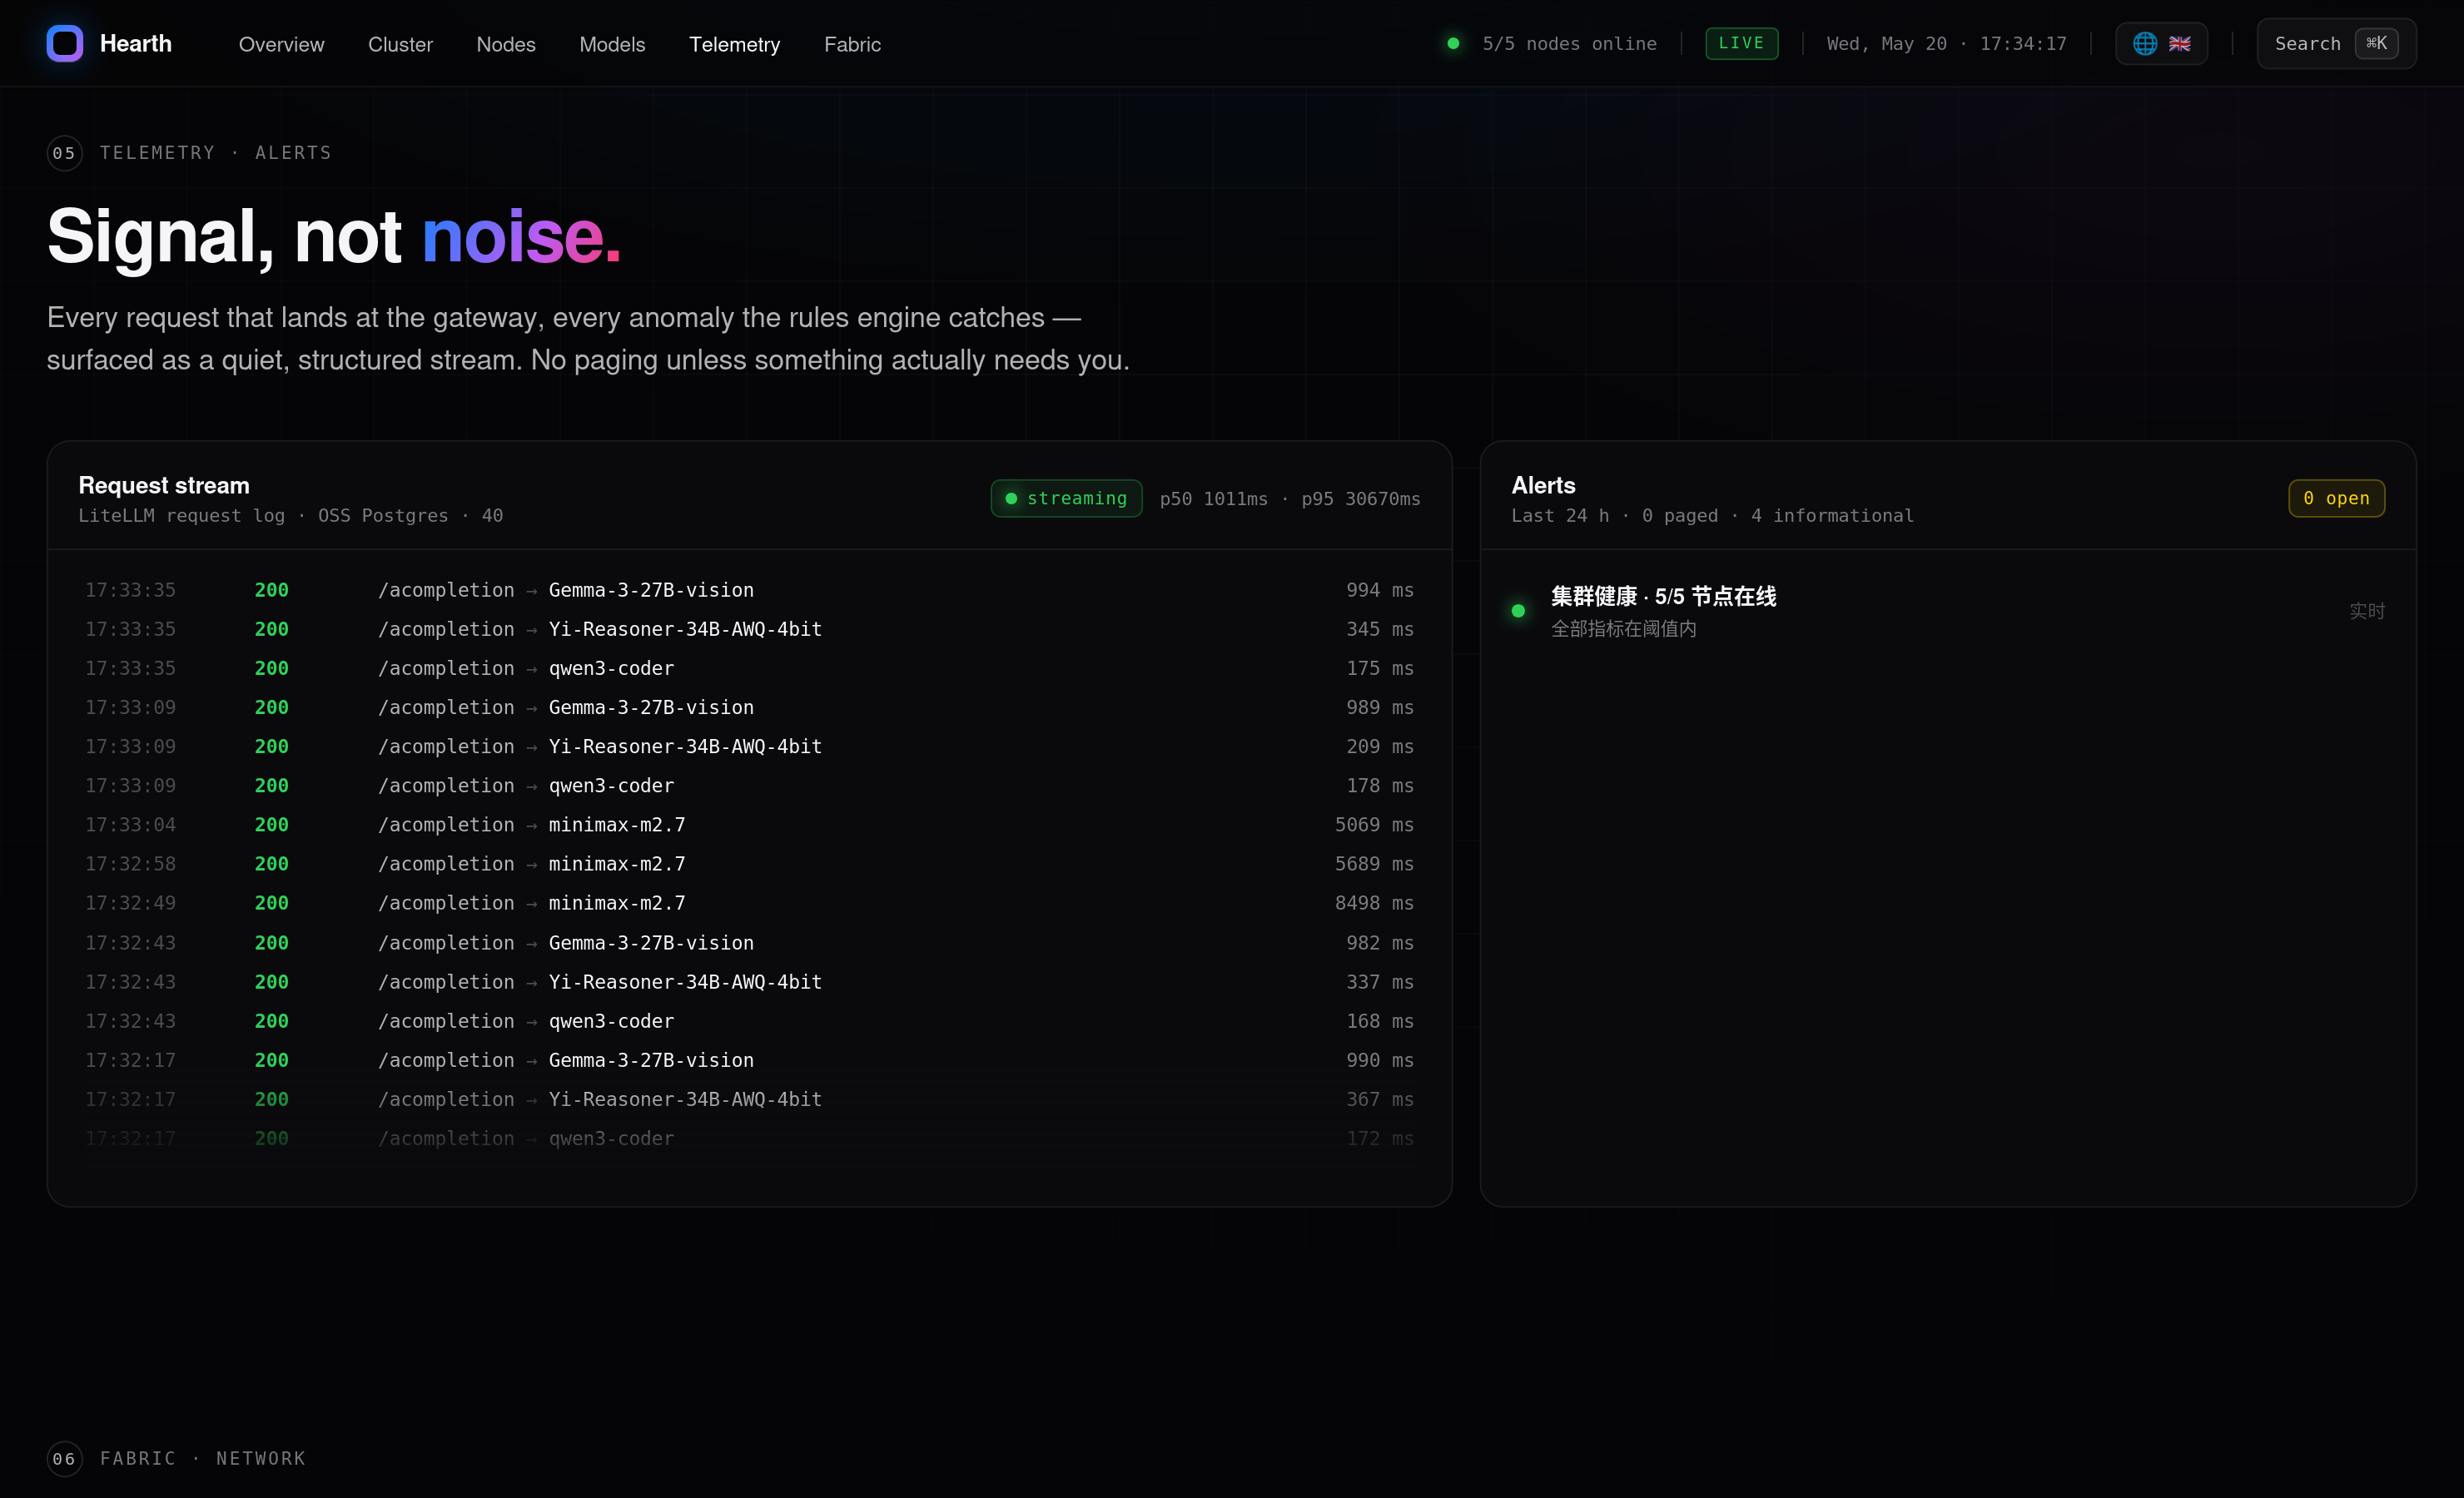 Telemetry — request stream from LiteLLM SpendLogs, alerts engine, signal-not-noise |
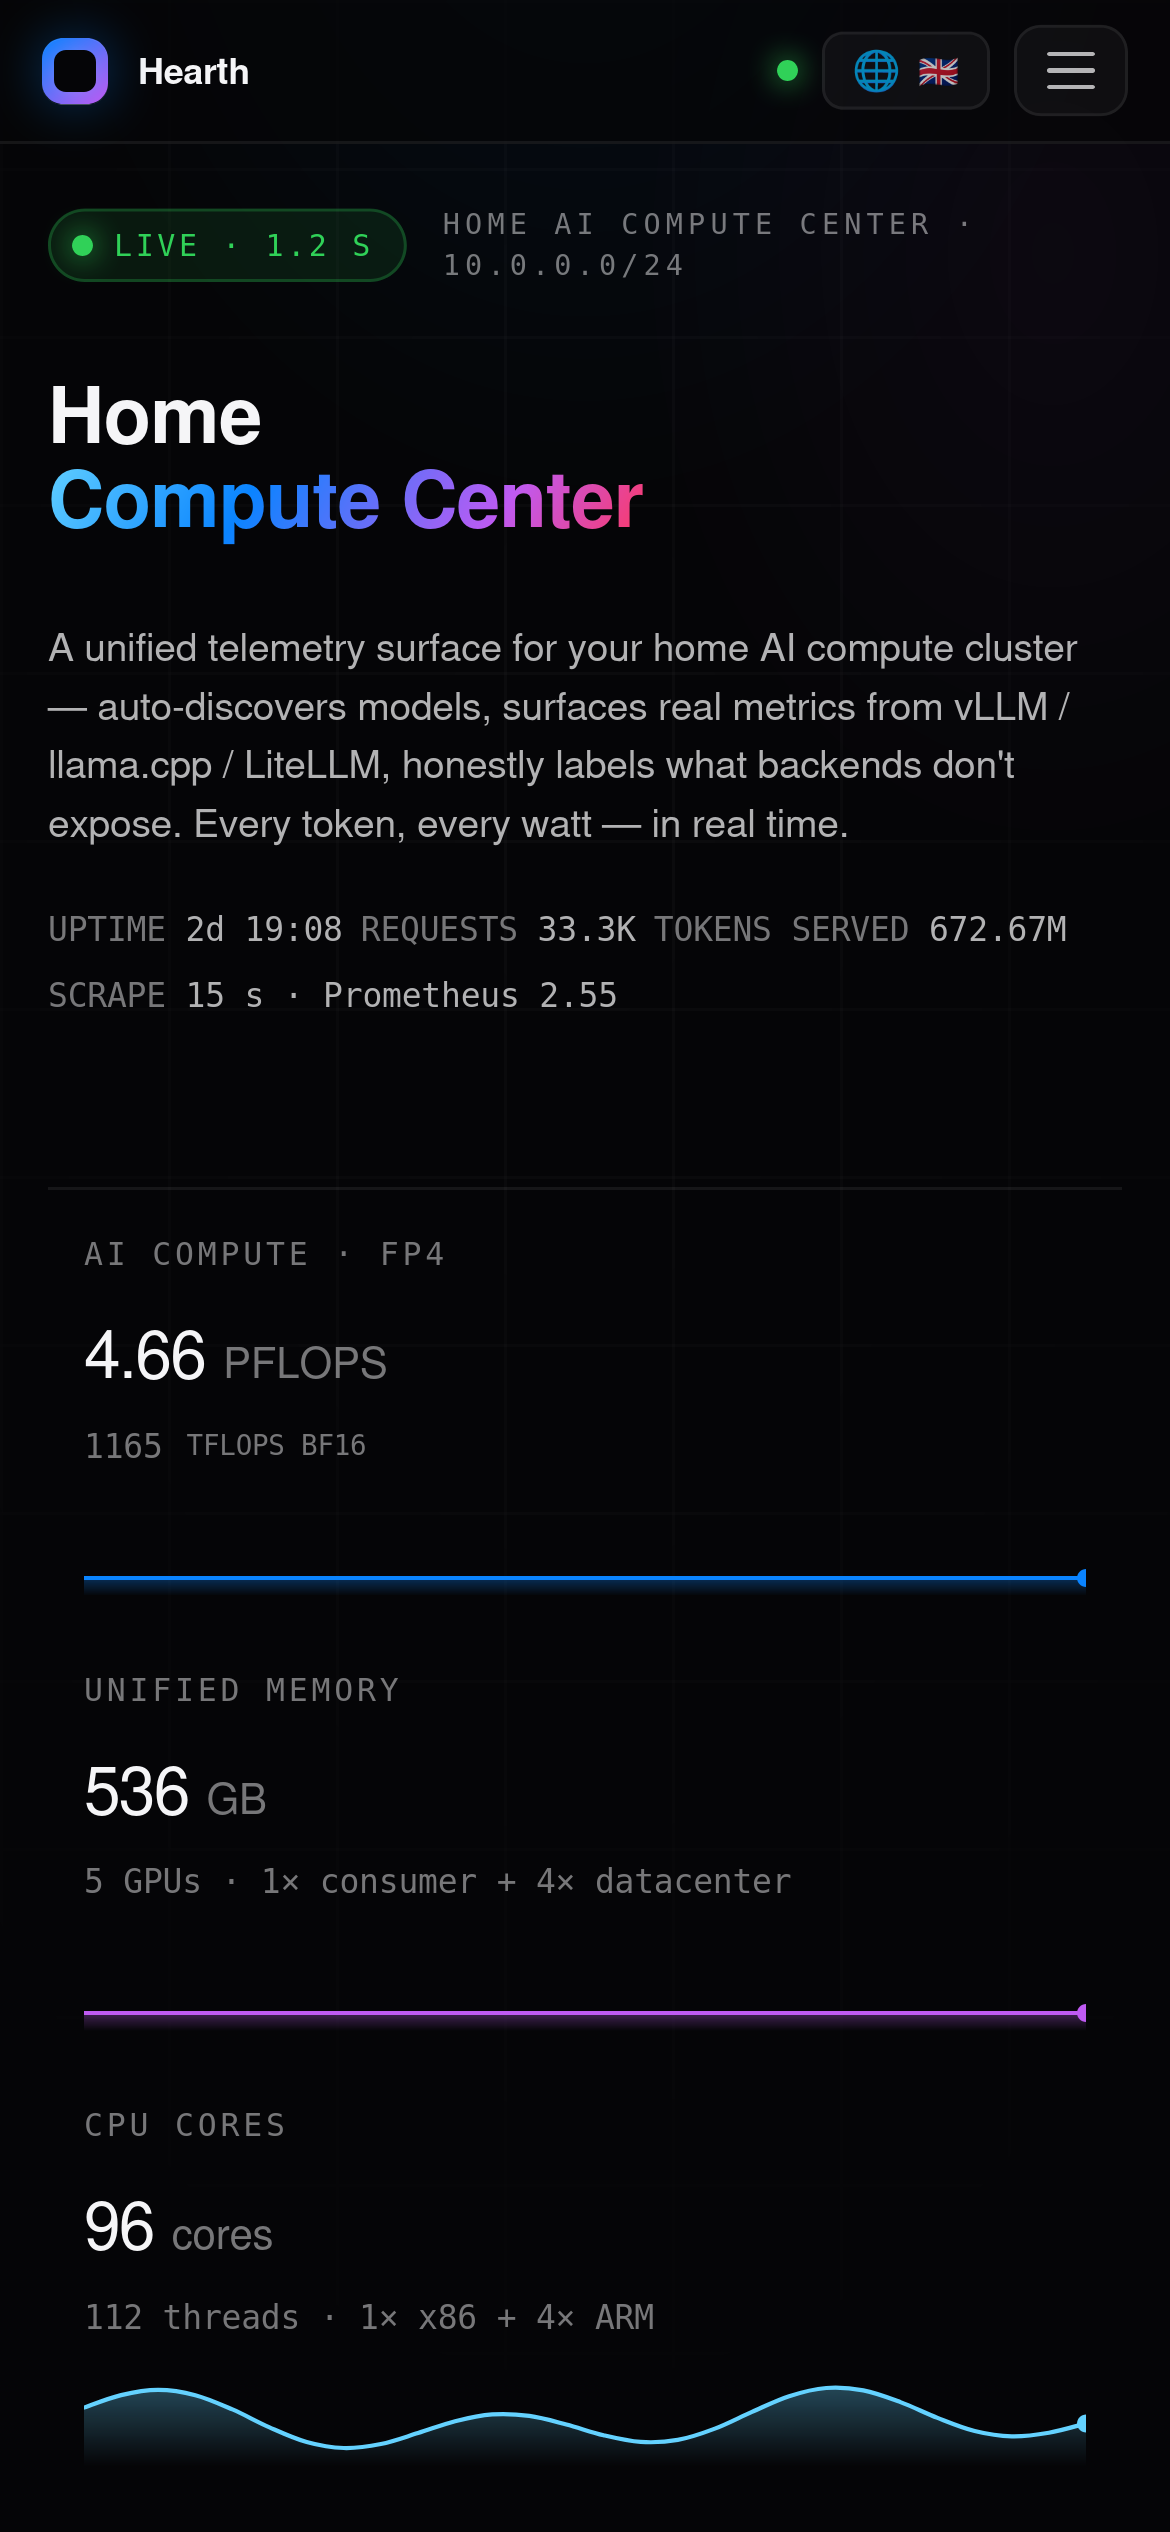
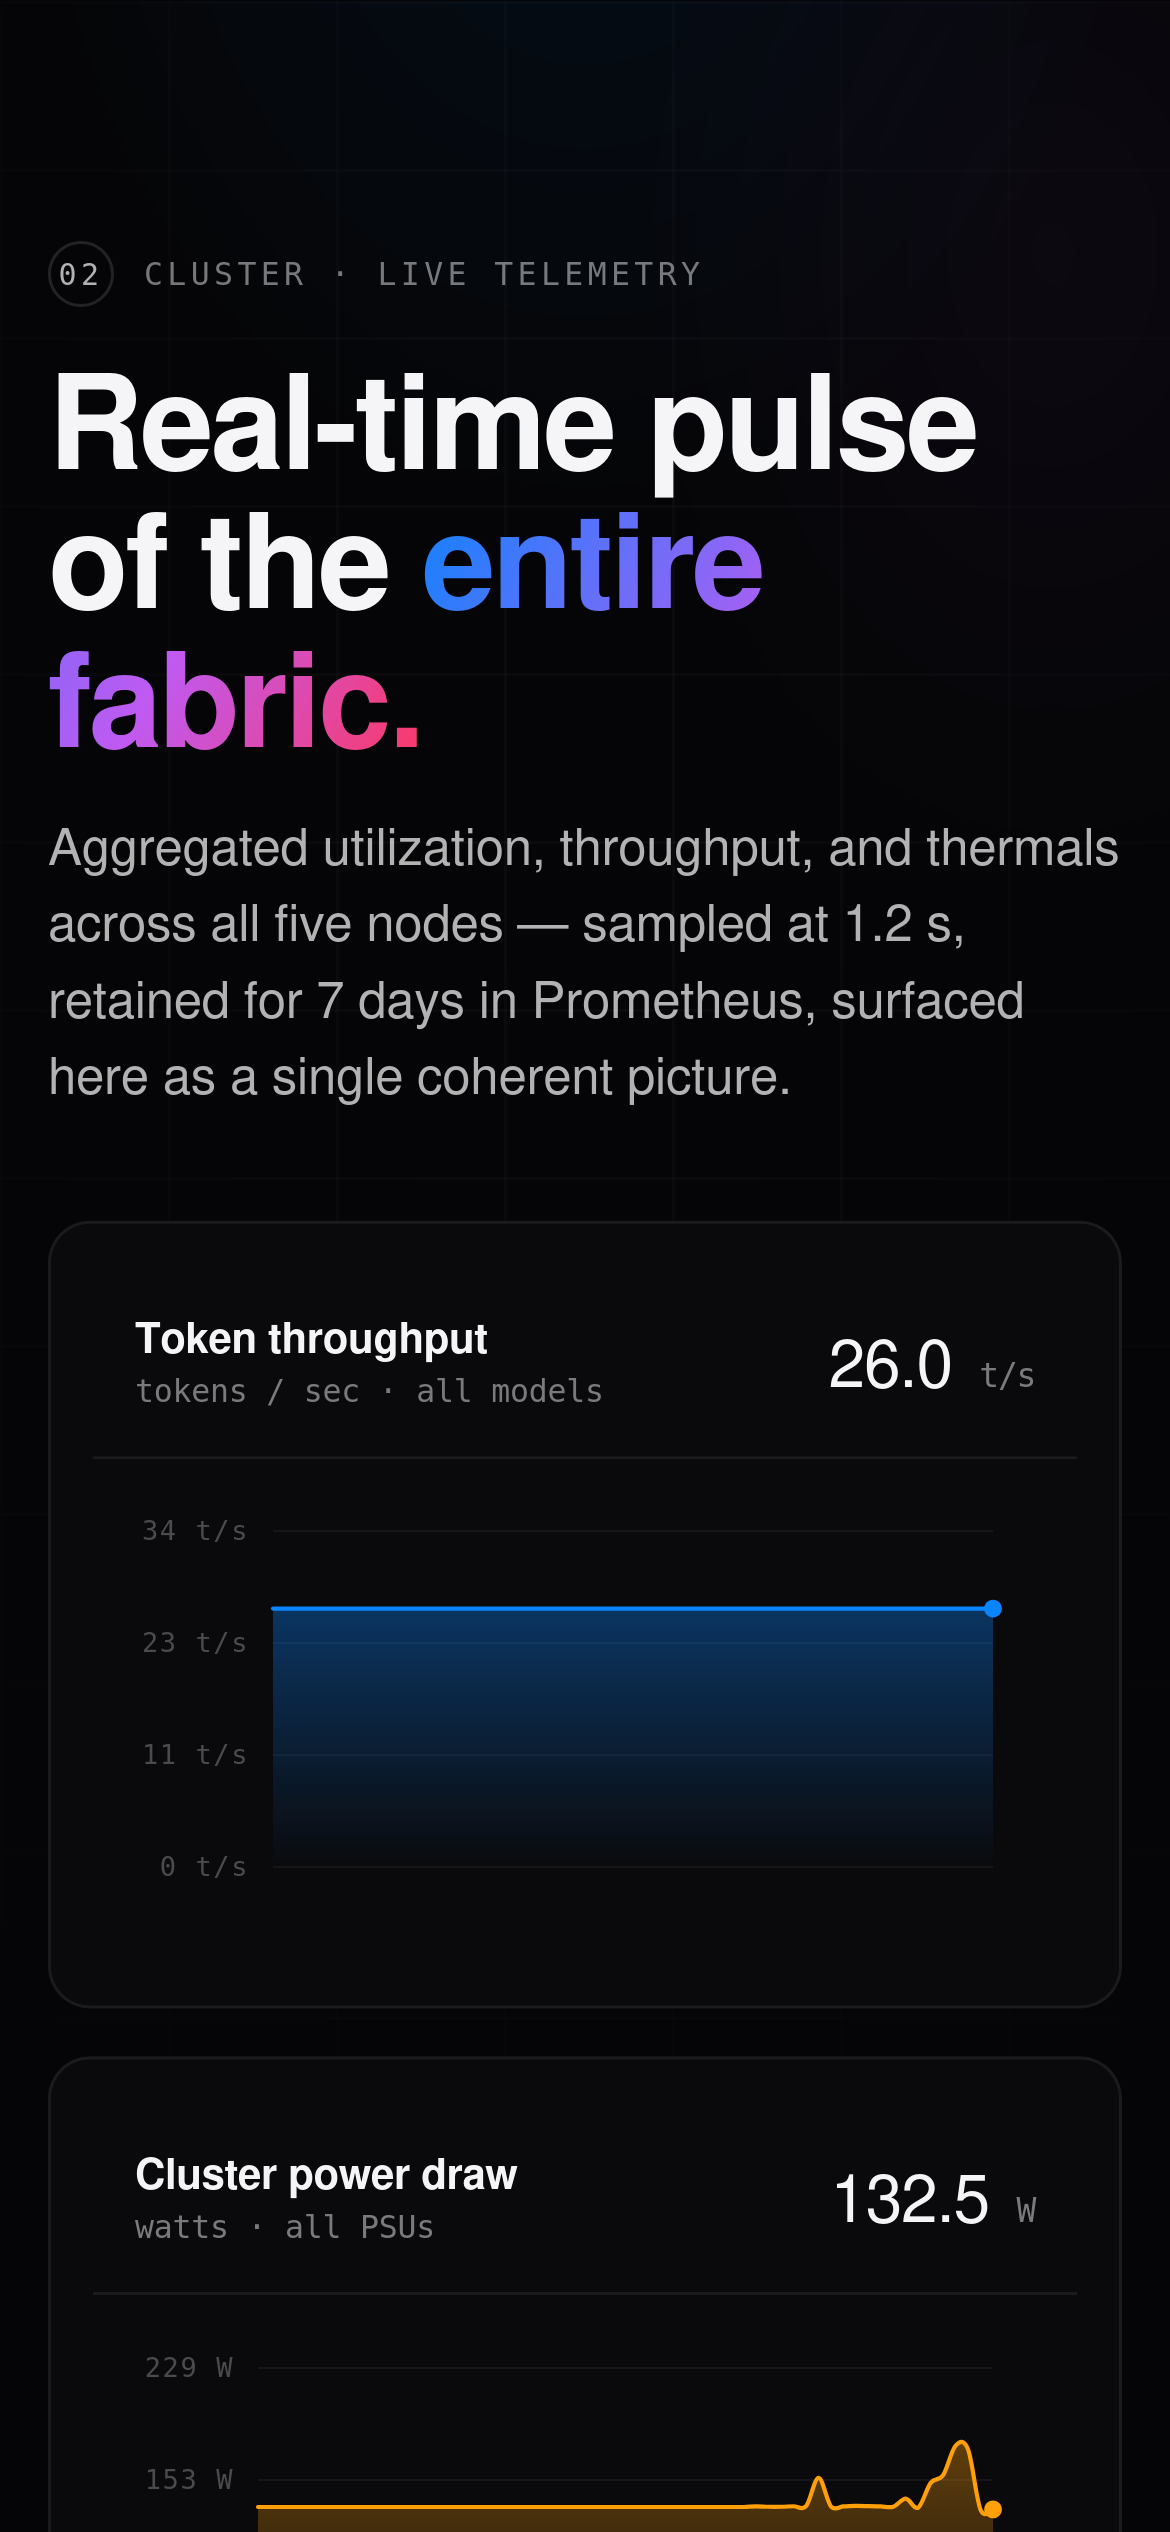
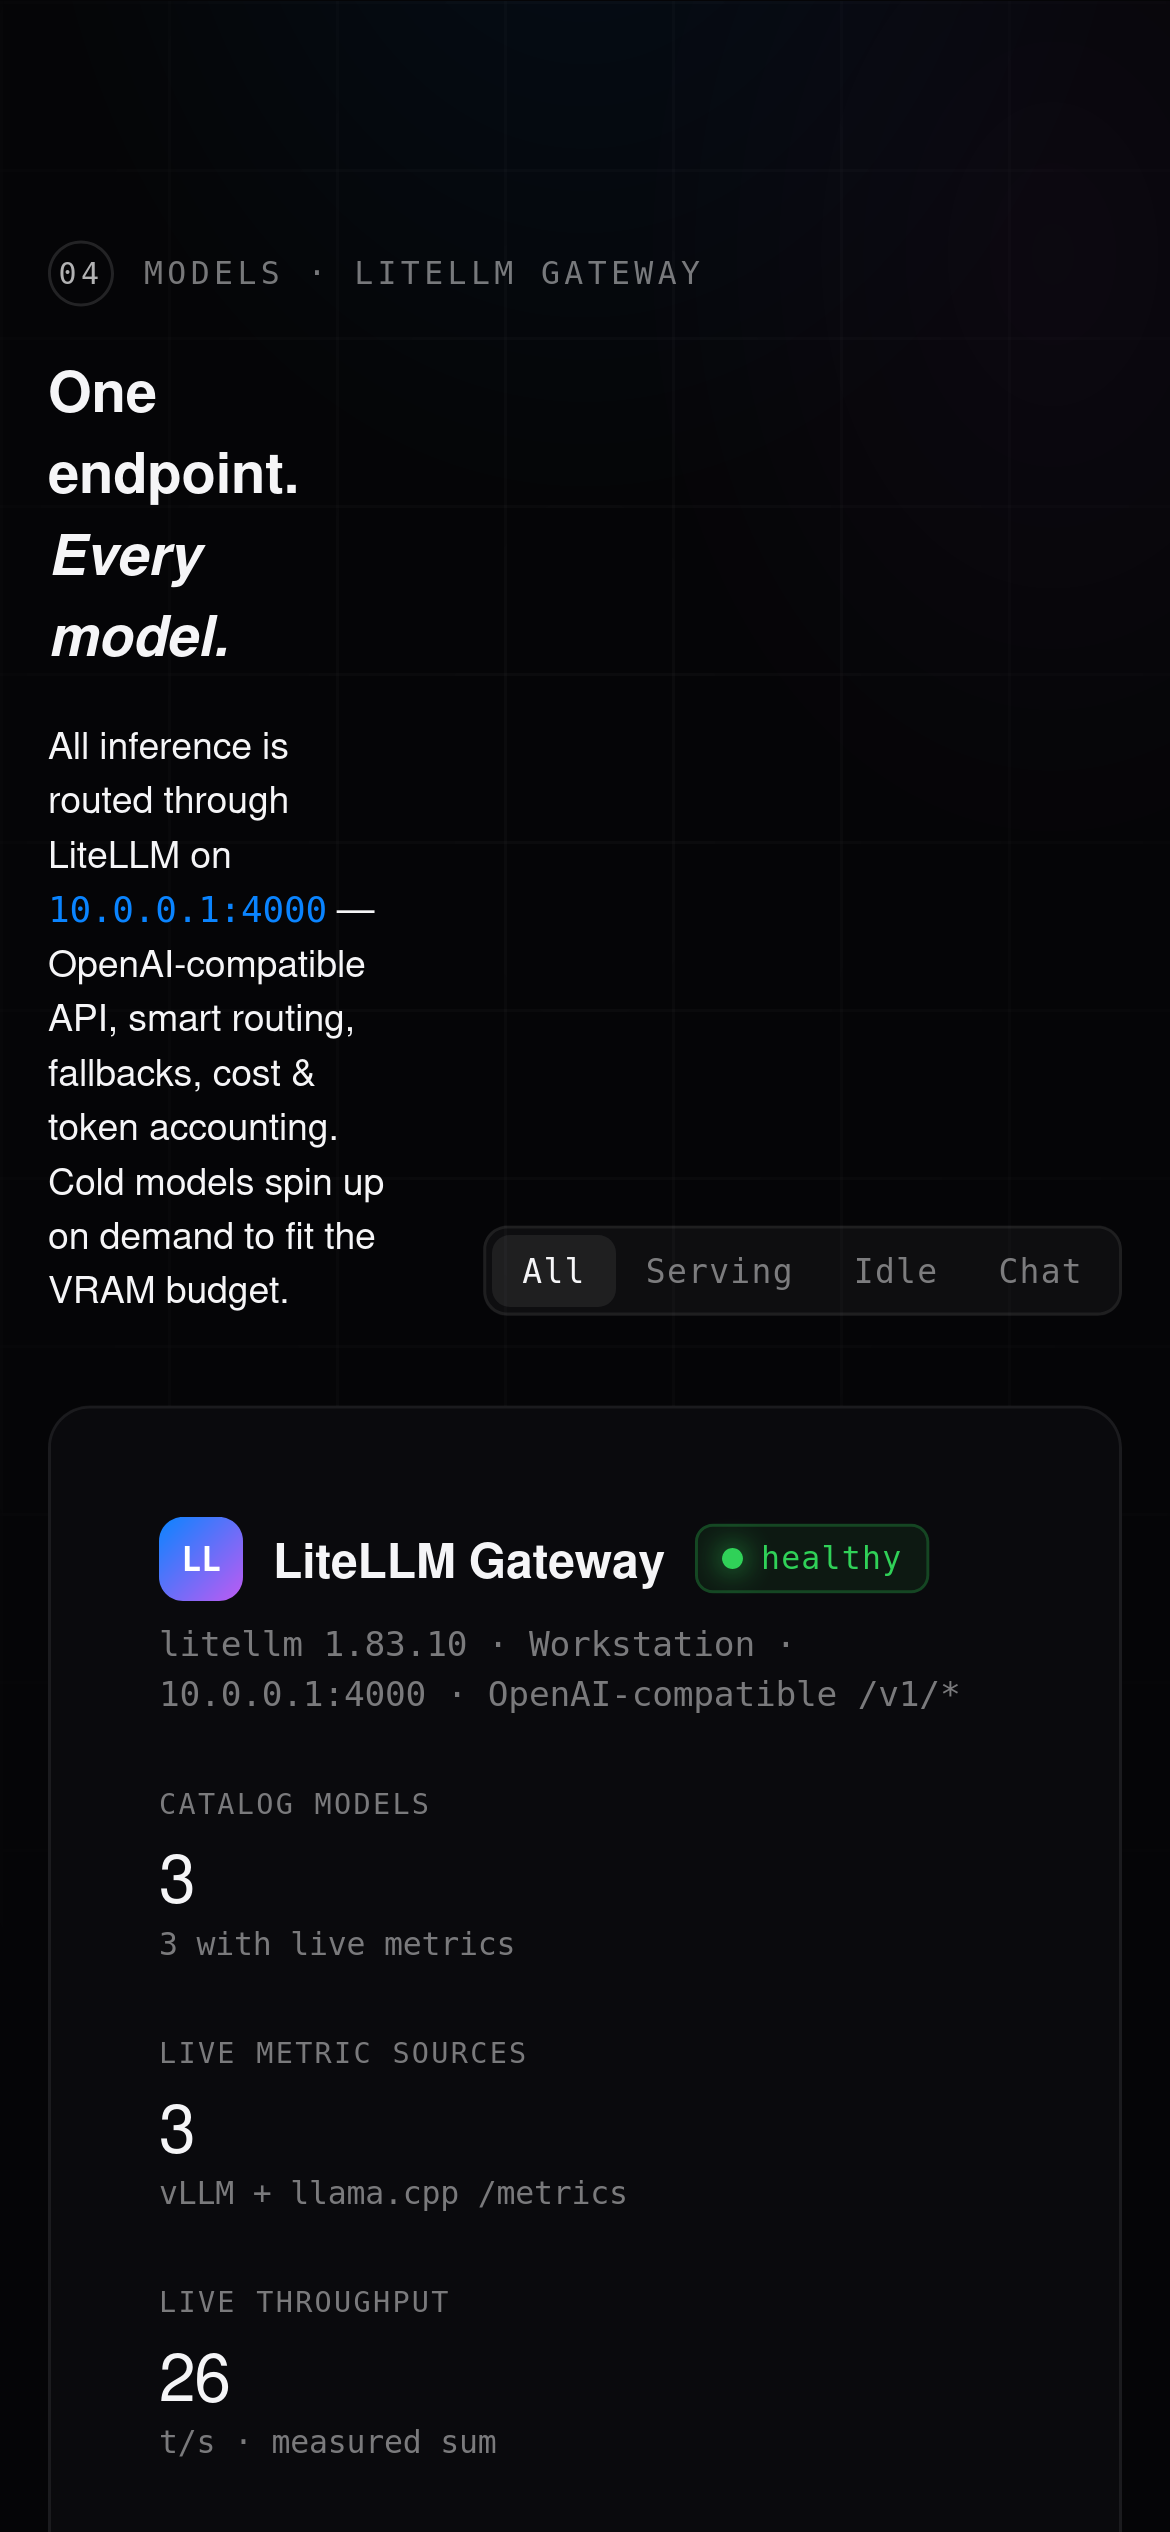
Mobile — responsive layout, hamburger nav, log rows ellipsize cleanly, status visible in one glance
|
> All screenshots are from a running cluster with topology / host names / IPs redacted to generic placeholders (`Workstation`, `Inference-1..4`, `10.0.0.0/24`). The redaction pass is reproducible — see [`docs/screenshots/_capture.py`](docs/screenshots/_capture.py).
## Roadmap
**v0.1.0 — Configuration as data** *(in progress)*
- [x] Single `config/hearth.yaml` replace hard-coded constants in `server/api/main.py`
- [x] Node-type abstraction (`discrete` / `unified-arm-soc` / `apple-silicon`) instead of GB10 specials
- [x] Timezone — browser-local from browser instead of hard-coded
- [x] `examples/` topology presets (single-4090, dual-A100, multi-node-heterogeneous)
**v0.2.0 — Adapter plugins**
- Pluggable metrics-source adapters (vLLM / llama.cpp / SGLang / Ollama / custom HTTP)
- Pluggable alert channels (Telegram / LINE / Pushover / ntfy / Slack / Discord / email)
**v0.3.0 — Polish**
- mkdocs documentation site
- Multi-arch Docker images (amd64 + arm64 for Jetson / Apple Silicon hosts)
- Tagged releases with semantic versioning
## Contributing
See [`CONTRIBUTING.md`](CONTRIBUTING.md). Briefly: open an issue first for non-trivial changes, follow [Conventional Commits](https://www.conventionalcommits.org/), be kind ([`CODE_OF_CONDUCT.md`](CODE_OF_CONDUCT.md)).
## Security
If you find a security issue, please **don't open a public issue**. See [`SECURITY.md`](SECURITY.md) for private disclosure.
## License
[MIT](LICENSE) © Tony Liu and Hearth contributors.