---
Traceway is an **OpenTelemetry-native** observability platform. It combines **logs, traces, metrics, session replay/RUM, exceptions, AI tracing, and on-call paging** in one place. Point an OTLP exporter at it and you're in business. No Collector, no glue code, no per-language vendor SDK.
**MIT licensed. No BSL. No "open core."** Every feature is in the box. Self-host it for free, or run it on [Traceway Cloud](https://cloud.tracewayapp.com) if you'd rather not babysit infra.
## What's in the box
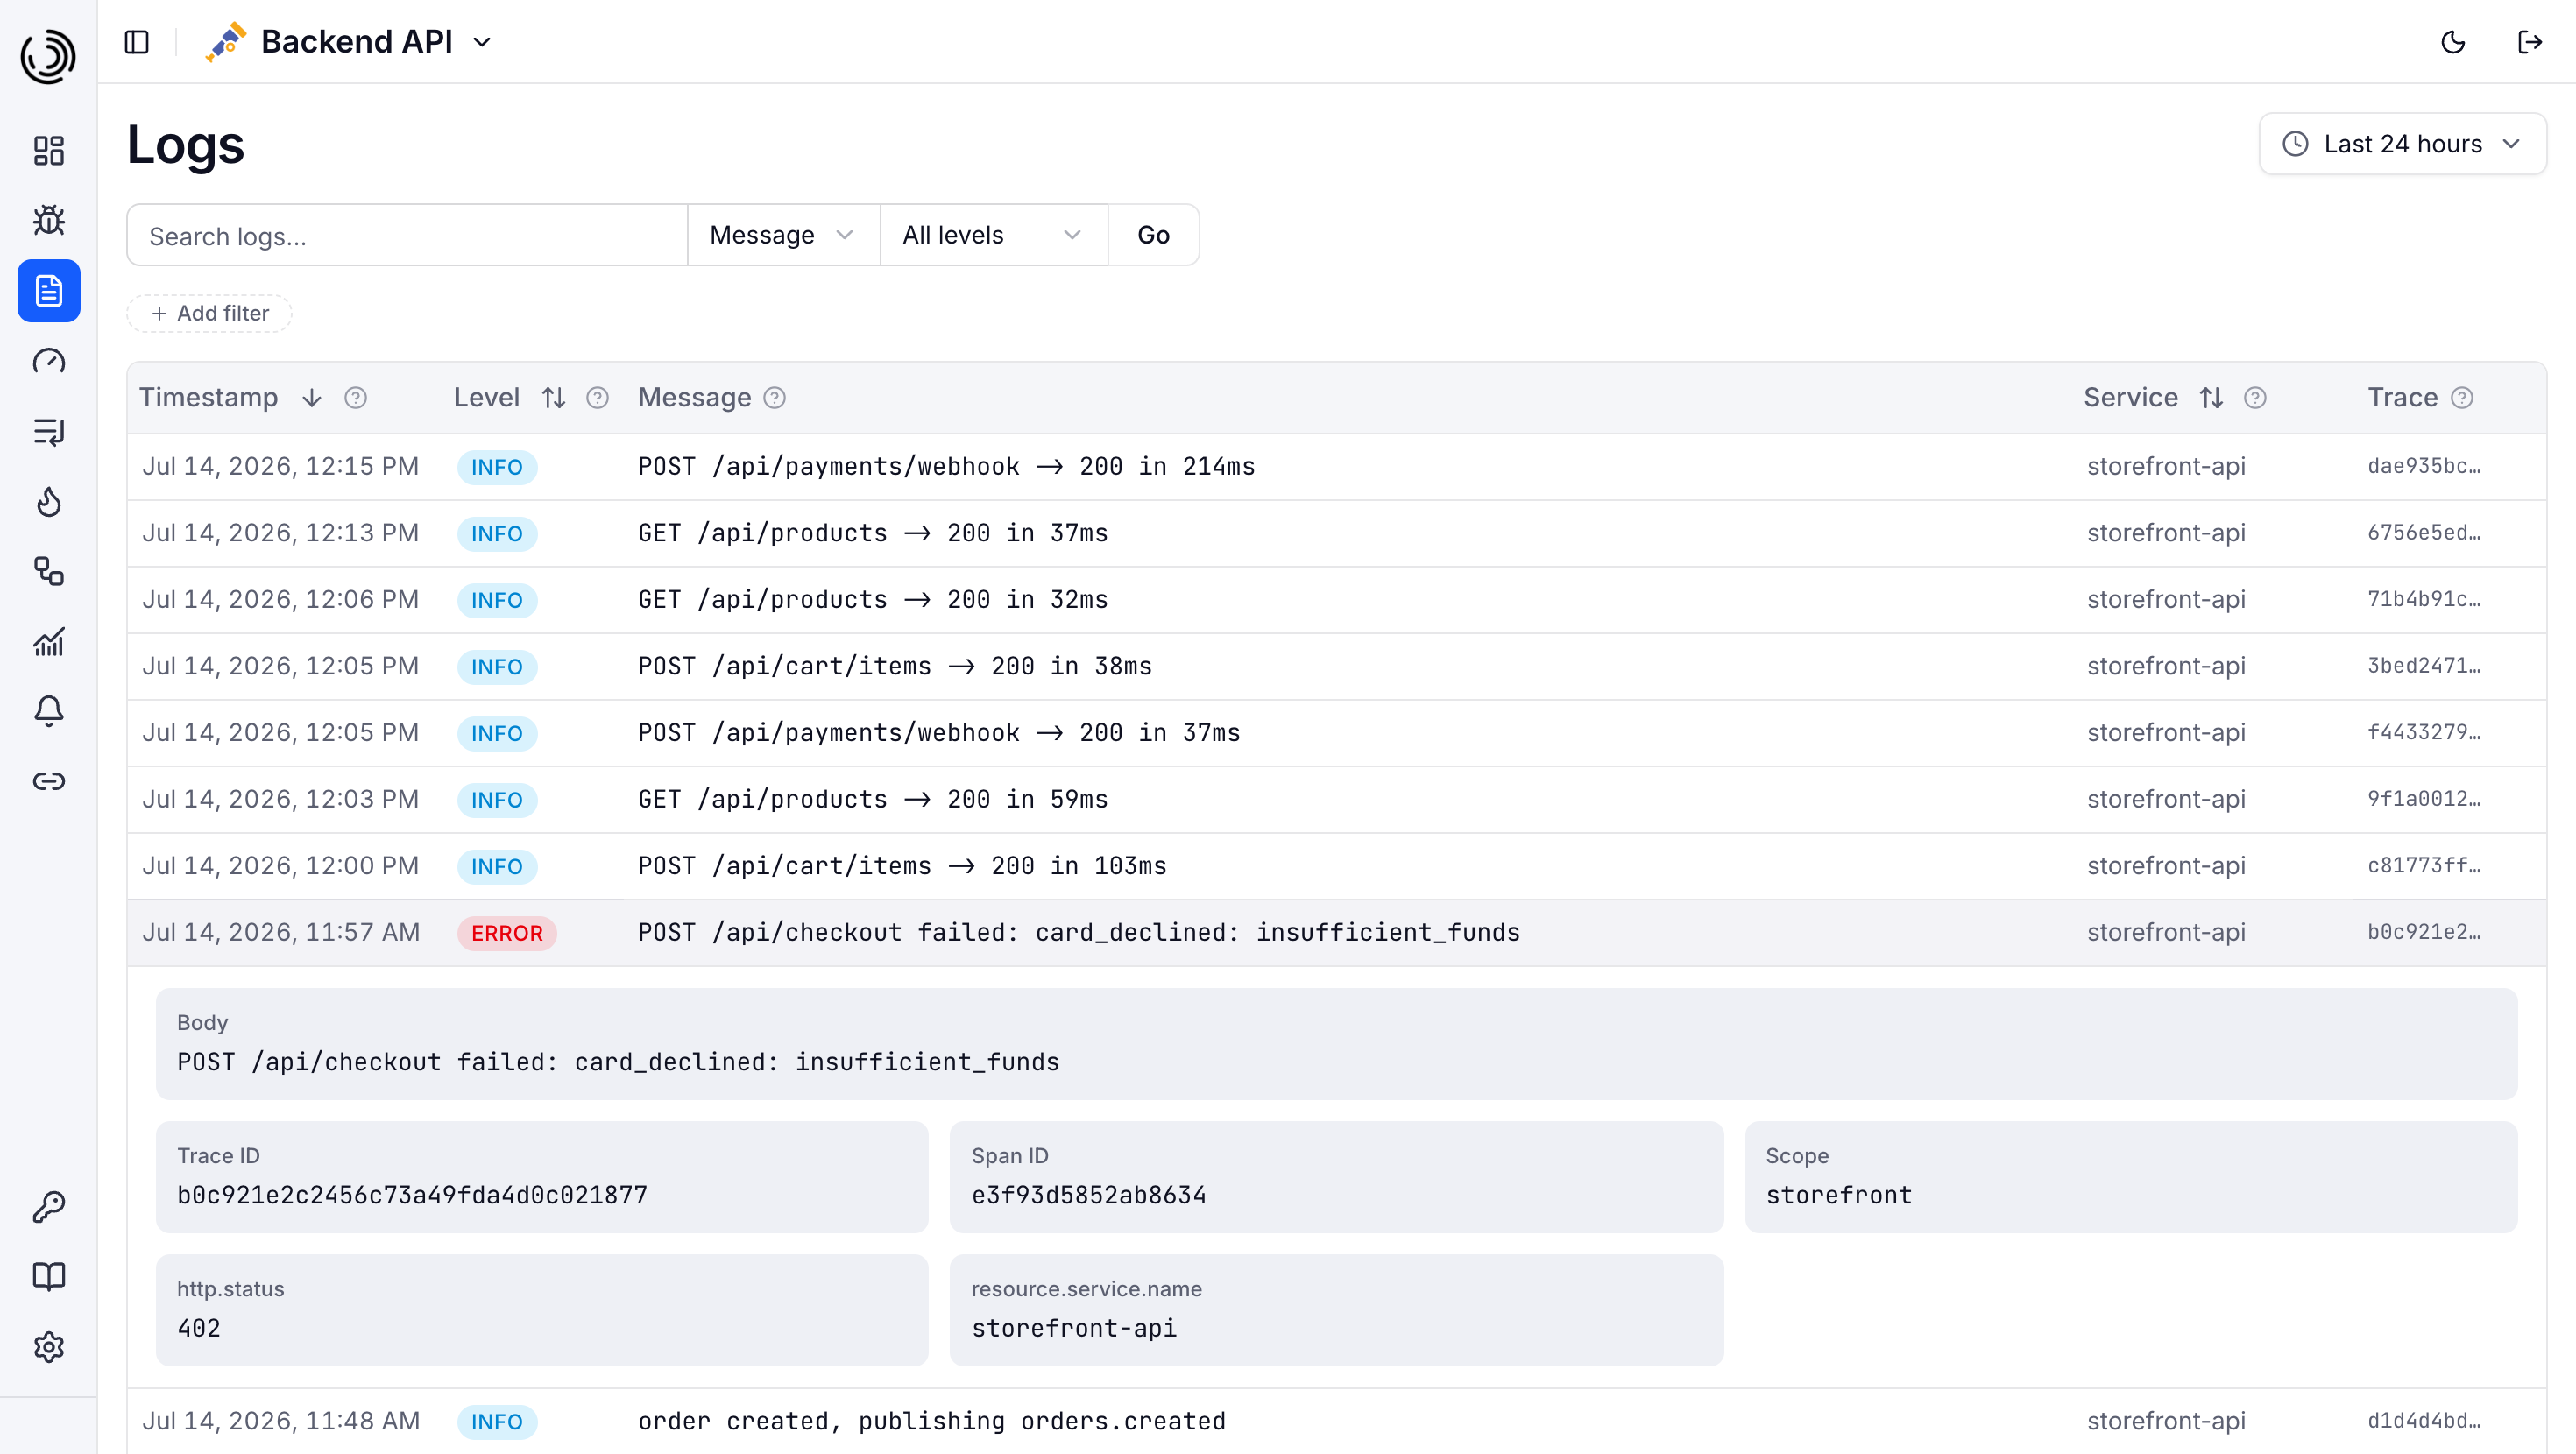
- **Logs**: Structured, trace-linked, sub-second search. Native OTLP/HTTP ingest from any OTel SDK.
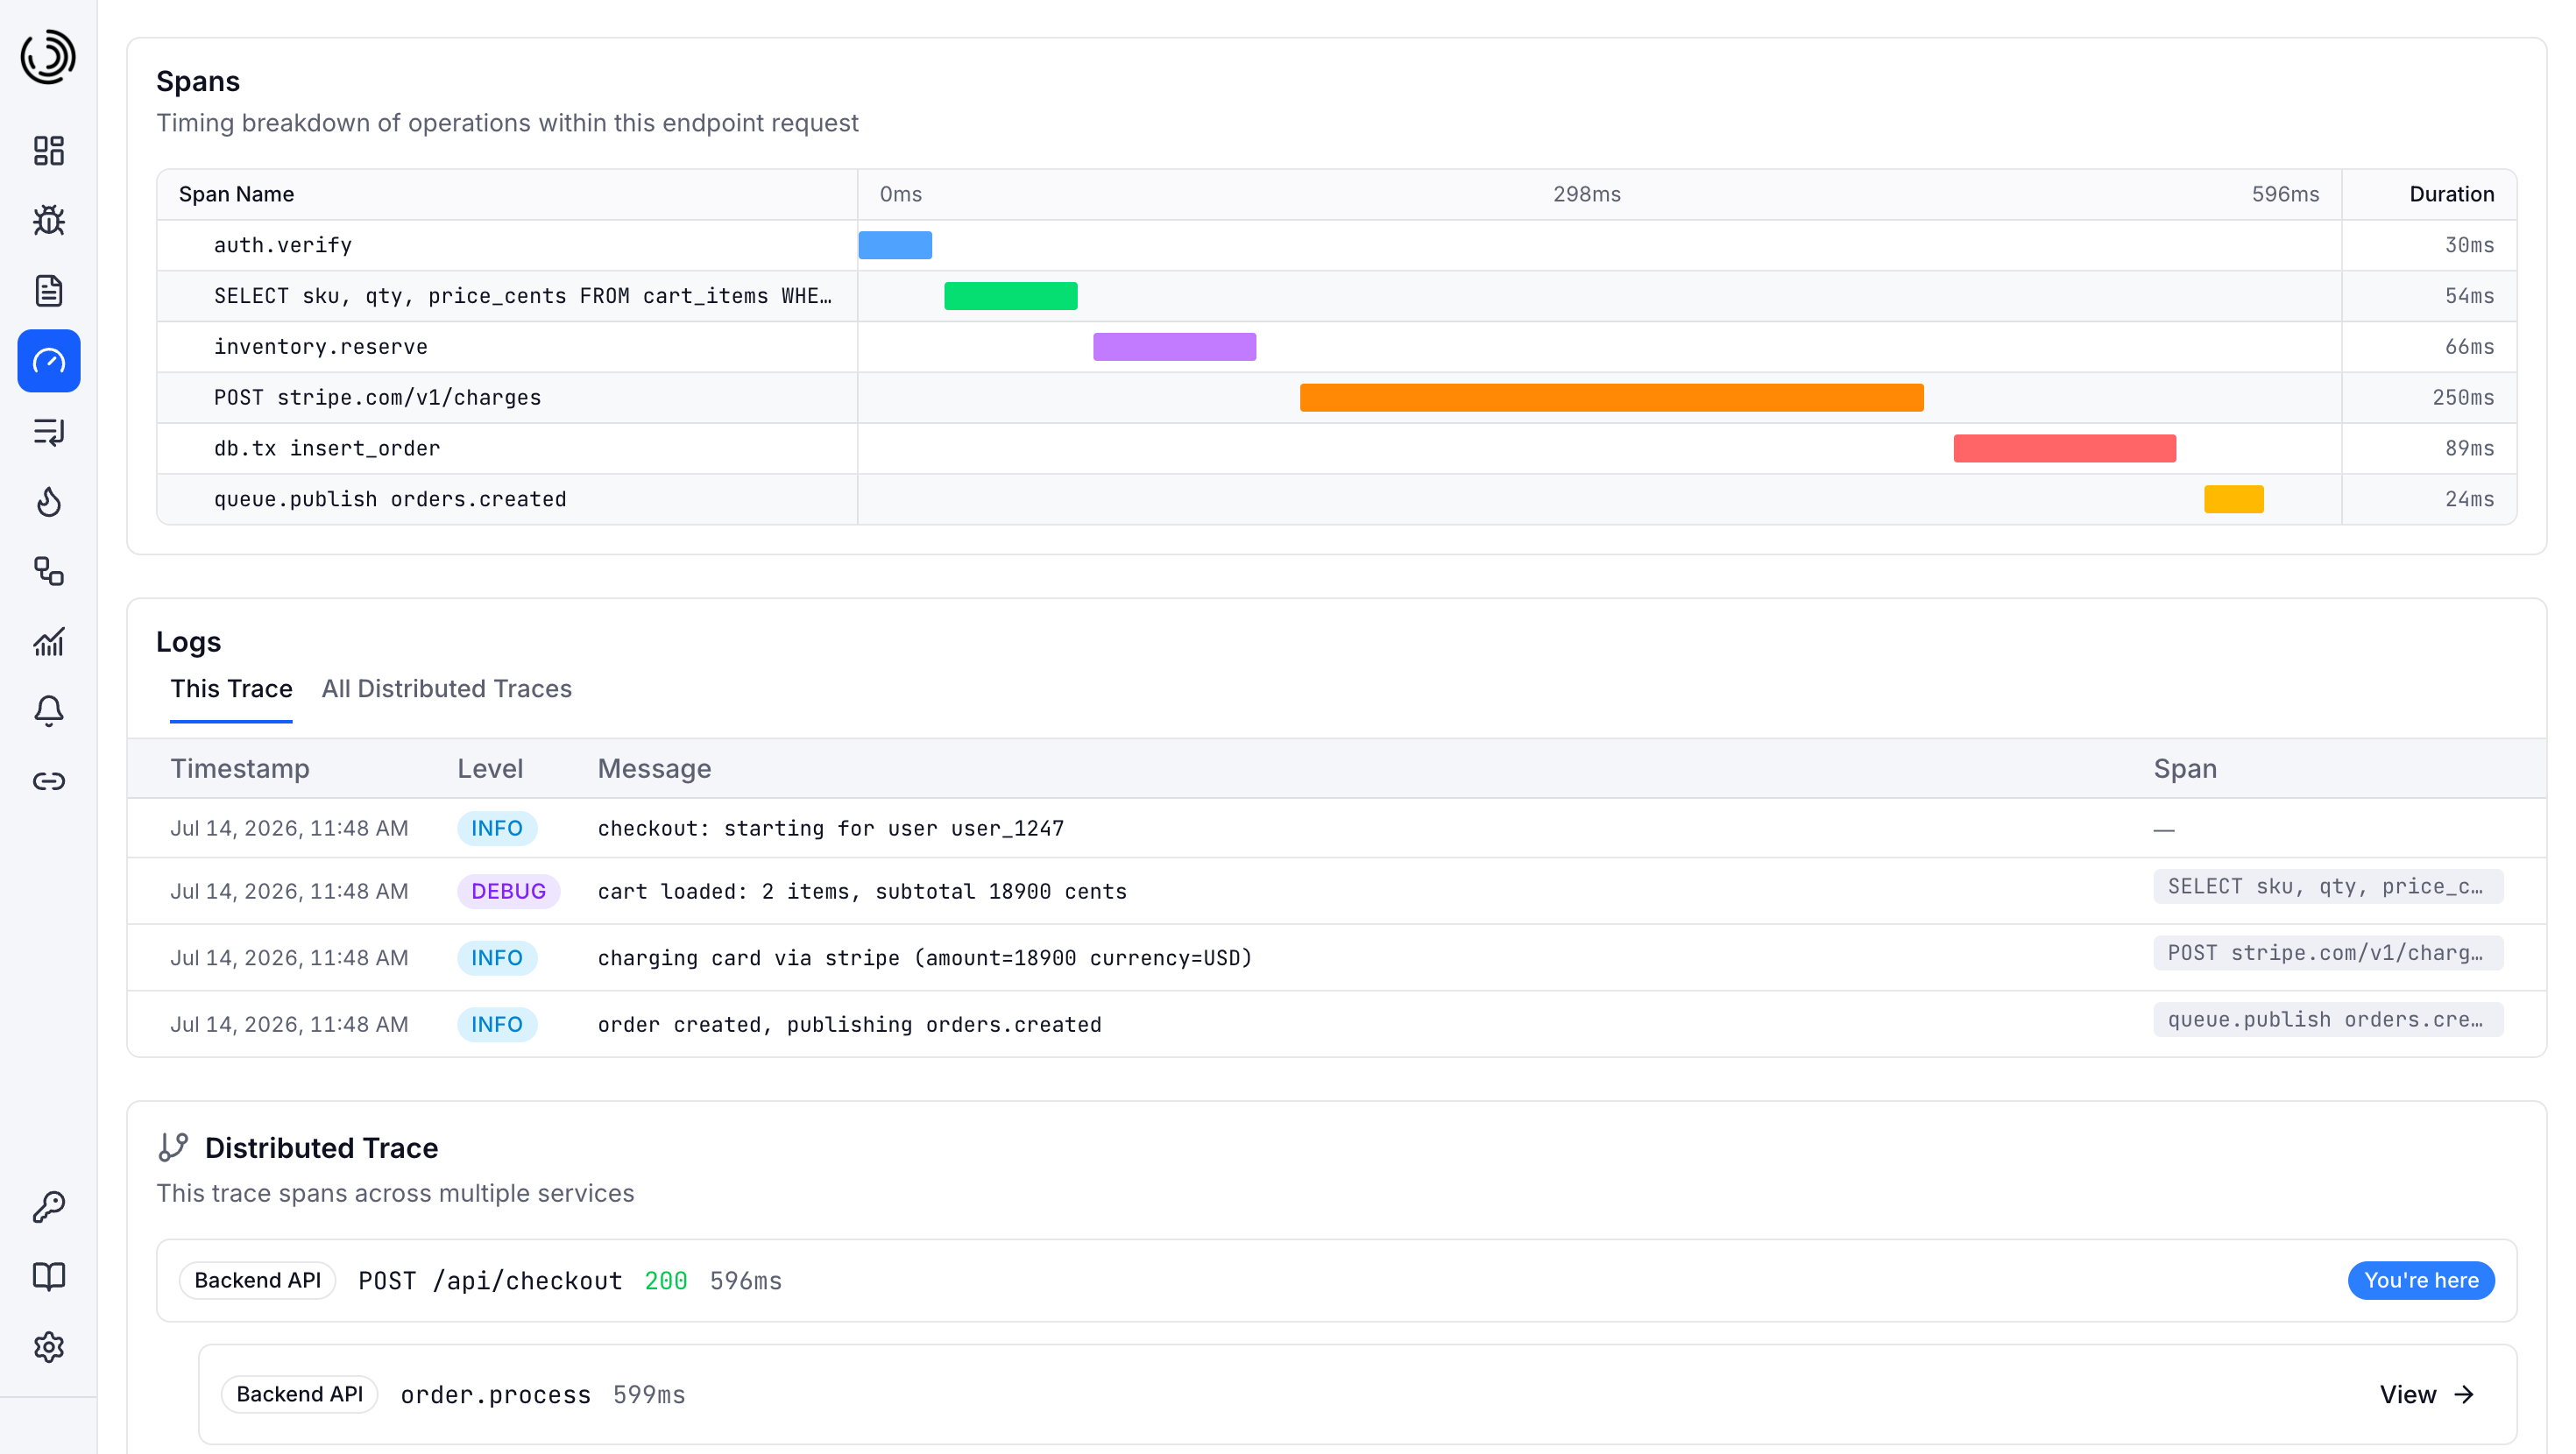
- **Traces**: End-to-end span waterfalls across every service. Click a log, jump to its span.
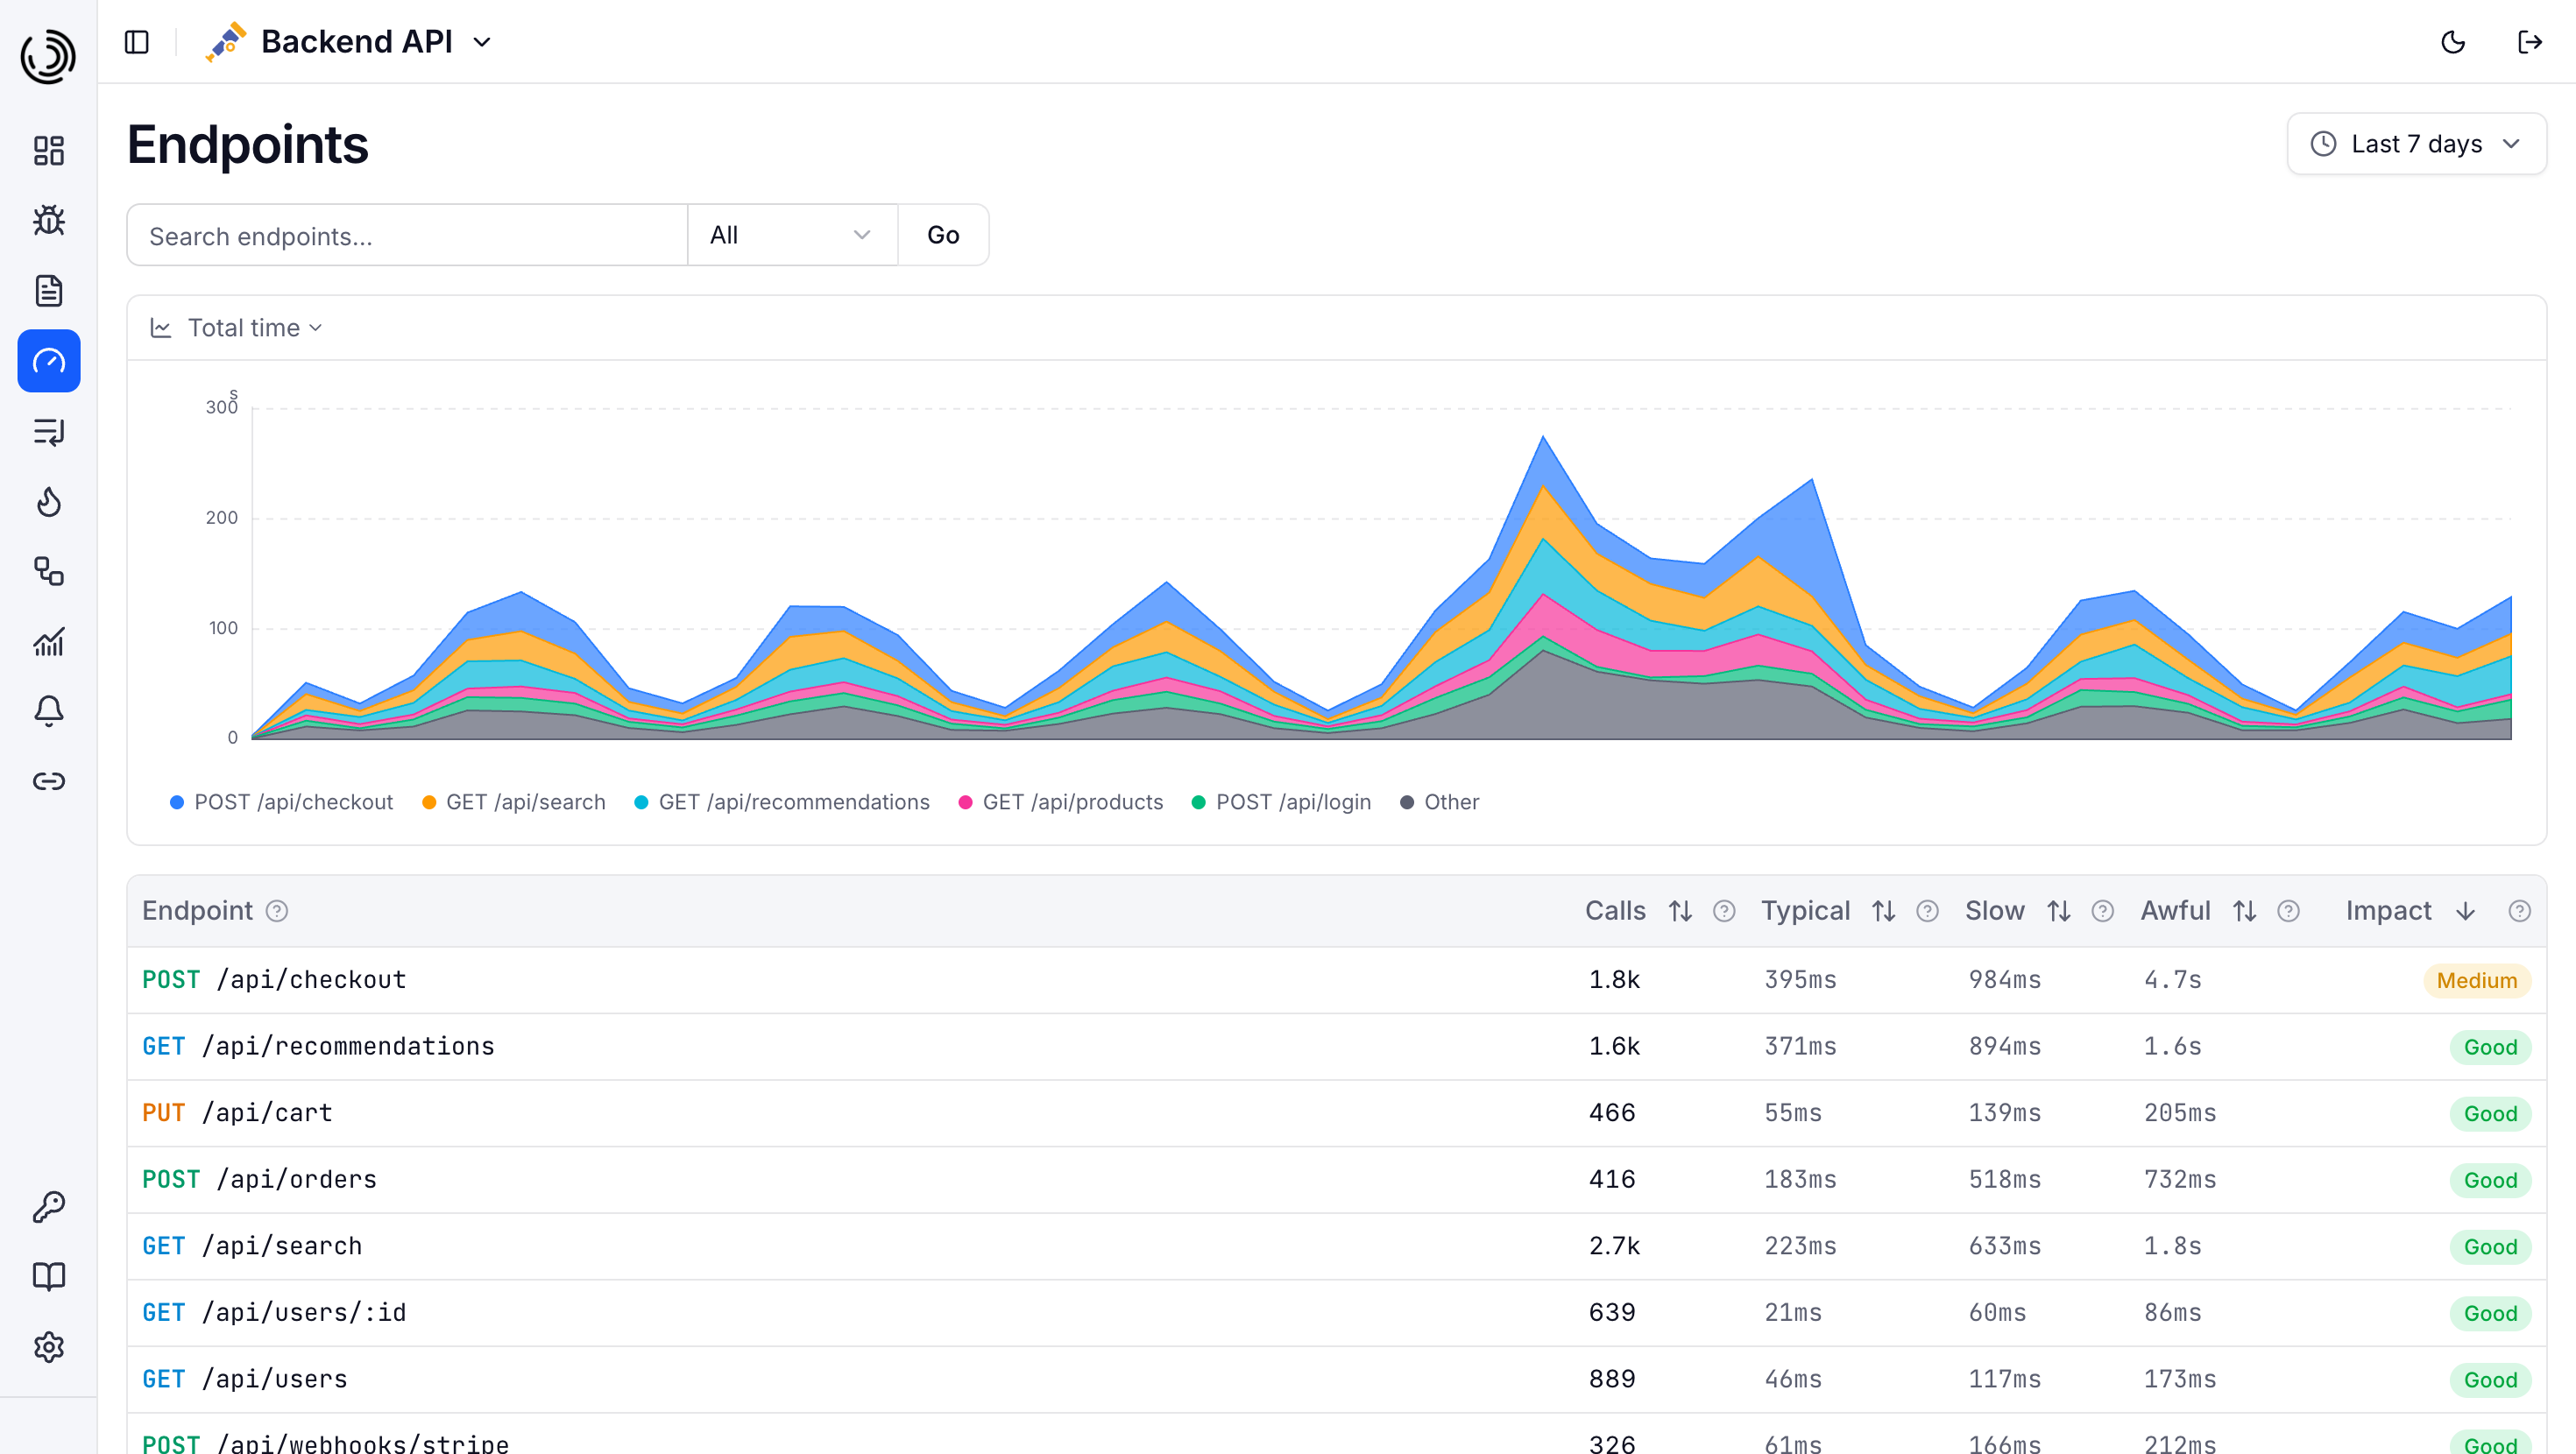
- **Endpoints**: Per-route latency percentiles (P50/P95/P99), throughput, and error rate, ranked by Apdex and a 5-factor impact score.
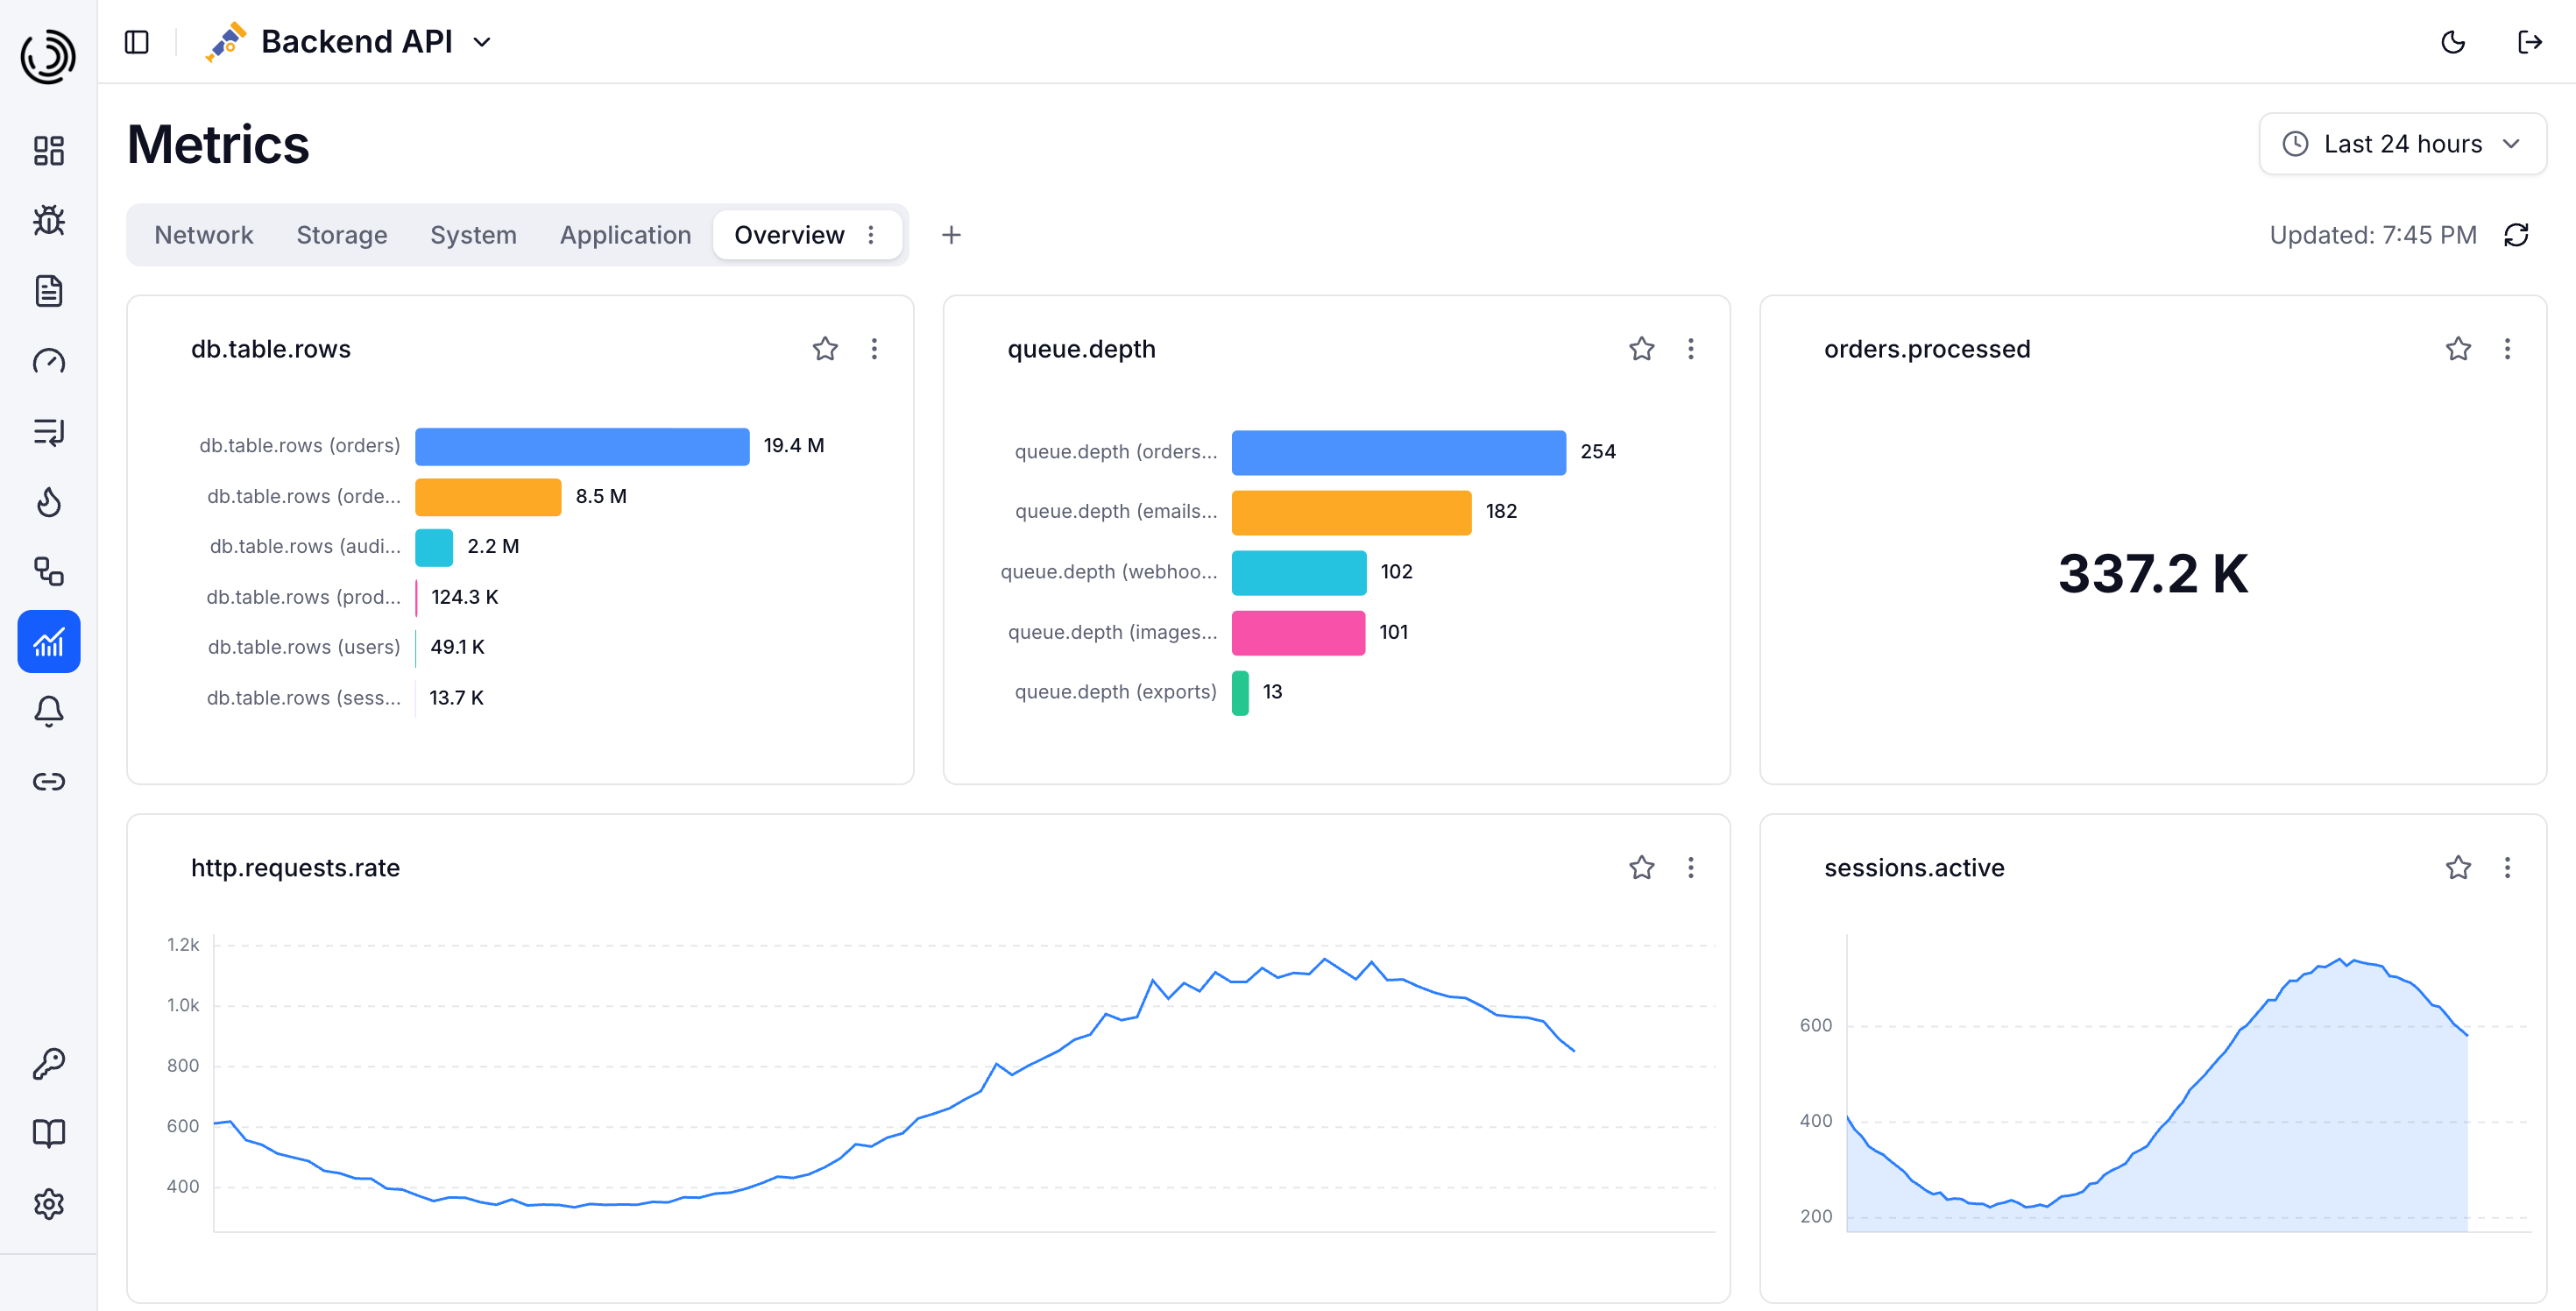
- **Metrics**: Host, runtime, and custom metrics. Any dimension, any chart, with custom widget groups.
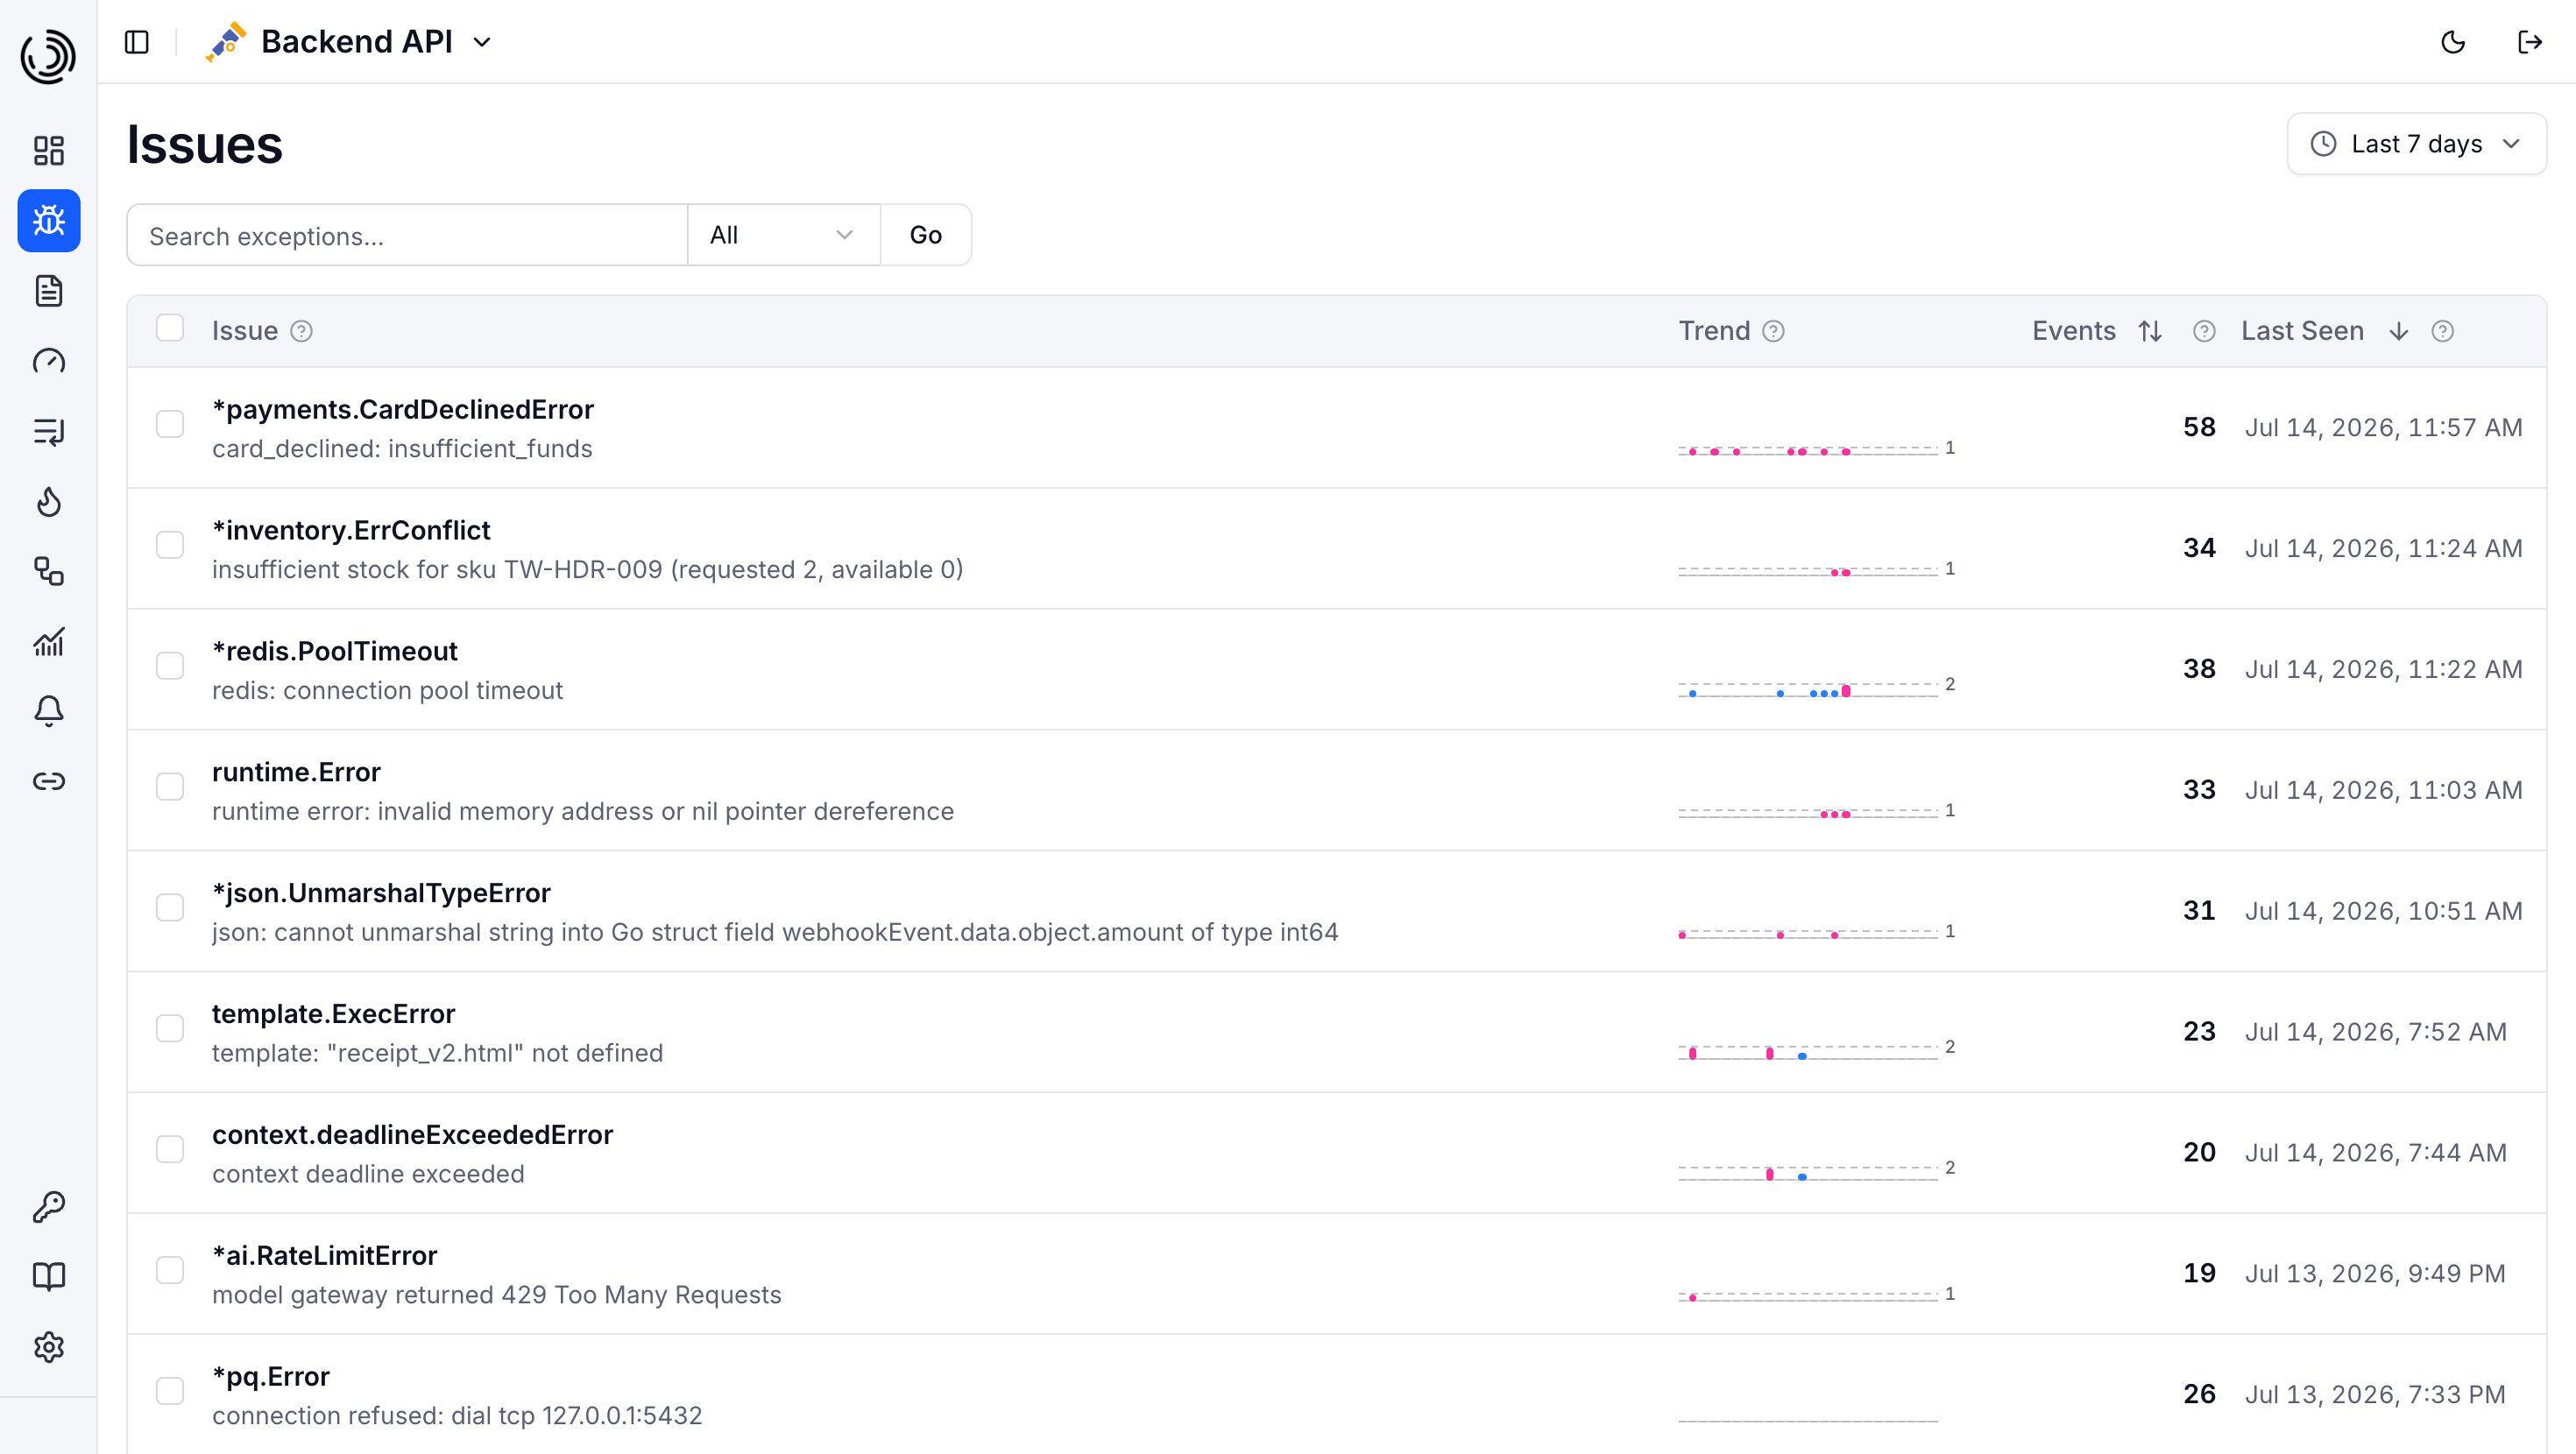
- **Exceptions**: Stack traces are normalized, given a SHA-256 fingerprint, and grouped into ranked issues. Source-mapped (webpack, esbuild, Vite).
- **Profiling** _(experimental)_: Flame graphs for CPU, heap, and goroutines with version-to-version diffing and a top-functions table. Ingests native Go pprof and OTLP profiles.
- **Session Replay**: Watch what the user did right before the error. Available for web (any JS framework) and Flutter.
- **AI Observability**: LLM cost, tokens, latency, and full conversations across providers (OpenRouter and any OTel-compatible AI gateway). Calls group into conversations via `gen_ai.conversation.id`, tool calls are parsed from completions and rendered in the chat view, and multi-language content flagging catches conversations containing terms you care about. Per-customer analytics (conversation length, cost per conversation) key on `user.id`: set it to a stable customer identifier such as your account or tenant id, the same value across all of that user's conversations, never a session id.
- **On-Call & Paging**: Rotation schedules with layers and overrides, escalation policies, and pages that escalate until someone acknowledges. Delivered via email, Slack, Pushover, Telegram, or SMS, with one-click acknowledge links that need no login.
Plus: background-task (job) monitoring, configurable alerts (Slack / GitHub / email / webhook / Pushover / Telegram), multi-tenant orgs with role-based access, and a per-endpoint slow-threshold override.
## AI-First
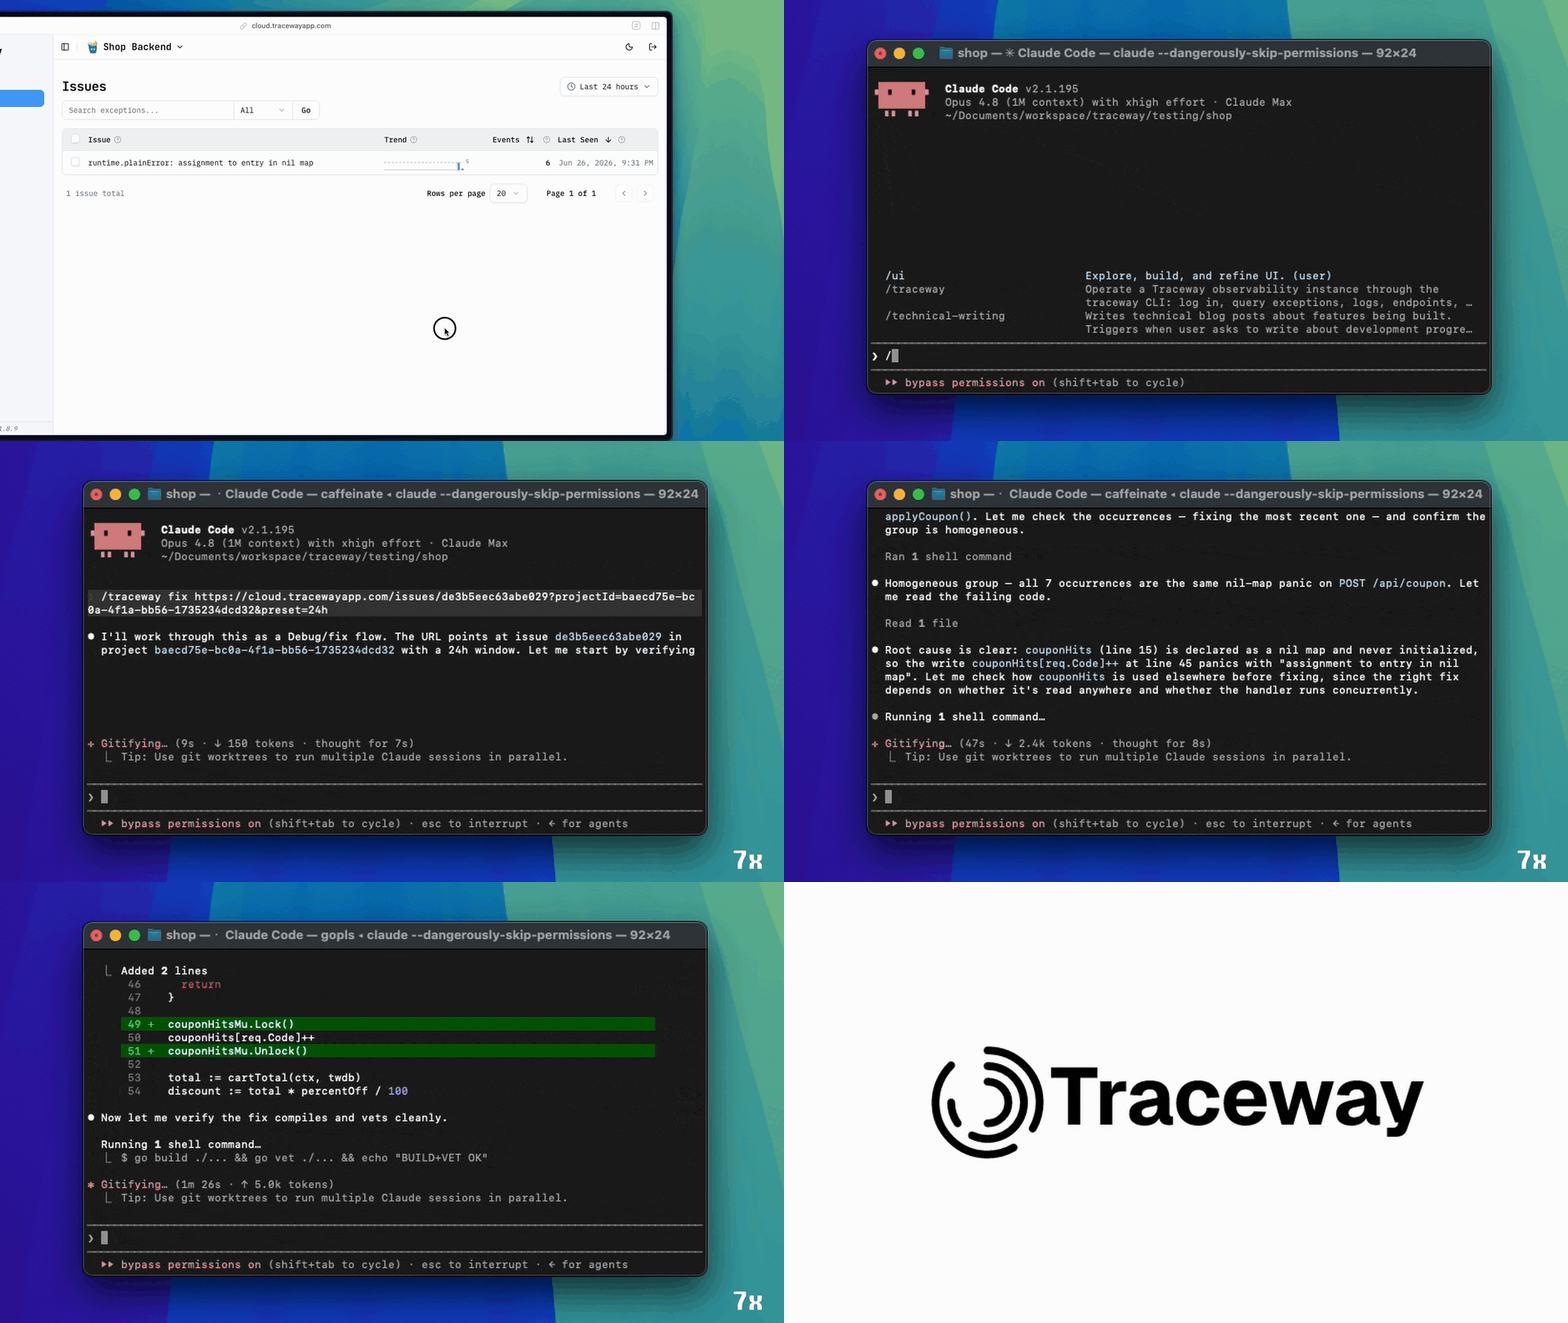
Your agent sets up Traceway, queries production telemetry, and finds the root cause:
```bash
npx skills add tracewayapp/traceway
```
One command installs two skills into Claude Code, Cursor, Codex, or any agent that reads `SKILL.md`:
- **`/traceway-setup`** reads your repo and wires it up: OTel for backends, Traceway SDKs for web and mobile. Then it verifies data actually arrives.
- **`/traceway`** installs the `traceway` CLI and uses it to query exceptions, logs, endpoints, and metrics, from bug report to root cause.
The [CLI](./cli) is designed for agents first: JSON when piped, tables on a TTY, stable error identifiers and exit codes, `--fields` to trim responses. It's read-only apart from archiving exceptions, which needs an explicit `--yes`. Nothing hangs, nothing gets damaged.
The skills are plain Markdown in [`skills/`](./skills), in the same MIT-licensed repo. No marketplace, no lock-in. [Learn more →](https://tracewayapp.com/product/agent-skills)
## Symbolication
`app.min.js:1:63` tells you nothing. Traceway resolves minified production errors back to the original file, line, and function the moment they arrive. The same engine handles stripped and obfuscated mobile crashes: iOS and Swift against the build's dSYM, Android against its R8 `mapping.txt`, Dart and Flutter against their obfuscation map.
The symbolicator is pure Go and built to keep up with ingest. Every debug artifact (a source map, a dSYM, an R8 mapping) compiles once into a binary `.tw` file and is memory-mapped from disk. Opening a compiled map takes under a microsecond, p99 lookup stays under a millisecond on a cold cache, and no map is re-parsed after a restart. The corpus is a disk budget, not a RAM budget.
The same engine ships as a standalone [OpenTelemetry Collector processor](./backend/app/symbolicator/otelprocessor), drop-in compatible with Honeycomb's `source_map_symbolicator`: same component type, same attribute contract, same config keys. Use it in your own pipeline, with or without Traceway behind it.
Upload source maps from CI with `npx traceway-sourcemaps --directory ./dist`; dSYMs and R8 mappings post to the same endpoint. Benchmarks live in [`benchmarks/`](./benchmarks); run them on your fork. [Learn more →](https://tracewayapp.com/product/symbolication)
## Why Traceway
| | Enterprise (Datadog / New Relic) | DIY OSS stack (Prometheus + Loki + Tempo + ...) | **Traceway** |
| ------------------------ | -------------------------------- | ----------------------------------------------- | --------------------------------- |
| **Pricing** | Per-event, per-host, per-seat | Free + ops time | Self-host free, fixed cloud tiers |
| **Setup** | Vendor SDK per language | Glue 6 tools together | `docker compose up -d` |
| **License** | Proprietary | Mixed (some BSL / open-core) | **MIT, no asterisks** |
| **OTel** | Wrapped in vendor SDK | OTel Collector required | **Native OTLP/HTTP ingest** |
| **Replay + traces + AI** | 3 separate products | Wire it yourself | One system, one trace ID |
## Quick Start
### Self-host with Docker (recommended)
```bash
git clone https://github.com/tracewayapp/traceway
cd traceway && docker compose up -d
# ✓ dashboard at http://localhost
```
Point any OTel SDK at `http://localhost/api/otel/v1/traces` (or `/metrics`, `/logs`) and traces start flowing. See the [self-hosting docs](https://docs.tracewayapp.com/server/docker-compose) for production deployment, TLS, and storage configuration.
Prefer a single container with no external databases? The [SQLite image](https://docs.tracewayapp.com/server/sqlite) is the smallest deployment. The [DuckDB image](https://docs.tracewayapp.com/server/duckdb) keeps the same zero-dependency setup but adds a columnar telemetry store for far more dashboard headroom. Run either with `docker compose -f docker-compose.sqlite.yml up -d` or `-f docker-compose.duckdb.yml`.
**Docker images are cryptographically signed with Cosign.**
### Embedded mode (inside your Go app)
Run Traceway inside your Go process. No Docker, no external databases, SQLite under the hood:
```bash
go get github.com/tracewayapp/traceway/backend
```
```go
import tracewaybackend "github.com/tracewayapp/traceway/backend"
func main() {
go tracewaybackend.Run(
tracewaybackend.WithPort(8082),
tracewaybackend.WithDefaultUser("admin@localhost.com", "admin"),
tracewaybackend.WithDefaultProject("My App", "opentelemetry", "dev-token"),
)
// ... start your app, point its OTel exporter to http://localhost:8082/api/otel/v1/traces
}
```
Open `http://localhost:8082`, log in, and hit your app to see traces appear. Full walkthrough in the [embedded mode guide](https://docs.tracewayapp.com/learn/embedded-mode), or check the working examples ([OTel exporter](./examples/embedded-backend-otel) or [Go client SDK](./examples/embedded-backend-go-client)).
## Supported Integrations
Traceway integrates with the tools you already use. Every integration ships traces, metrics, and logs over **OTLP/HTTP**. No proprietary SDK required.
> View the full list in the [documentation](https://docs.tracewayapp.com/client). Missing a framework? [Open an issue](https://github.com/tracewayapp/traceway/issues) to request it.
### Backend
## Tech Stack
| Component | Technology |
| ------------- | ----------------------------------------------------- |
| Backend | Go 1.25, Gin |
| Frontend | SvelteKit 2, Svelte 5, Tailwind CSS v4 |
| Telemetry DB | ClickHouse (standalone), SQLite or DuckDB (embedded) |
| Relational DB | PostgreSQL (standalone) or SQLite (embedded) |
| Ingest | OTLP/HTTP (Protobuf + JSON) for traces, metrics, logs |
## Project Structure
| Directory | Description |
| ----------- | --------------------------------------------------------------------------------------------------------------------------------------------------------------------------------------------------------------------------------------- |
| `backend/` | Go/Gin API server: OTLP ingest, REST API, notifications, migrations |
| `frontend/` | SvelteKit 2 dashboard SPA |
| `cli/` | Agent-first `traceway` command line for querying exceptions, logs, endpoints, and metrics |
| `skills/` | Agent skills (`/traceway-setup`, `/traceway`) for Claude Code, Cursor, Codex, and any SKILL.md-compatible agent |
| `docs/` | Documentation site (Nextra) |
| `examples/` | Working examples: embedded mode ([OTel](./examples/embedded-backend-otel), [Go client](./examples/embedded-backend-go-client)) and OTel-instrumented apps ([Express](./examples/express-otel), [NestJS](./examples/nestjs-otel), [Next.js](./examples/nextjs-otel), [Hono](./examples/hono-otel)) |
| `website/` | Landing page |
## Build Tags
Storage is selected on two axes: the telemetry store and the transactional (relational) store.
| Tag | Purpose |
| ------------------ | --------------------------------------------------------------------------------------------------------------- |
| _(none)_ | SQLite storage on both axes: embedded mode, zero dependencies. This is the default. |
| `telemetry_duckdb` | DuckDB telemetry store: embedded mode with a columnar engine. Requires `CGO_ENABLED=1`. |
| `transactional_pg telemetry_ch` | ClickHouse (telemetry) + PostgreSQL (config) for standalone server mode. |
| `localdist` | Embeds frontend from `static/dist/` instead of `static/frontend/`. Used by traceway-cloud to inject billing UI. |
```bash
# Embedded mode (SQLite, default)
cd backend && go build ./cmd/traceway
# Embedded mode with DuckDB telemetry
cd backend && CGO_ENABLED=1 go build -tags telemetry_duckdb ./cmd/traceway
# Standalone server (ClickHouse + PostgreSQL)
cd backend && go build -tags "transactional_pg telemetry_ch" ./cmd/traceway
```
## Running Tests
```bash
# SQLite tests (default, no tags needed)
cd backend && go test -v -count=1 ./app/repositories/...
# ClickHouse + PostgreSQL tests (requires Docker)
./scripts/test-backend-pgch.sh
# DuckDB telemetry tests
cd backend && CGO_ENABLED=1 go test -tags telemetry_duckdb -v -count=1 ./app/repositories/...
# OTEL trace converter tests (no DB required)
cd backend && go test -v -count=1 ./app/controllers/otelcontrollers/
# Update OTEL golden files after intentional converter changes
cd backend && go test -v -count=1 ./app/controllers/otelcontrollers/ -args -update
```
## Documentation
Full documentation at **[docs.tracewayapp.com](https://docs.tracewayapp.com)**:
- [**Client SDKs**](https://docs.tracewayapp.com/client): OpenTelemetry, Go, Node.js, Python, and more
- [**Self-Hosting**](https://docs.tracewayapp.com/server): Docker Compose and production deployment
- [**Concepts**](https://docs.tracewayapp.com/learn): How tracing, exception fingerprinting, metrics, and alerts work
- [**Embedded Mode**](https://docs.tracewayapp.com/learn/embedded-mode): Run Traceway inside your Go app
## Community
Traceway is built in the open, and the **[Discord community](https://discord.gg/RZq9NT62nc)** is where it happens. Come say hi, whether you're kicking the tires, running it in production, or just curious. We use it to:
- 🗣️ **Talk through ideas**: feature requests, integration asks, roadmap input
- 🛟 **Help each other out**: setup, OTel wiring, deployment questions
- 🚀 **Show & tell**: share what you're building and how you're using Traceway
- 🐛 **Catch bugs early**: report issues and get fast feedback from maintainers
- 👀 **Get the inside scoop**: sneak peeks at what's shipping next
## Contribute
Contributions are welcome. Pull requests get reviewed and merged. If you're not sure where to start or want to discuss an idea first, [open an issue](https://github.com/tracewayapp/traceway/issues) or drop by the [community Discord](https://discord.gg/RZq9NT62nc) and we'll talk it through.
## Links
- [Website](https://tracewayapp.com)
- [Documentation](https://docs.tracewayapp.com)
- [Traceway Cloud](https://cloud.tracewayapp.com): managed hosting (same MIT code, run by us)
- [Community Discord](https://discord.gg/RZq9NT62nc): chat with the team and other users

 OpenTelemetry