---
title: "Miscellaneous Topics"
subtitle: "Econ 425T"
author: "Dr. Hua Zhou @ UCLA"
date: "`r format(Sys.time(), '%d %B, %Y')`"
format:
html:
theme: cosmo
embed-resources: true
number-sections: true
toc: true
toc-depth: 4
toc-location: left
code-fold: false
engine: knitr
knitr:
opts_chunk:
fig.align: 'center'
# fig.width: 6
# fig.height: 4
message: FALSE
cache: false
---
Some important topics not covered in this course.
## Dimensionality reduction
Dimensionality reduction can be a helpful method for exploratory data analysis as well as modeling (feature engineering).
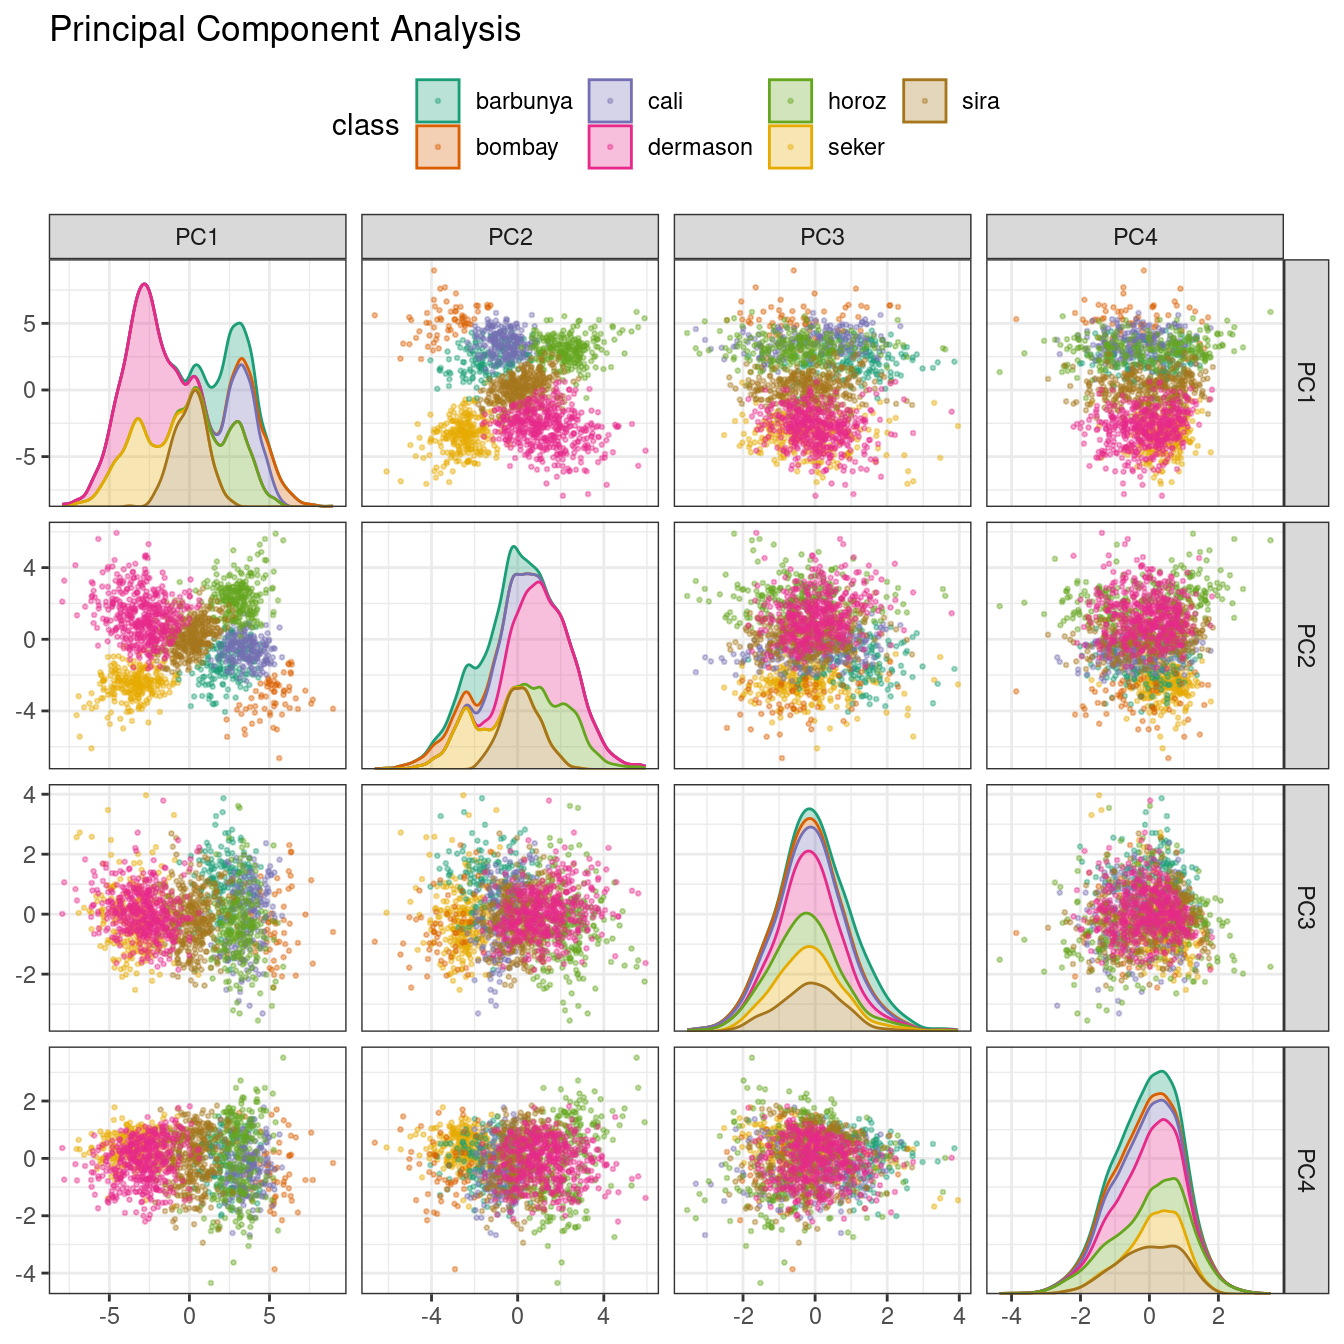
### Principal component analysis (PCA)
[Scikit-Learn](https://scikit-learn.org/stable/modules/generated/sklearn.decomposition.PCA.html)
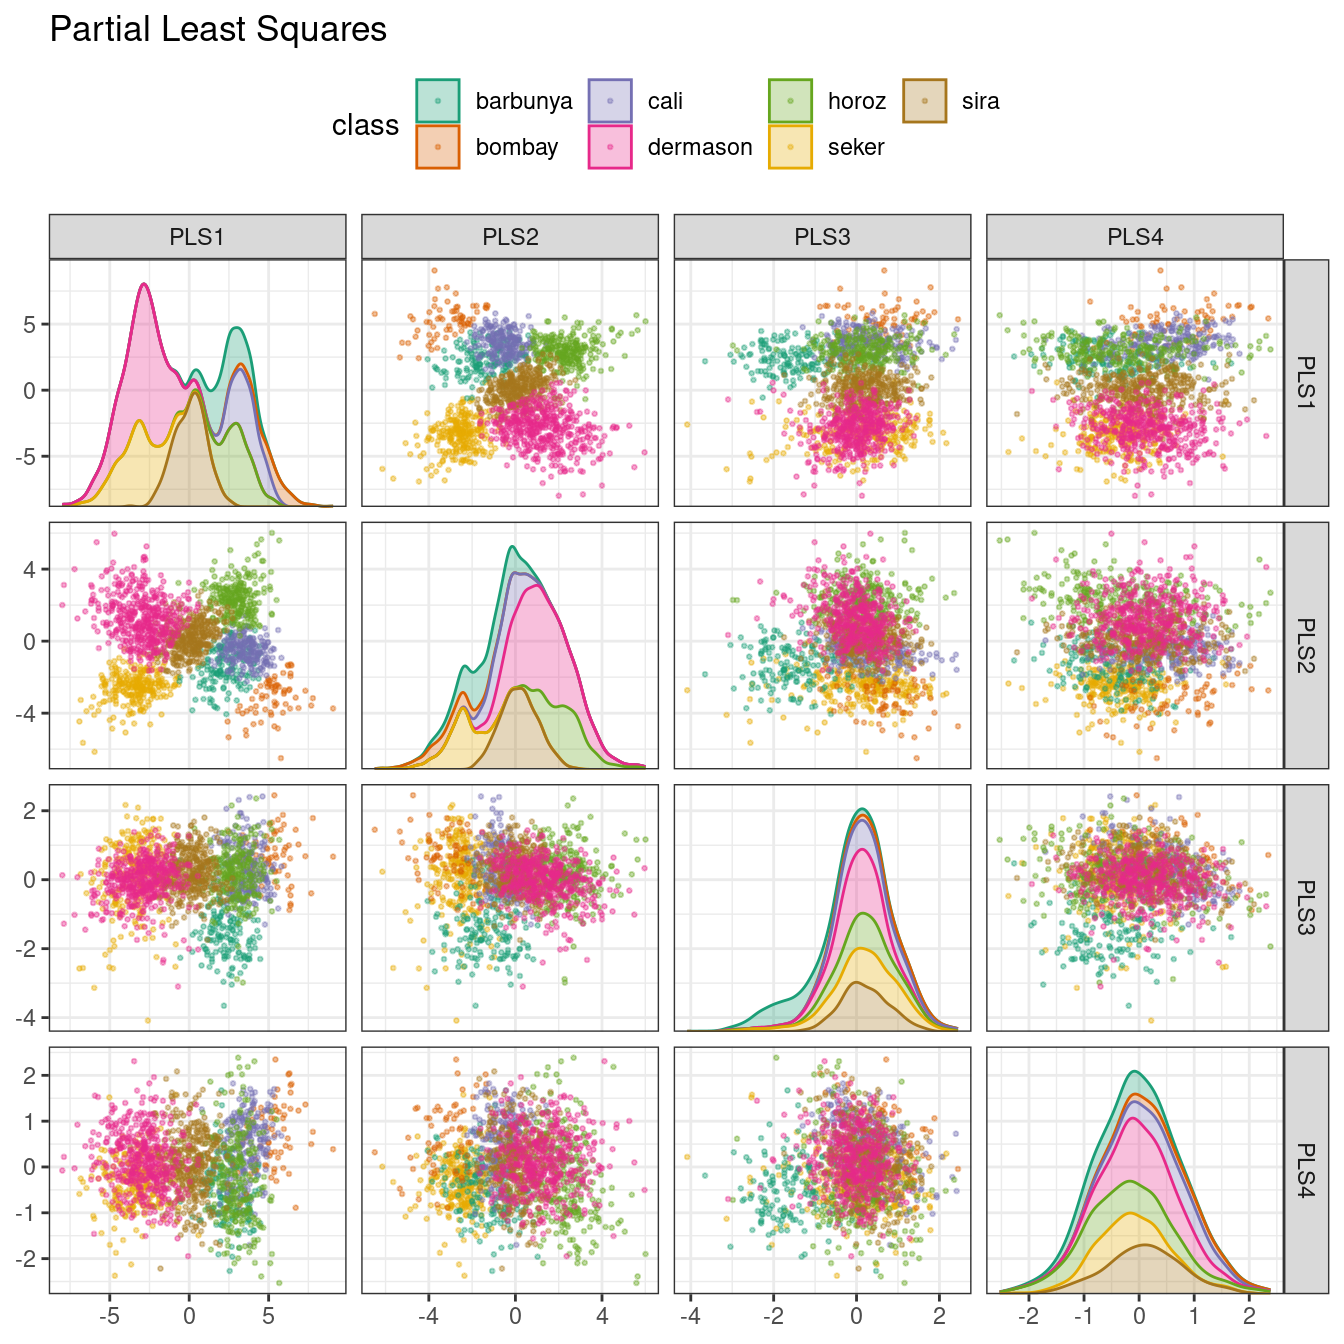
### Partial least squares (PLS)
PLS is a supervised version of PCA.
[Scikit-Learn](https://scikit-learn.org/stable/modules/generated/sklearn.cross_decomposition.PLSRegression.html)
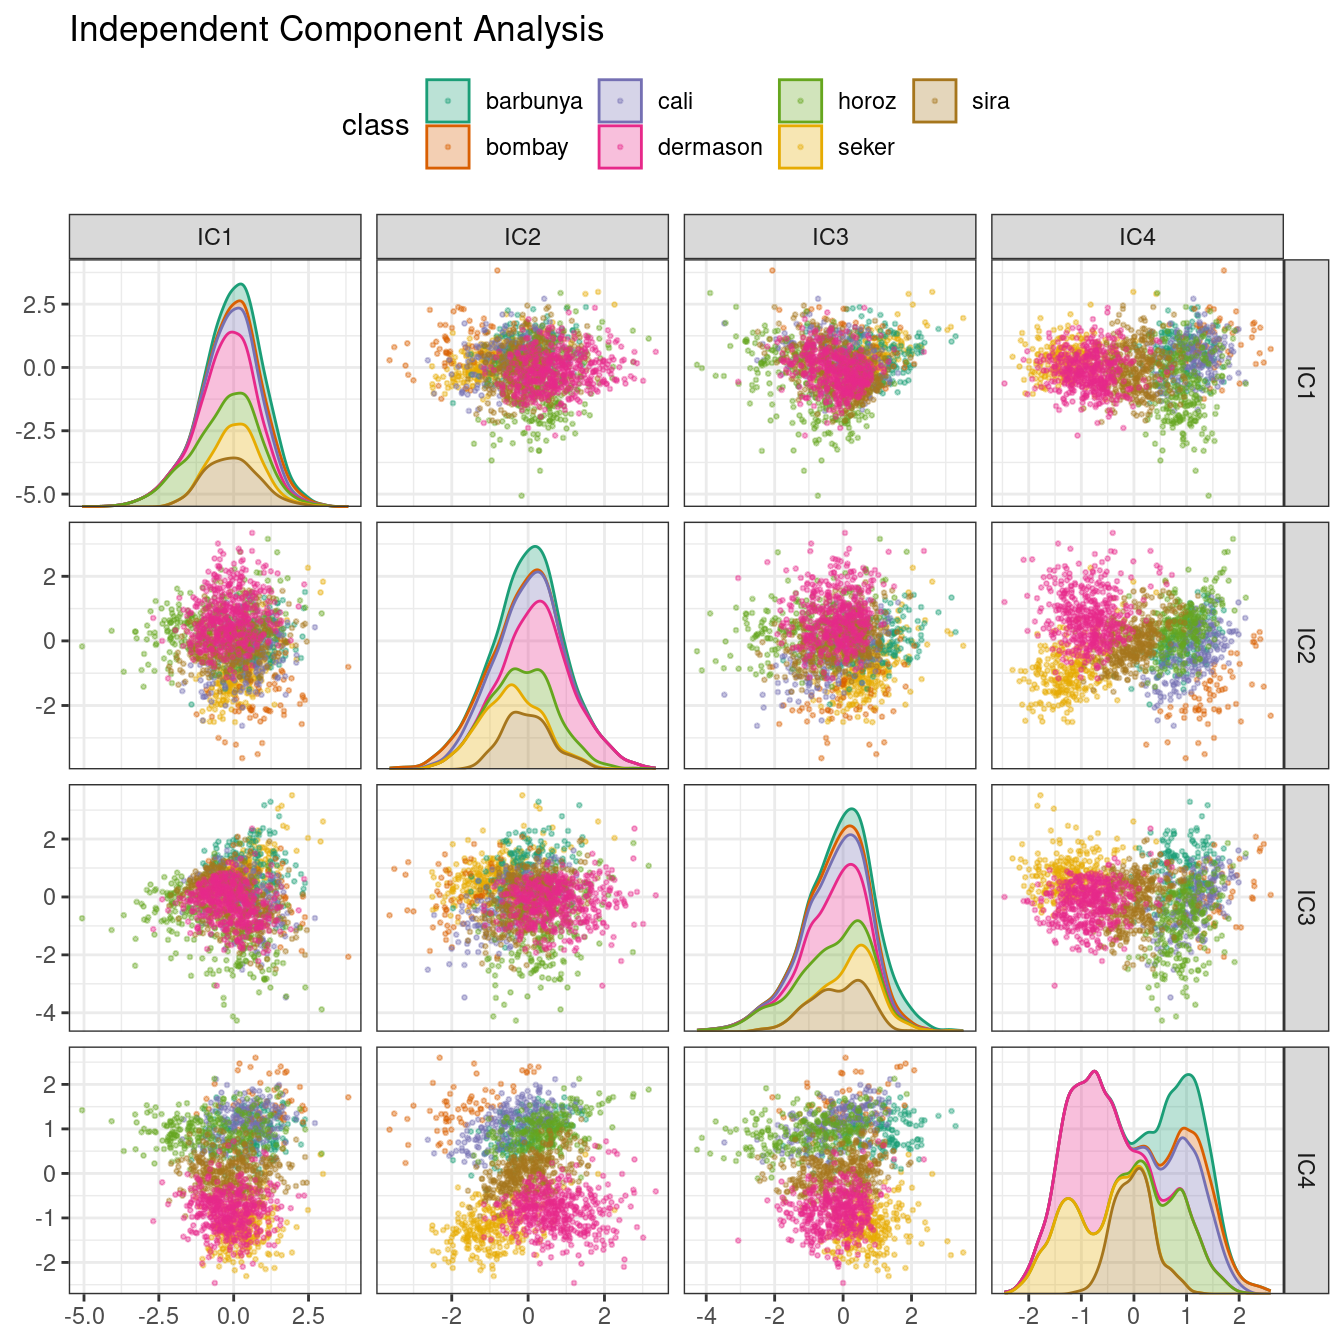
### Independent component analysis (ICA)
ICA is slightly different than PCA in that it finds components that are as statistically independent from one another as possible (as opposed to being uncorrelated). It can be thought of as maximizing the “non-Gaussianity” of the ICA components, or separating information instead of compressing information like PCA.
[Scikit-Learn](https://scikit-learn.org/stable/modules/generated/sklearn.decomposition.FastICA.html)
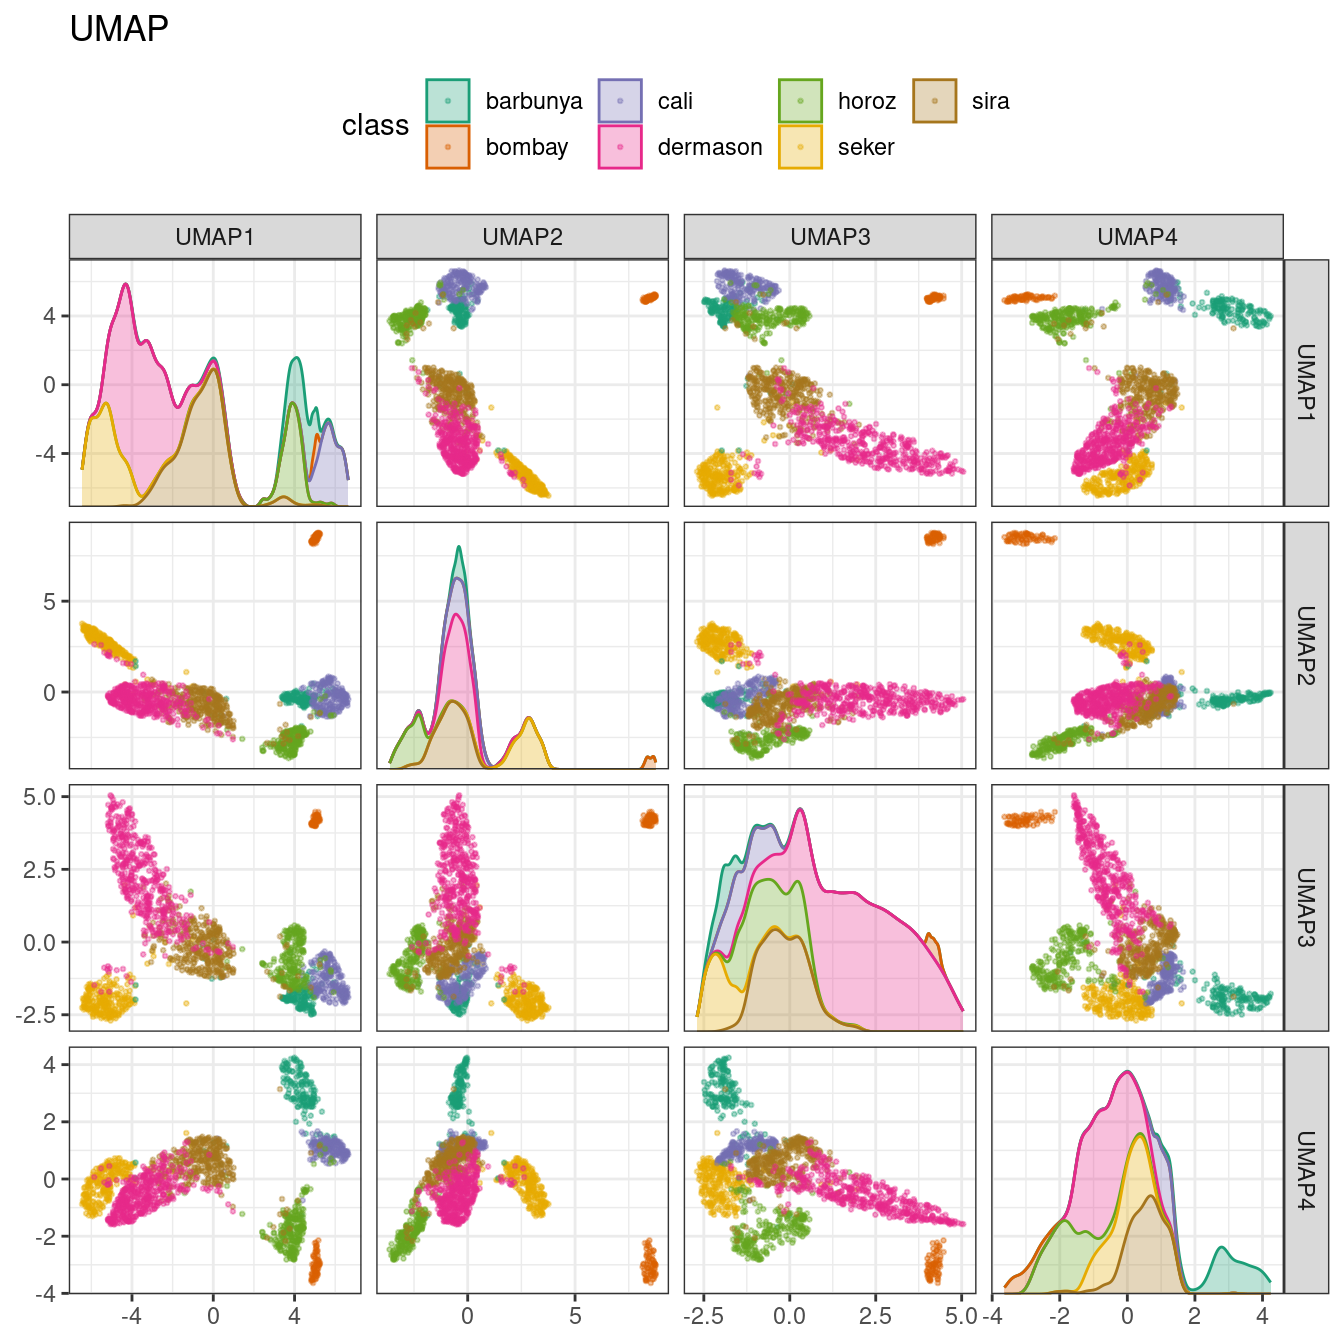
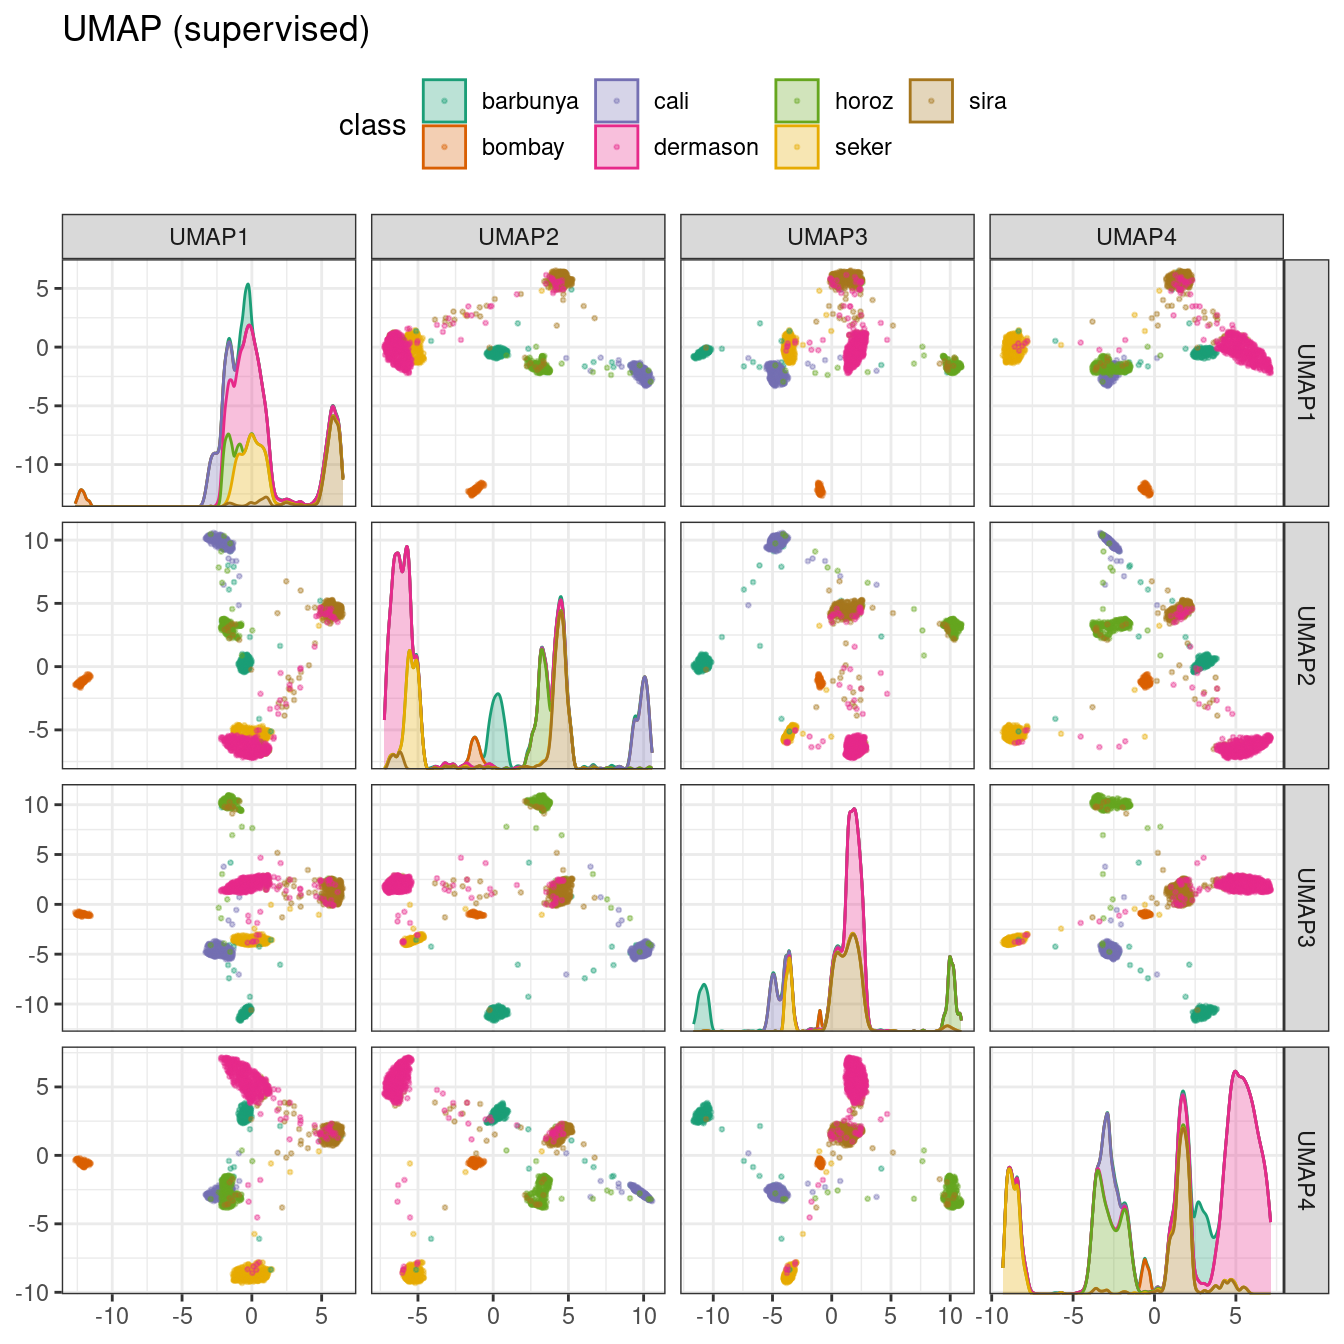
### Uniform manifold approximation and projection (UMAP)
UMAP is similar to the popular t-SNE method for nonlinear dimension reduction. In the original high-dimensional space, UMAP uses a distance-based nearest neighbor method to find local areas of the data where the data points are more likely to be related. The relationship between data points is saved as a directed graph model where most points are not connected.
[Software](https://umap-learn.readthedocs.io/en/latest/index.html)
## Matrix completion
[Introduction](https://ucla-econ-425t.github.io/2023winter/slides/01-intro/intro.html#example-the-netflix-prize)
## Clustering
* Clustering looks for homogeneous subgroups among the observations.
* It can be applied to market segmentation. Can I classify my customers into different groups so I can devise group-specific advertisement strategies?
### K-means clustering
[Introduction](https://ucla-econ-425t.github.io/2023winter/slides/12-unsupervised/unsupervised.html#k-means-clustering)
[Scikit-Learn](https://scikit-learn.org/stable/modules/generated/sklearn.cluster.KMeans.html)
### Hierarchical clustering
[Introduction](https://ucla-econ-425t.github.io/2023winter/slides/12-unsupervised/unsupervised.html#hierarchical-clustering)
[Scikit-Learn](https://scikit-learn.org/stable/modules/generated/sklearn.cluster.AgglomerativeClustering.html#sklearn.cluster.AgglomerativeClustering)
### Spectral clustering
[Scikit-Learn](https://scikit-learn.org/stable/modules/generated/sklearn.cluster.SpectralClustering.html#sklearn.cluster.SpectralClustering)
### A 2D numerical example for comparing clustering methods
[Source](https://scikit-learn.org/stable/auto_examples/cluster/plot_cluster_comparison.html#sphx-glr-auto-examples-cluster-plot-cluster-comparison-py)

## Survival analysis (ISL Chapter 11)
- Survival analysis is a class of statistical methods that analyze time-to-events. Although survival analysis was originally motivated by medical studies, it has many business applications.
- Consider a company that wishes to model **churn**, the process by which customers cancel subscription to a service. The company might collect data on customers over some time period, in order to model each customer’s time to cancellation as a function of demographics or other predictors. However, presumably not all customers will have canceled their subscription by the end of this time period; for such customers, the time to cancellation is **censored**.
- Time from advertisement to product purchase.
- Time to publication:
::: {#fig-survival-publication}
{width=600px height=400px}
For the Publication data, we display survival curves for time until publication, stratified by whether or not the study produced a positive result, after adjusting for all other covariates.
:::
## A/B testing
- Business analog of randomized clinical trials (RCT).
- Which design element on my webpage leaves the maximum impact and drives business metrics?
## Causal analysis
- A huge and actively growing area in econometrics, epidemiology, and statistics.
- The book _Mostly Harmless Econometrics: An Empiricist's Companion_ by Angrist and Pischke serves an excellent introduction.
- Modern instrumental variable (IV) analysis by **double machine learning**.
- Classical IV model:
\begin{eqnarray*}
y_i &=& \beta_0 + d_i \alpha + \sum_{j=1}^p \beta_j x_{ij} \epsilon_i \\
d_i &=& g(z_i) + v_i \quad \text{(first stage)}
\end{eqnarray*}
$d_i$ is the policy/treatment variable; $z_i$ are instrumental variables.
- Double machine learning handles modern applications where there are many instruments $z_i$ and many control variables $x_{i}$.
- [Paper](https://arxiv.org/abs/1608.00060).
## Conformal prediction
- In all supervised learning examples we've done so far, there's no quantification of uncertainty. How confident when my neural network says this image is a cat?
- Conformal prediction is a statistical technique for producing prediction sets without assumptions on the predictive algorithm (often a machine learning system) and only assuming exchangeability of the data.
- Prof. Ryan Tibshirani (UC Berkeley)'s [slides](https://www.stat.cmu.edu/~ryantibs/talks/conformal-2022.pdf) are an excellent introduction.
## Knockoffs
A new variable selection method with controlled false discovery rate.