# 🛡️ Guardian
**A self-hosted dashboard for a Docker homelab — server telemetry, container health, and an app launcher in one page.**
[🌐 **Live Website & Quick Install Guide**](https://vineetkishore01.github.io/Guardian/) · [📦 **GHCR Container Package**](https://github.com/vineetkishore01/Guardian/pkgs/container/guardian)
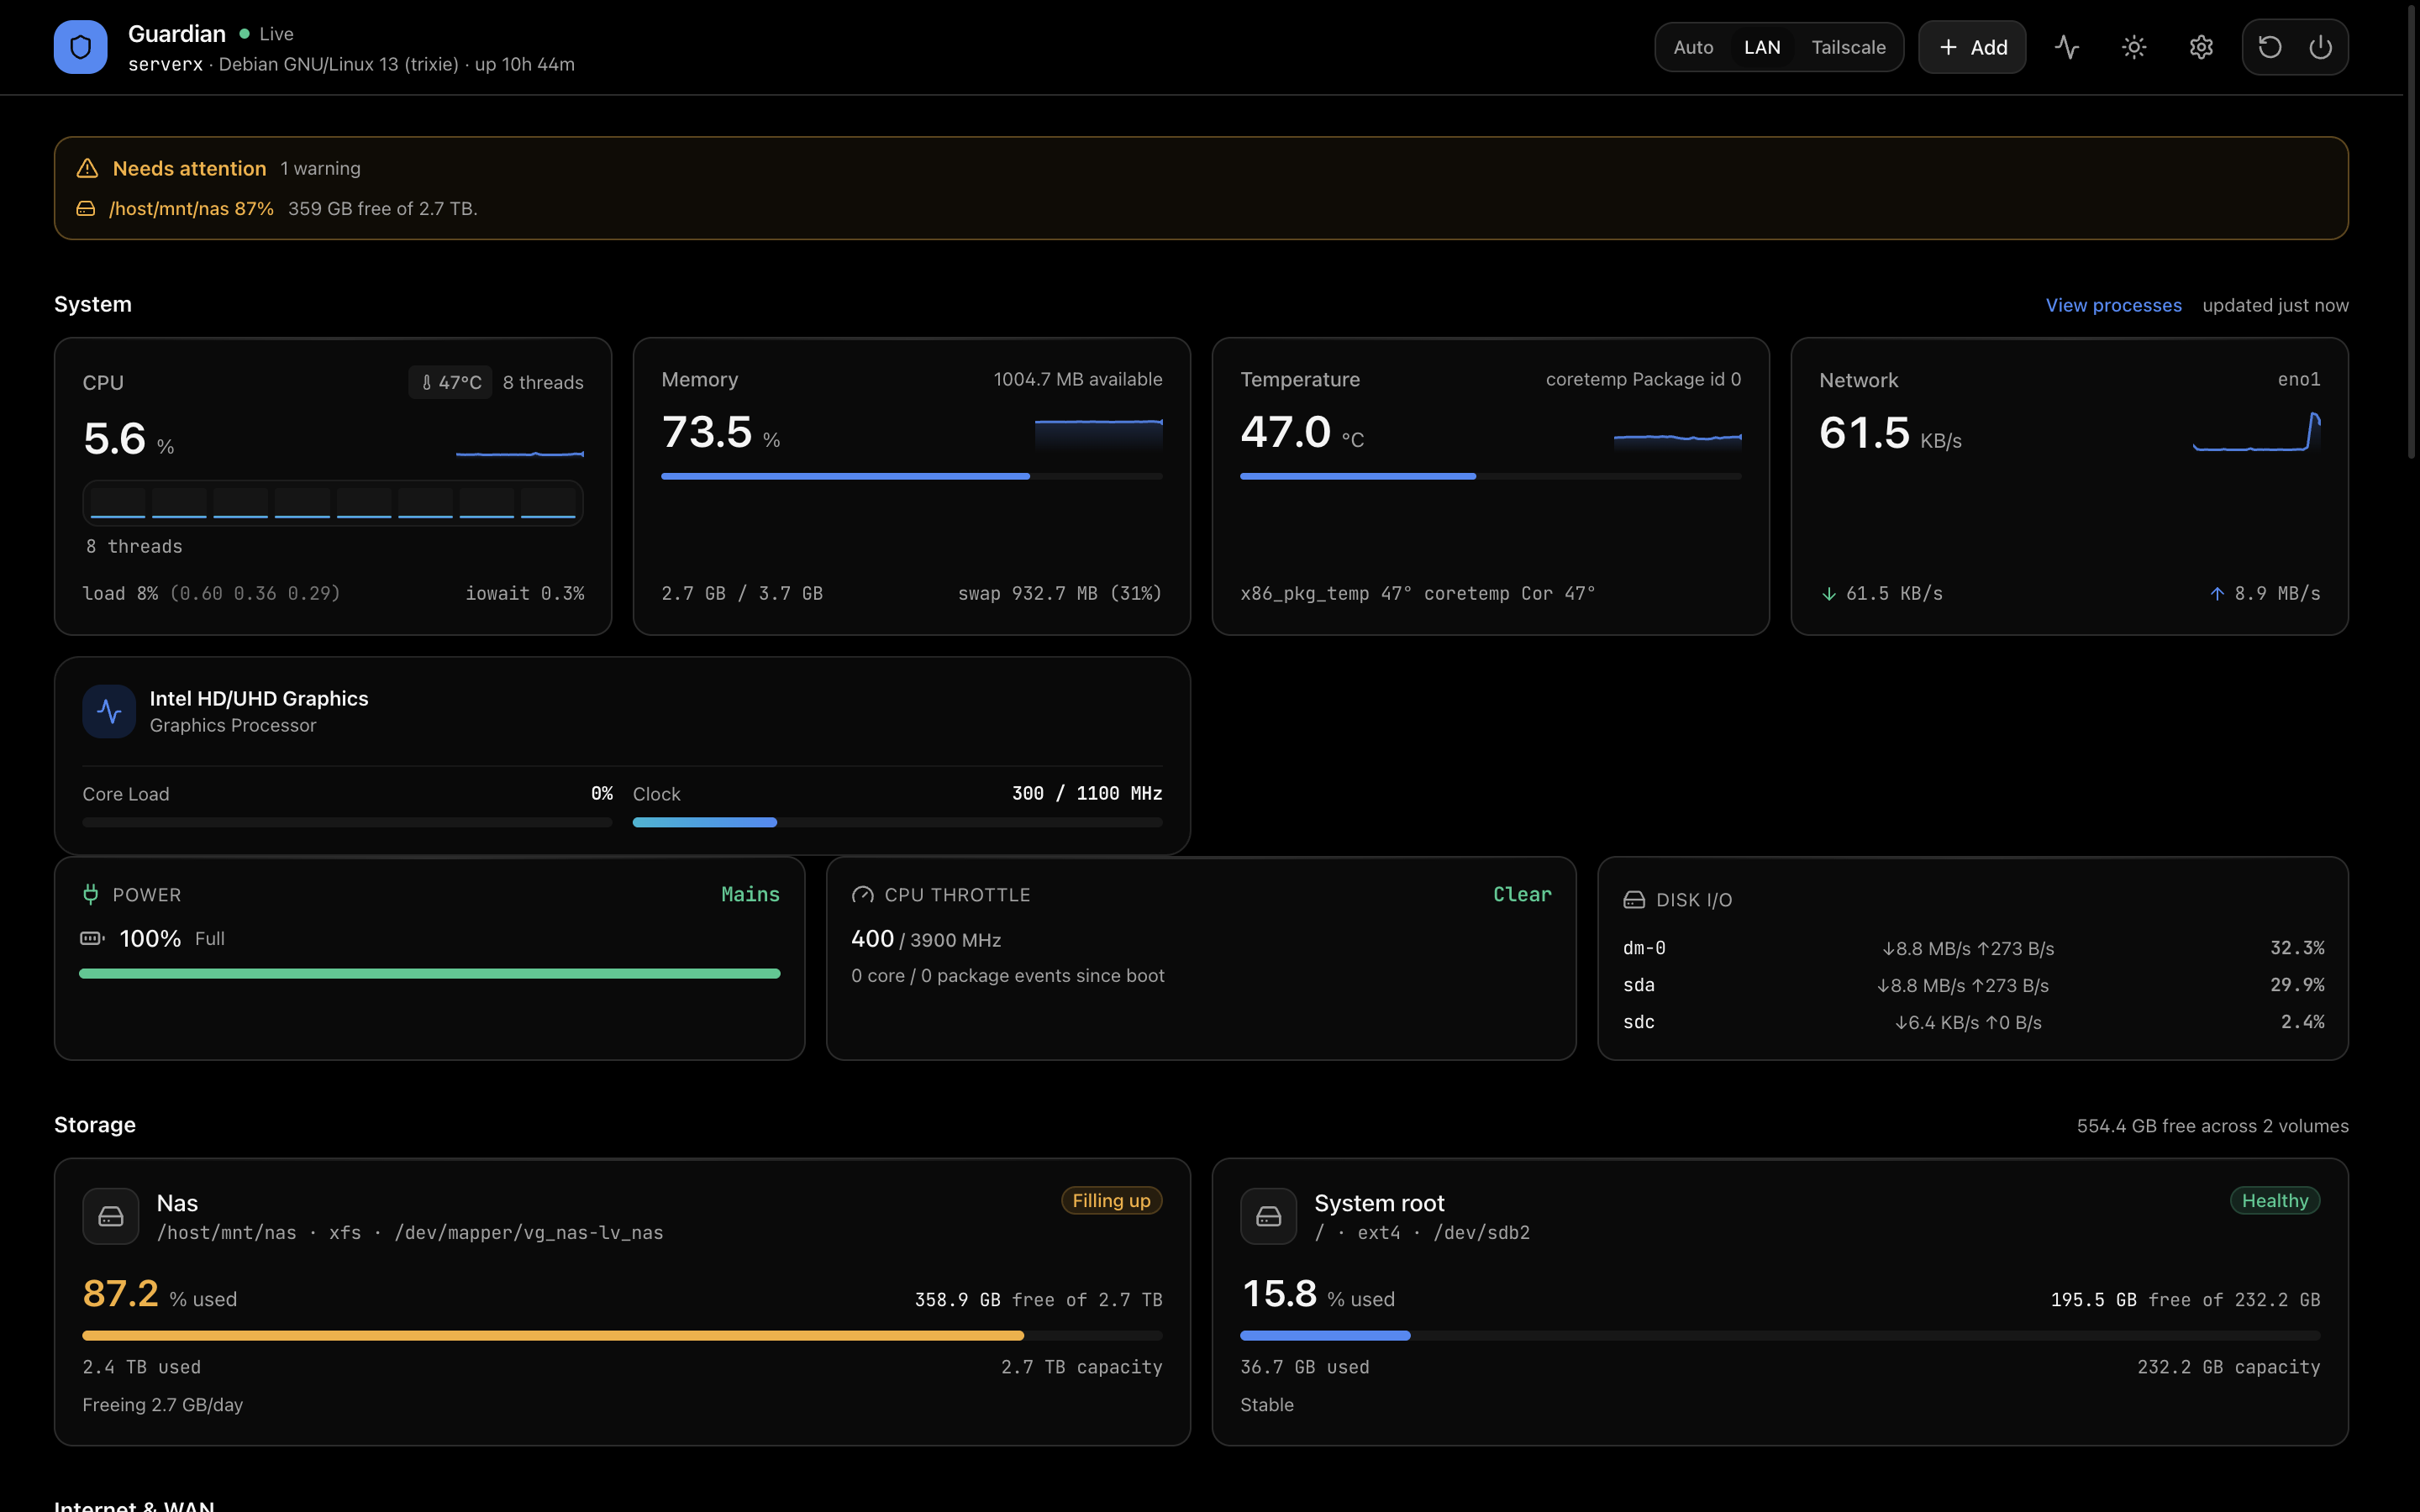
Guardian reads your machine directly: `/proc` and `/sys` for host metrics, the Docker socket for containers. No agent, no database, no cloud. It runs in about 40 MB of RAM and pushes updates over Server-Sent Events rather than polling.
---
## Contents
- [Showcase](#showcase)
- [What it does](#what-it-does)
- [How it works](#how-it-works)
- [Quick start](#quick-start)
- [Environment variables](#environment-variables)
- [Enabling shutdown and reboot](#enabling-shutdown-and-reboot)
- [Runtime settings](#runtime-settings)
- [API reference](#api-reference)
- [Local development](#local-development)
- [Design notes](#design-notes)
- [Project layout](#project-layout)
---
## Showcase
| Dashboard & Host Telemetry | App Launcher & In-Tile Widgets |
|:---:|:---:|
| [](docs/screenshots/01-dashboard-overview.png) | [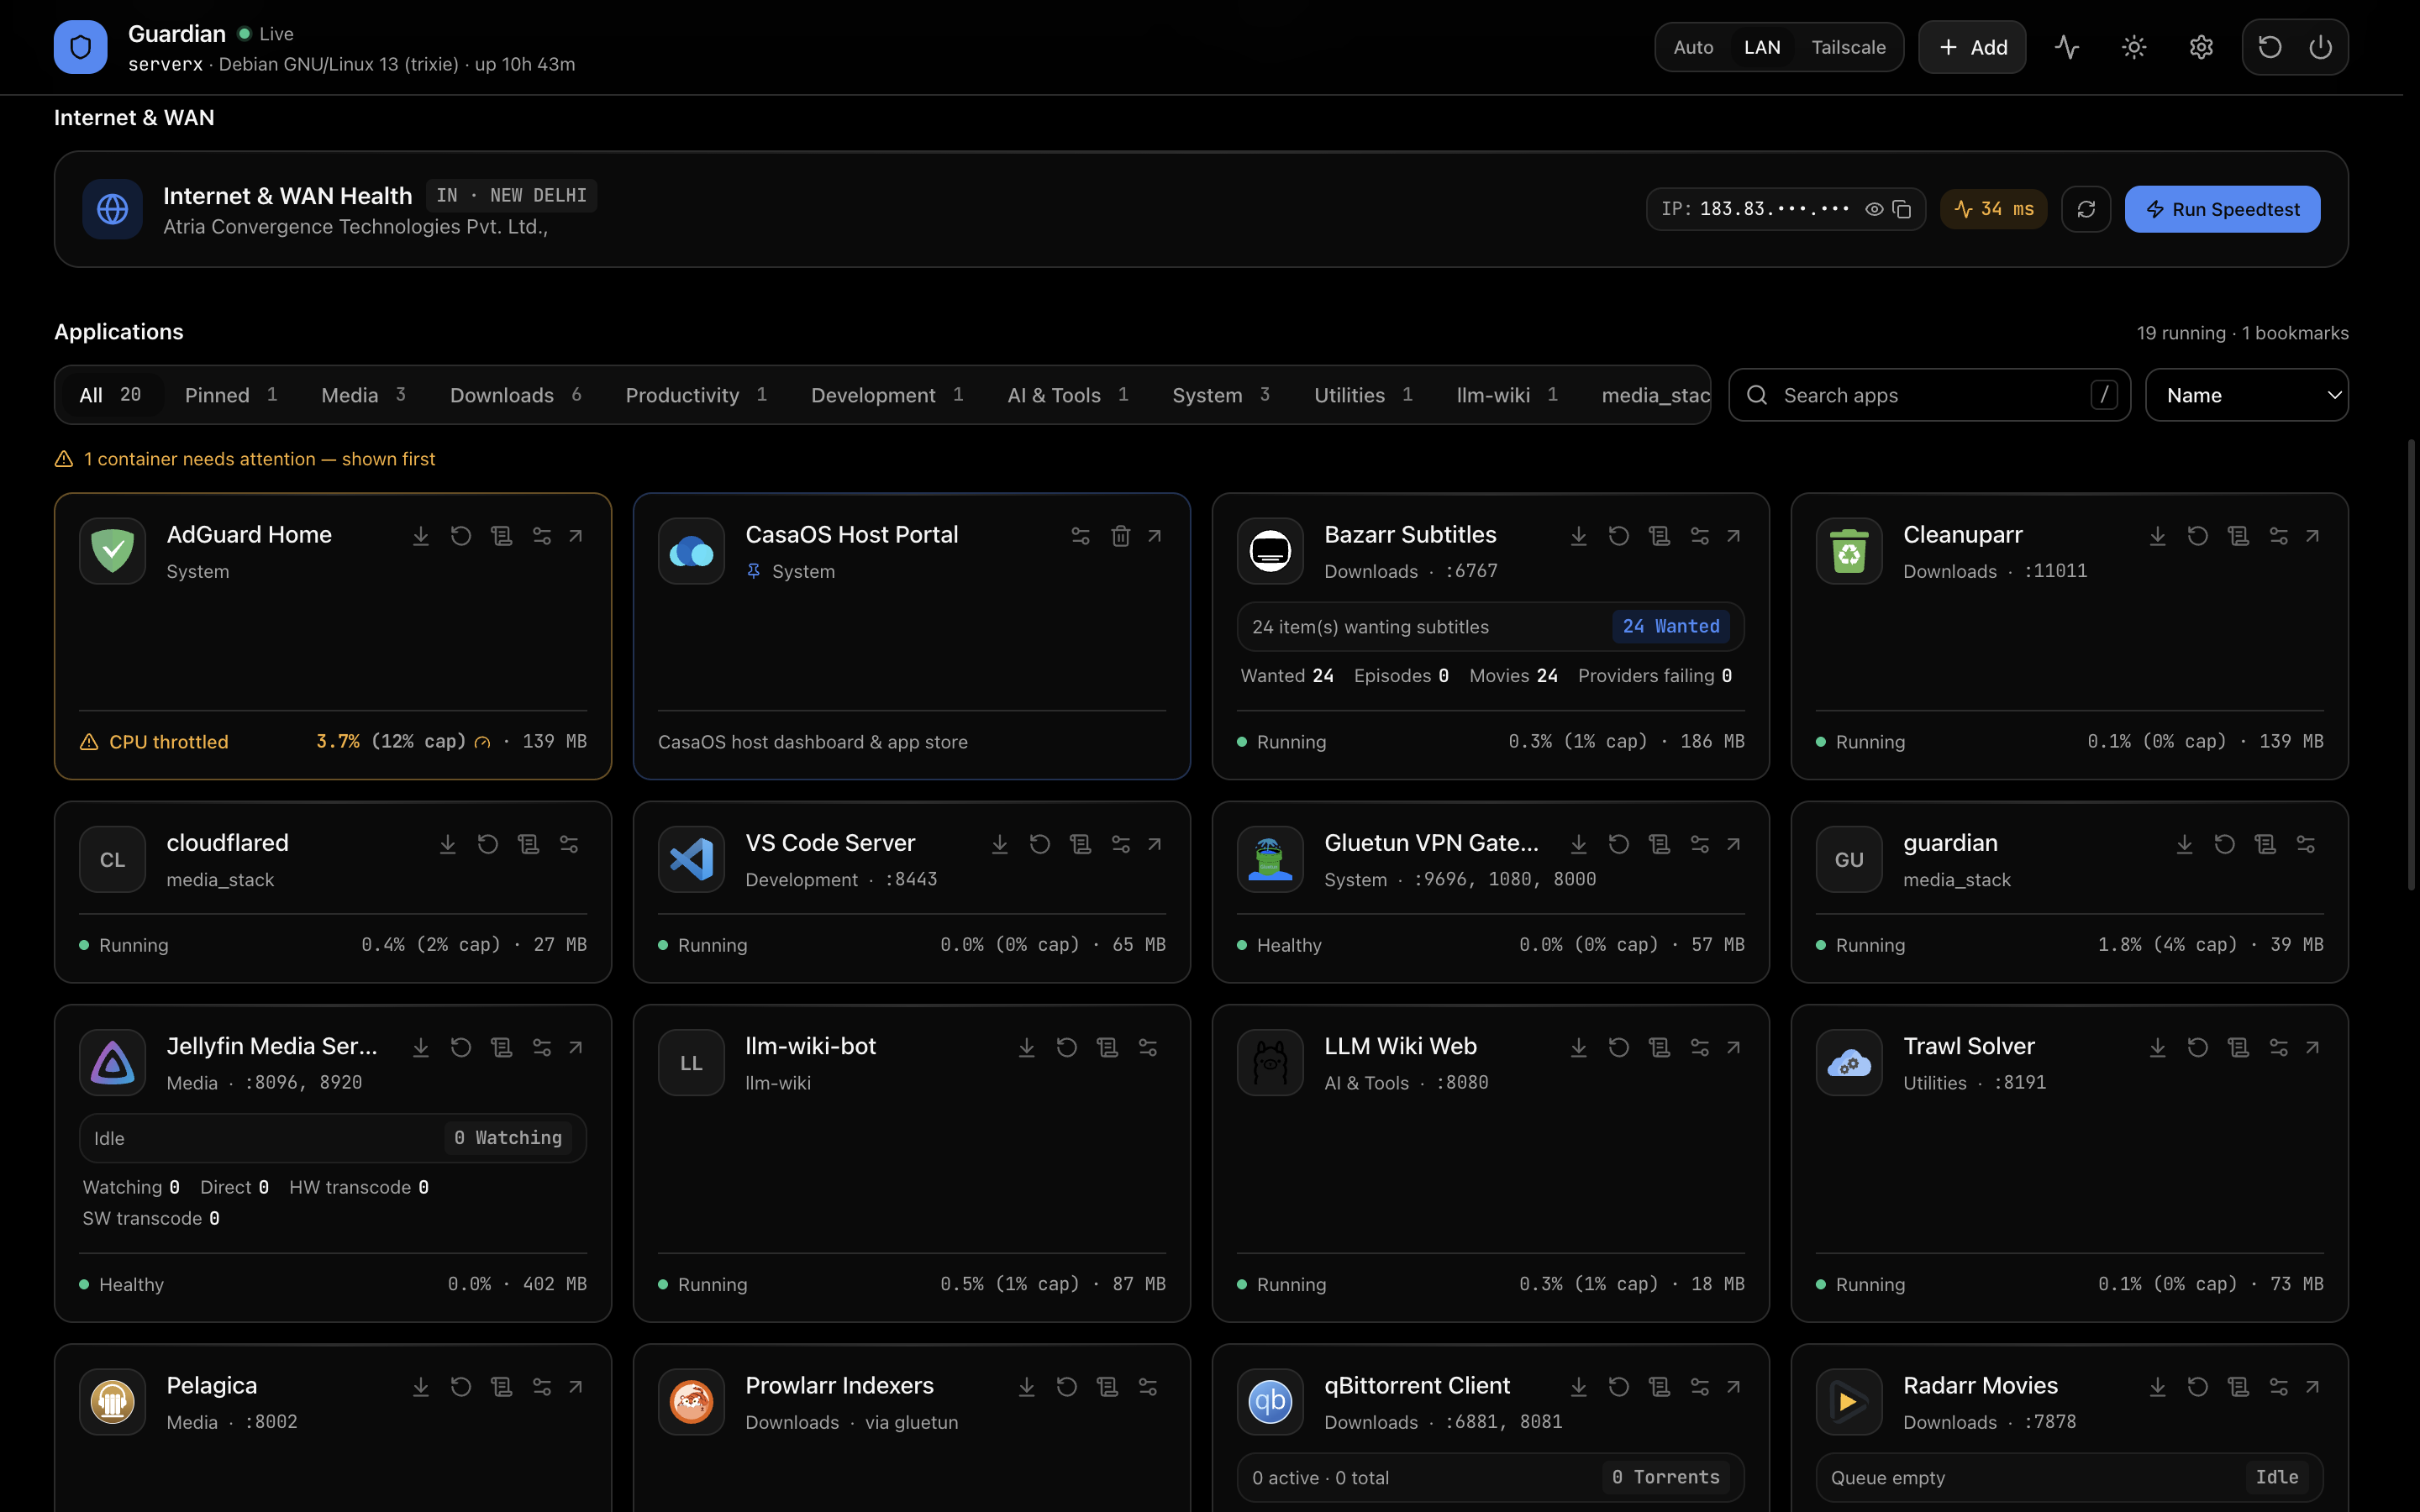](docs/screenshots/02-app-launcher.png) |
| *Real-time telemetry, Intel GPU stats, power, and storage gauges* | *App launcher with live in-tile widgets (Jellyfin, Bazarr, etc.)* |
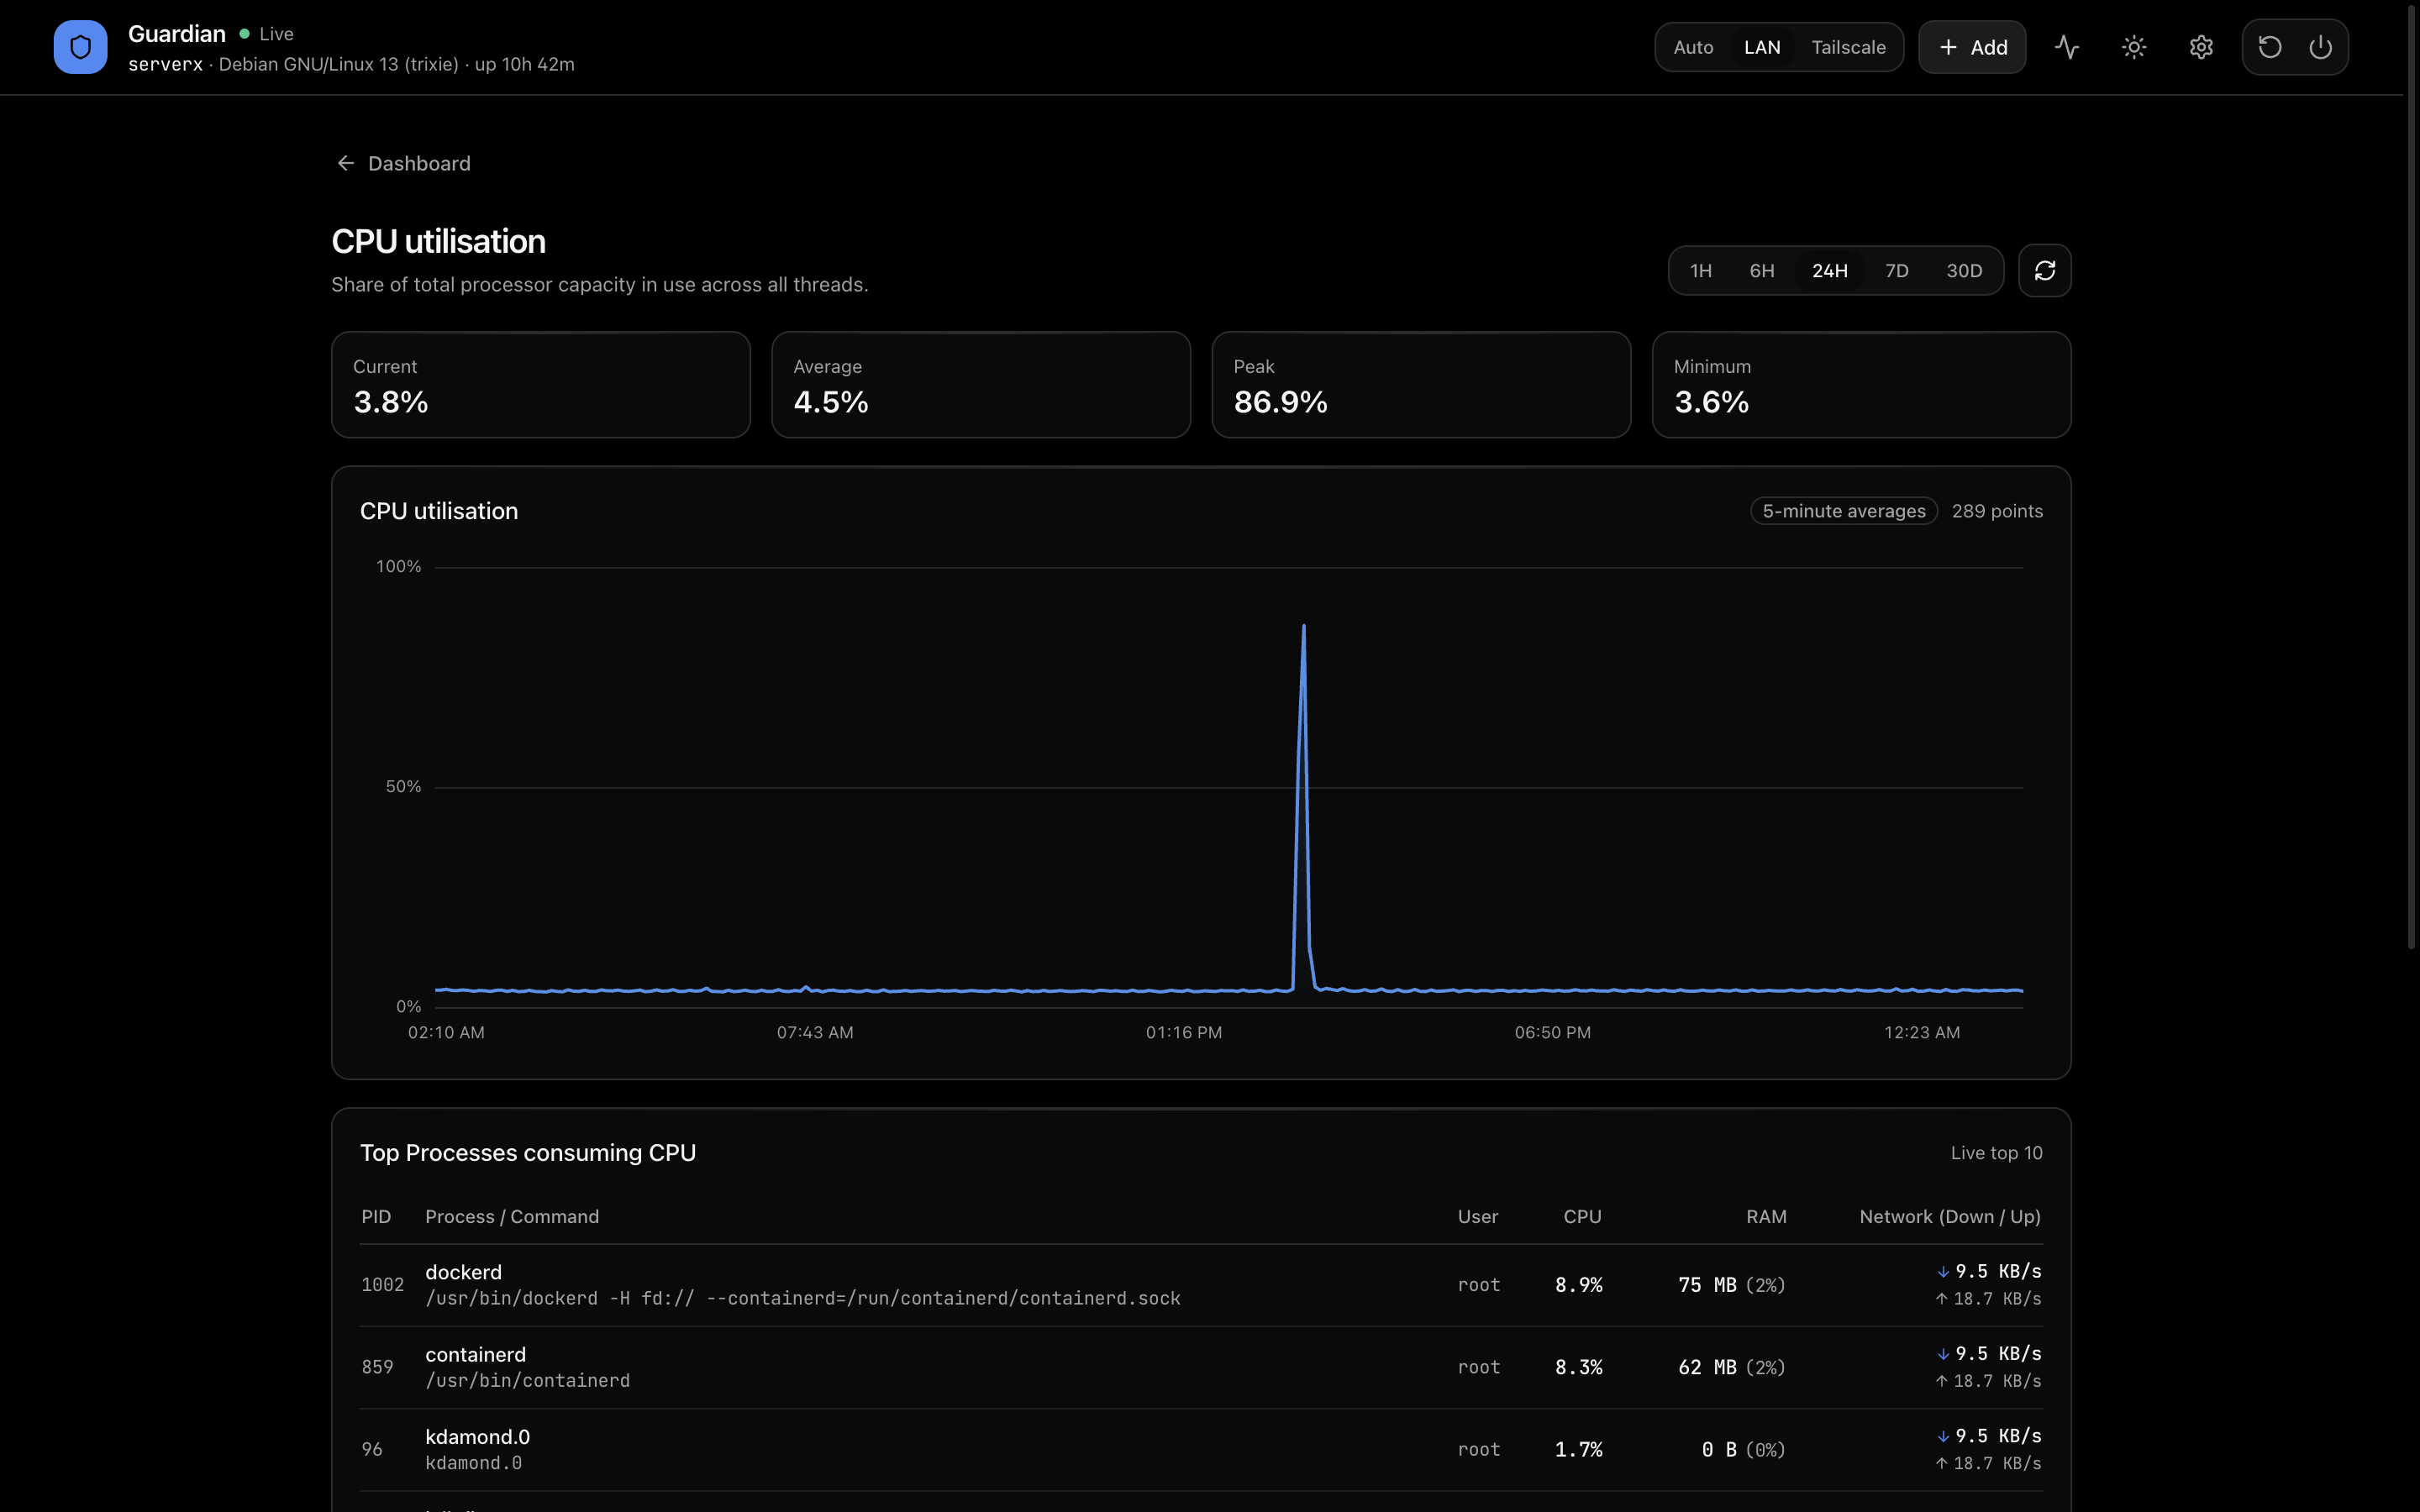
| Historical Metrics & Interactive Analytics | Host & Container Process Monitor |
|:---:|:---:|
| [](docs/screenshots/03-metric-telemetry.png) | [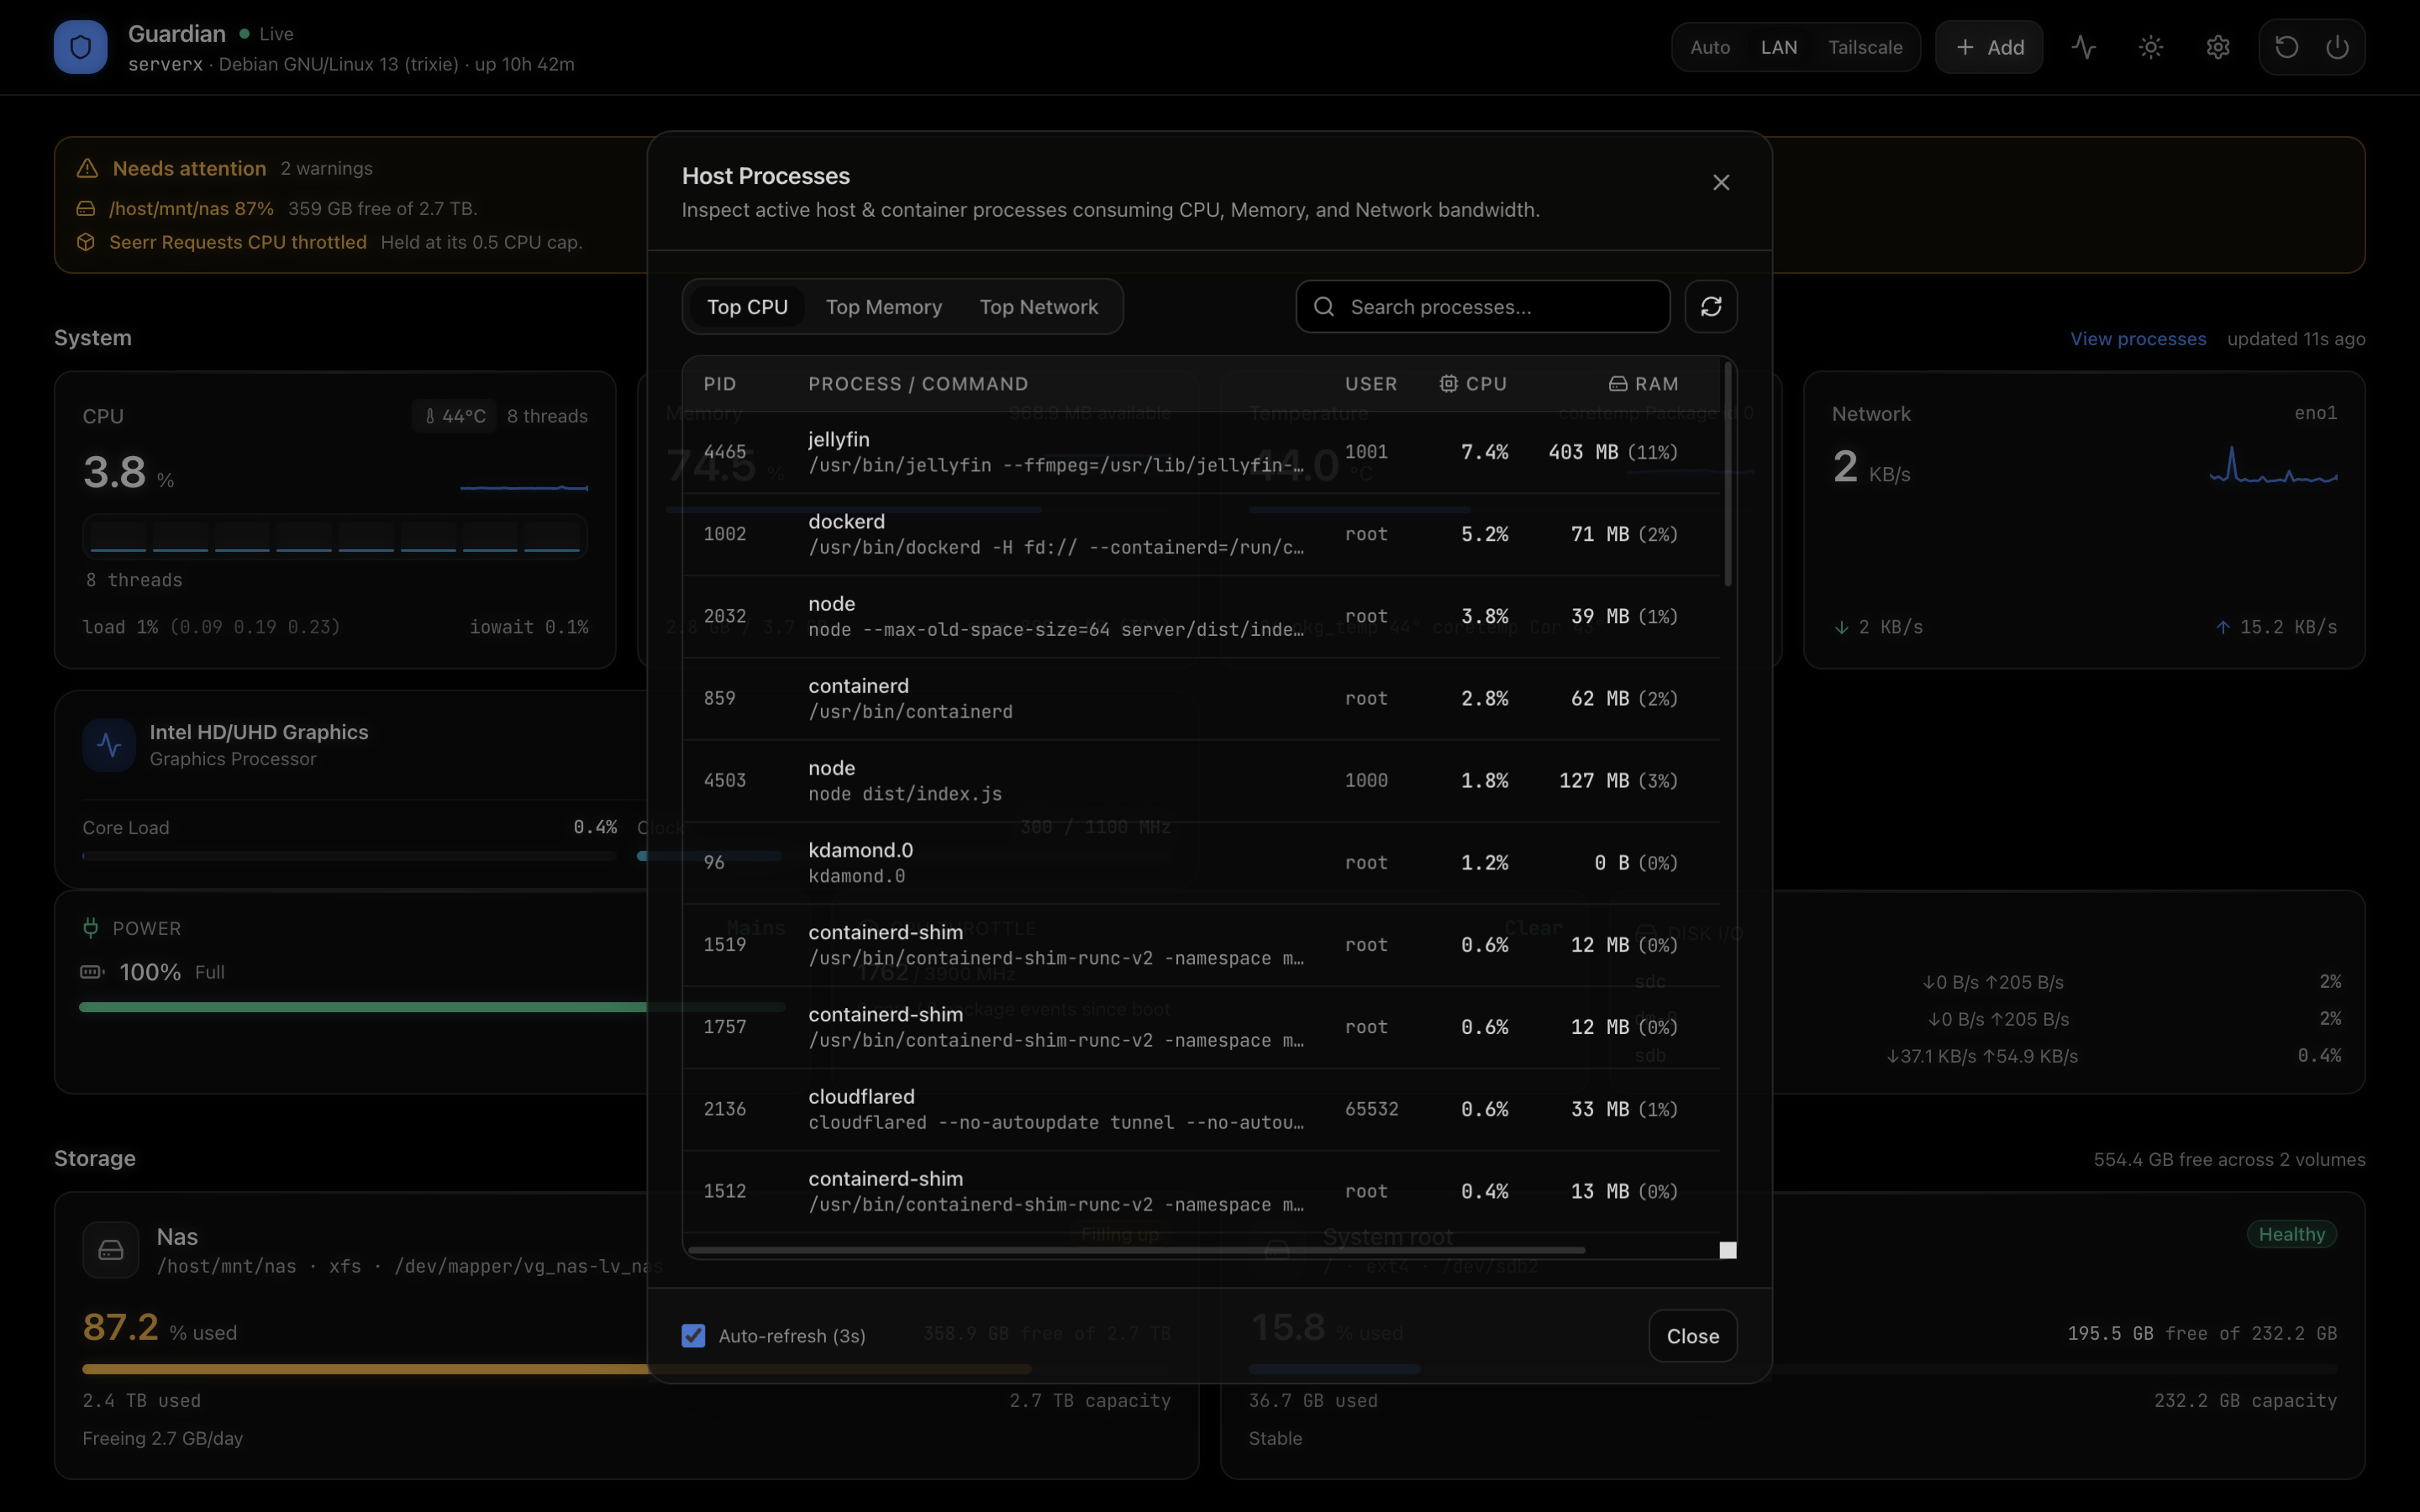](docs/screenshots/04-process-monitor.png) |
| *Interactive 24-hour charts, min/avg/peak stats, and process consumers* | *Live process explorer sorting CPU, memory, and network usage* |
Endpoint Health Prober
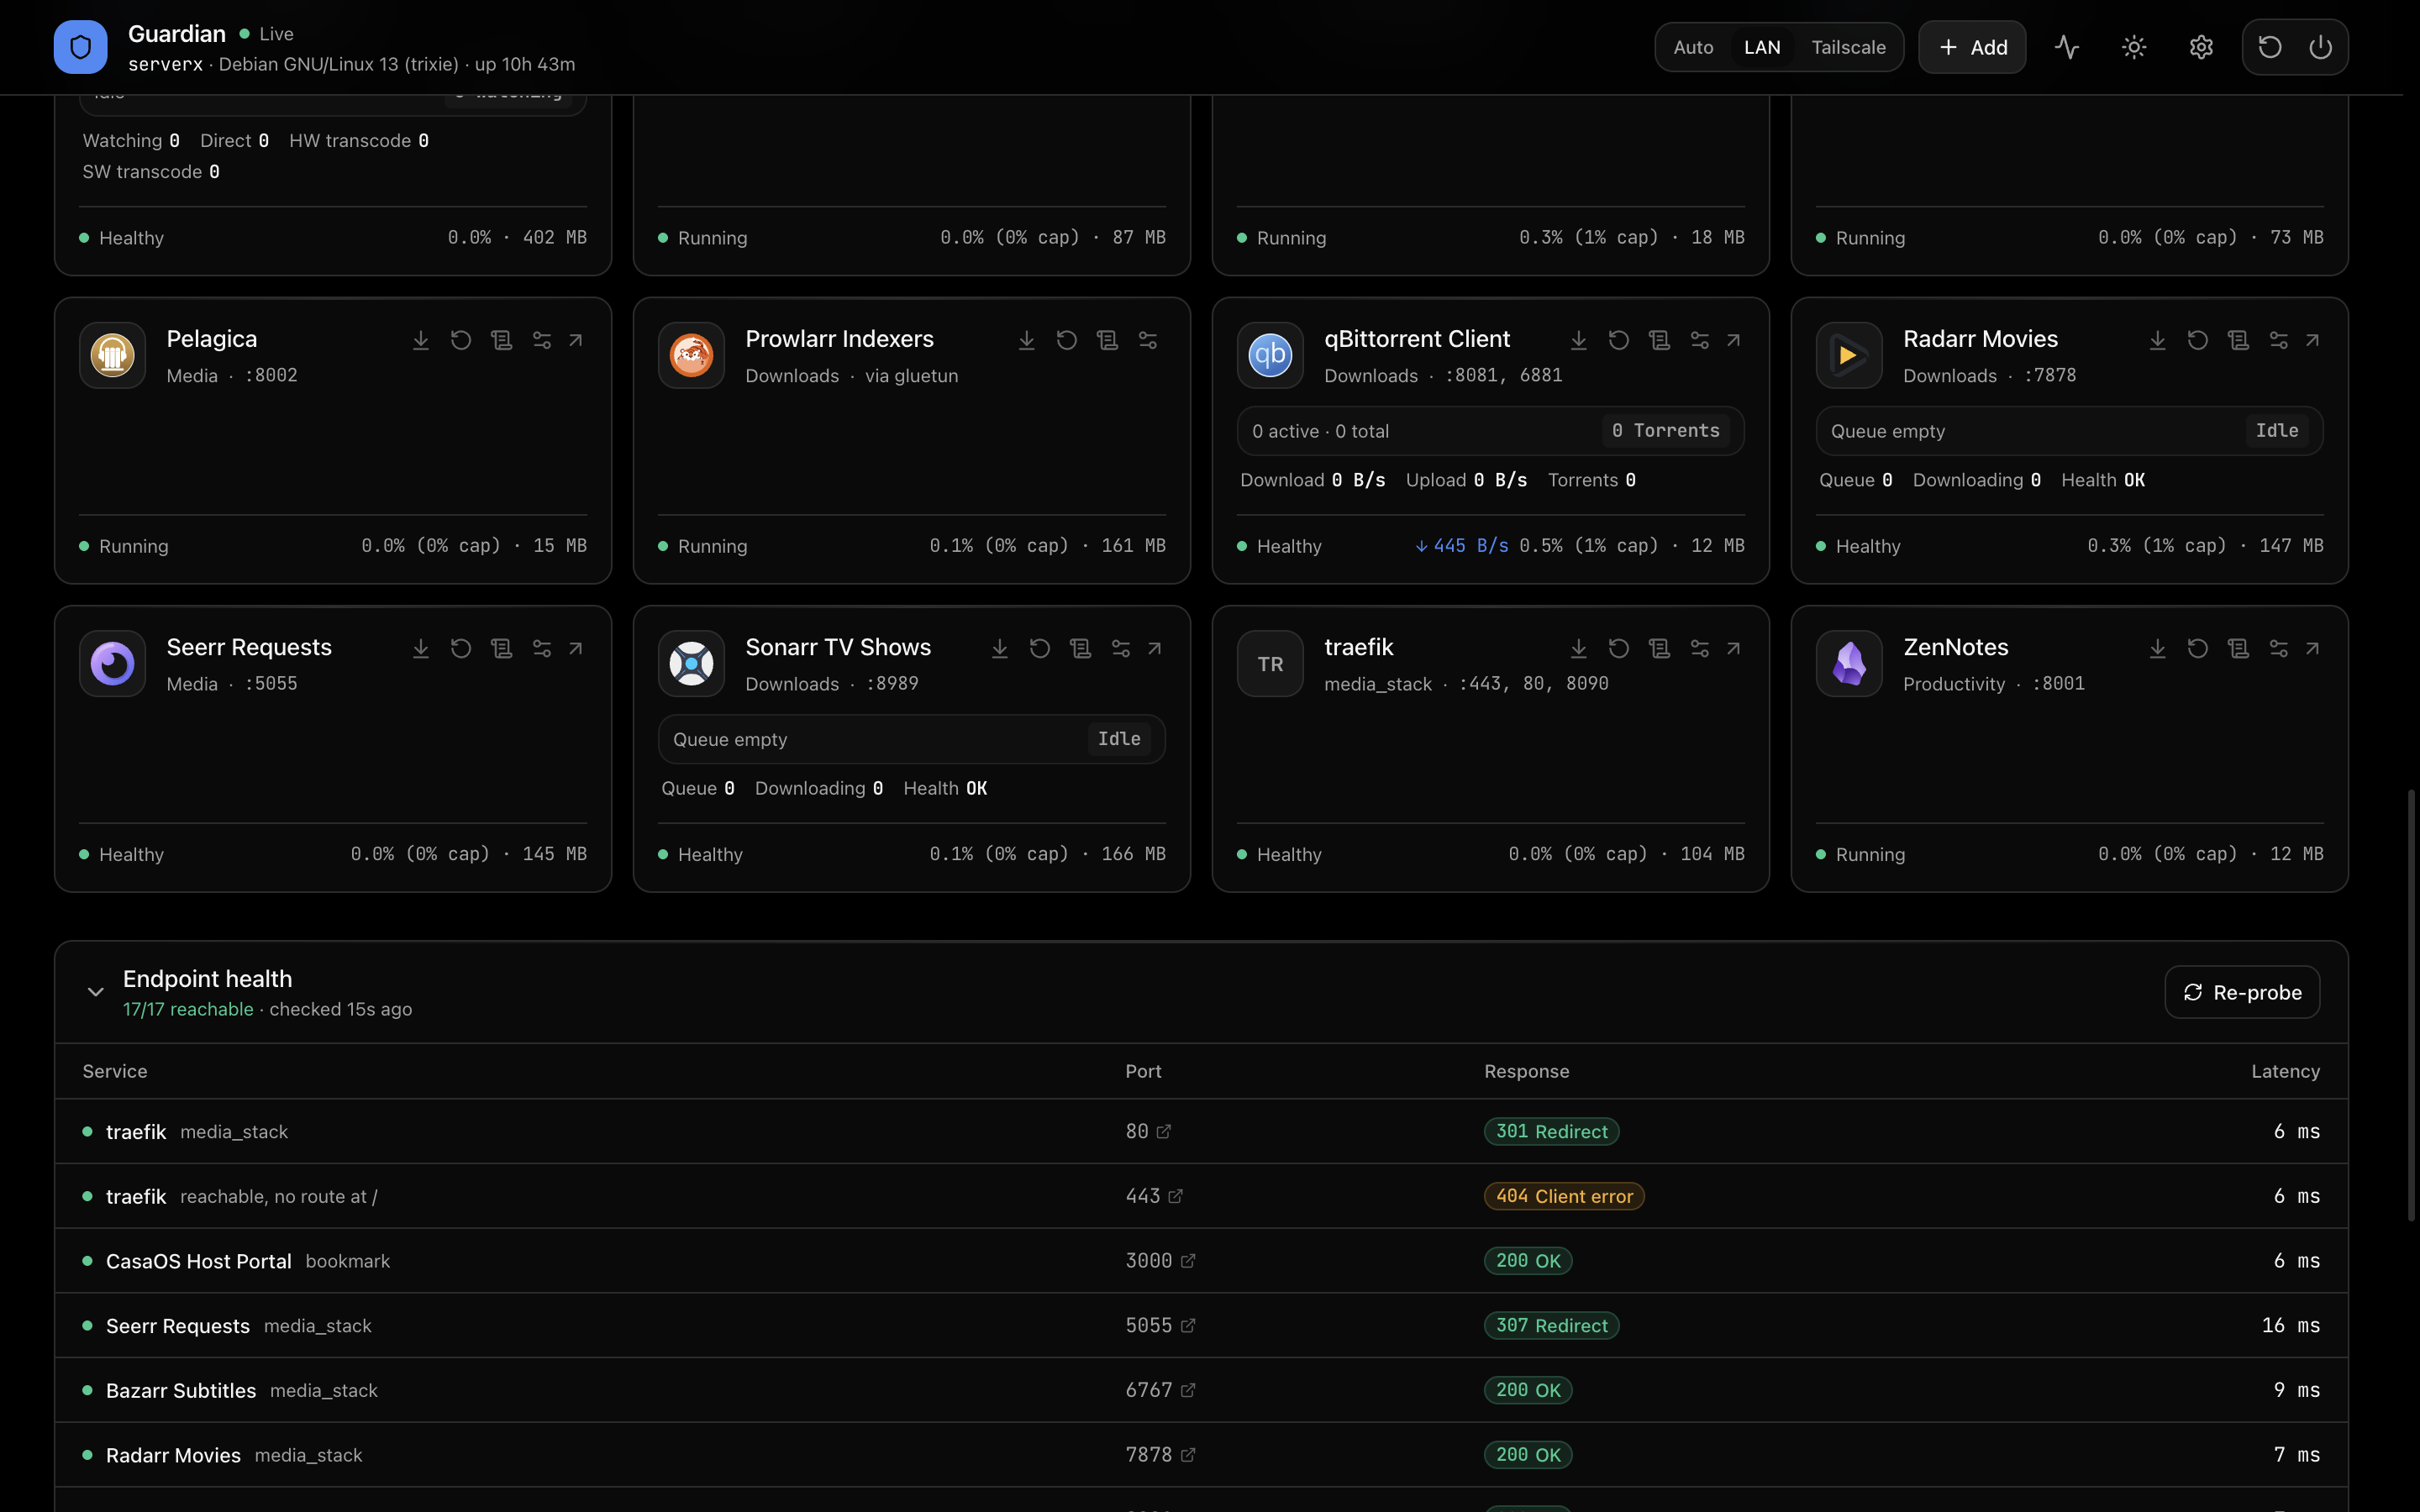
Automated HTTP health checks across container ports with latency and status codes
---
## What it does
### Host telemetry
| Signal | Read from | Notes |
| --- | --- | --- |
| CPU utilisation | `/proc/stat` | Total plus **per-core**, drawn as a strip so one pegged thread is visible inside a calm average |
| I/O wait | `/proc/stat` | Reported separately from utilisation — a disk-bound host can sit at 3% CPU while everything stalls |
| Load average | `/proc/loadavg` | Shown as a percentage of thread count, because "2.35" means nothing on its own |
| Memory & swap | `/proc/meminfo` | Used, available, buffers/cache, swap |
| Temperature | `/sys/class/hwmon`, `/sys/class/thermal` | hwmon first — that's where `coretemp` package readings live |
| Network | `/proc/net/dev` | Per-interface throughput; virtual and overlay interfaces are excluded from "primary link" |
| Storage | `/proc/mounts` + `statfs` | Every real filesystem with its true device and fs type |
| Uptime & availability | `/proc/uptime`, `/proc/stat` | Live continuous operation down to the second, boot record, and lifetime CPU efficiency |
| S.M.A.R.T. & drive health | `smartctl`, `/sys/block` | Per-drive SMART status (PASSED/FAILING), temperatures, NVMe wearout & TBW, power-on hours, and critical sector alerts |
Each metric tile opens a **history page**: full-size charts with 1H / 6H / 24H / 7D / 30D ranges, current / average / peak / minimum, and a table view.
### Container monitoring
Guardian calls both `/containers/json` *and* `/containers/{id}/json`, because the first one alone will happily report a crash-looping container as "running":
- **Restart counts, exit codes, OOM kills** and the daemon's own error string
- **Healthcheck logs** — the last few probe results with their output, so "unhealthy" comes with a reason
- **Live CPU and memory** over a persistent stats stream, so values are ~1 second old rather than up to 30
- **Shared network namespaces** resolved by name (a container on `network_mode: container:gluetun` says *via gluetun*)
- **Container logs** with stdout and stderr separated, filtering, follow mode, and adjustable tail
Anything needing attention is sorted to the front of the grid, and a summary line says either how many containers have a problem or that everything is healthy.
### Endpoint health
An HTTP prober checks every container's published port on a 60-second cycle, reporting latency and distinguishing `2xx`, redirects, `401`/`403`, client errors and server errors. **Targets are derived from what is actually running** — plus any port your bookmarks point at, which covers host services that aren't containers.
### App launcher
Auto-discovers containers and turns them into clickable tiles. Custom icons (60+ presets or any image URL), custom launch URLs with `{host}` / `{lan}` / `{tailscale}` placeholders, categories, search (`/` to focus), pinning, and bookmarks for anything outside Docker.
### Housekeeping
- **Docker reclaimable space** with one-click prune of dangling images only
- **Application logs** — Guardian's own structured log, filterable by level and scope, persisted across restarts
- **Shutdown / reboot**, off by default and heavily gated ([details below](#enabling-shutdown-and-reboot))
> **Running off-host?** Without `/proc`, `/sys` or a Docker socket, Guardian serves clearly-labelled sample data and names the source it couldn't reach. It never presents synthesized values as real measurements.
---
## How it works
```
┌──────────── browser ────────────┐
│ React SPA · SSE · hash routes │
└───────────────┬─────────────────┘
│ /api/live (SSE, heartbeated)
┌───────────────▼─────────────────┐
│ Express server │
│ │
│ one sampling loop ──────────► snapshot ──► every reader
│ │ │
│ ├─ /proc, /sys (host telemetry) │
│ ├─ docker.sock (containers, stats streams) │
│ ├─ HTTP prober (endpoint health) │
│ └─ tiered history (30 days, on disk) │
└─────────────────────────────────┘
```
**One sampler, many readers.** The CPU and network collectors diff kernel counters, so calling them twice in quick succession makes the second read report near-zero. A single loop samples on a fixed cadence and publishes an immutable snapshot; `/api/status` and every SSE client serve that snapshot rather than re-sampling.
**Tiered history.** A month of 15-second samples would be ~180,000 points per metric. Guardian keeps every sample for 6 hours, 5-minute averages for 7 days, and hourly averages for 30 days — about 3,600 points total, which fits in memory, serialises to a small JSON file, and survives restarts.
**Streaming container stats.** One long-lived connection per running container instead of a request per container per poll. Connection count stays flat as the poll rate changes.
---
## Quick start
### Docker Compose
Grab `docker-compose.yml.example` directly or paste the compose configuration below:
```bash
# Download and start in one step
curl -sSL https://raw.githubusercontent.com/vineetkishore01/Guardian/main/docker-compose.yml.example -o docker-compose.yml
docker compose up -d
```
Or create `docker-compose.yml` manually:
```yaml
services:
guardian:
image: ghcr.io/vineetkishore01/guardian:latest
container_name: guardian
restart: unless-stopped
ports:
- "3001:3001"
volumes:
# Container discovery, stats and logs (/var/run/docker.sock for rw actions)
- /var/run/docker.sock:/var/run/docker.sock
# Host telemetry
- /proc:/host/proc:ro
- /sys:/host/sys:ro
- /etc/os-release:/host/etc/os-release:ro
- /etc/hostname:/host/etc/hostname:ro
# Storage — mount root (rslave allows submounts like /mnt or /media to resolve)
- /:/host/root:ro,rslave
# Persisted icons, bookmarks, history and logs
- guardian_data:/data
environment:
- HOST_PROC=/host/proc
- HOST_SYS=/host/sys
- HOST_ETC=/host/etc
- HOST_ROOT=/host/root
- PORT=3001
- NODE_ENV=production
deploy:
resources:
limits:
memory: 128M
cpus: '0.50'
volumes:
guardian_data:
```
Then open `http://:3001`.
### Build from source
```bash
git clone https://github.com/vineetkishore01/Guardian.git
cd Guardian
docker compose up -d --build
```
---
## Environment variables
Everything is optional — Guardian starts with no configuration and discovers what it can.
### Networking
| Variable | Default | Description |
| --- | --- | --- |
| `PORT` | `3001` | Port the HTTP server listens on. |
| `BIND_HOST` | `0.0.0.0` | Address to bind. Set to `127.0.0.1` to accept only local connections, e.g. behind a reverse proxy. |
### Host telemetry paths
Inside a container the host's filesystems are bind-mounted elsewhere, so each collector's root is configurable. Values must match the container-side path you mounted to.
| Variable | Default | Description |
| --- | --- | --- |
| `HOST_PROC` | `/proc` | procfs mount point. Source of CPU, memory, load, uptime, network and mount data. Without it, host metrics fall back to sample values. |
| `HOST_SYS` | `/sys` | sysfs mount point. Source of temperatures (`hwmon` and `thermal`). |
| `HOST_ETC` | `/etc` | Used to read `os-release` for the distro name. Without it Guardian reports the kernel name instead of e.g. "Debian GNU/Linux 13". |
| `HOST_ROOT` | `/` | The root filesystem to measure. Set to `/host/root` when you bind-mount `/` elsewhere. |
| `HOST_NAS` | `/mnt/nas` | An additional volume to measure. Despite the name it can be any path. |
| `HOST_MOUNTS` | *(empty)* | Comma-separated extra mount points to watch, e.g. `/host/mnt/backup,/host/srv`. Filesystems found in `/proc/mounts` are picked up automatically; use this for anything that isn't. |
### Docker
| Variable | Default | Description |
| --- | --- | --- |
| `DOCKER_SOCKET` | `/var/run/docker.sock` | Path to the Docker daemon socket. Read-only access is enough for everything except pruning. Without it, Guardian shows a labelled sample container list. |
### Storage and persistence
| Variable | Default | Description |
| --- | --- | --- |
| `DATA_DIR` | `/data` | Where `guardian.json` (icons, bookmarks, settings), `history.json` (30-day metrics) and `logs.json` are written. Falls back to `./data` when the directory does not exist, which is what happens during local development. |
### Launch targets
These only seed the initial values; both are editable in **Settings** afterwards and stored in `guardian.json`.
| Variable | Default | Description |
| --- | --- | --- |
| `SERVER_IP` | *(empty)* | LAN address used to build app URLs when the launch target is set to **LAN**. Left empty, the LAN option is not offered. |
| `TAILSCALE_IP` | *(empty)* | Tailscale address, used when the launch target is set to **Tailscale**. Left empty, the option is not offered. |
### Logging
| Variable | Default | Description |
| --- | --- | --- |
| `LOG_LEVEL` | `info` | Minimum level recorded: `debug`, `info`, `warn` or `error`. Entries appear in the dashboard's log panel and on stdout, so `docker logs guardian` keeps working. |
### Power control
| Variable | Default | Description |
| --- | --- | --- |
| `ENABLE_POWER_CONTROLS` | `false` | Set to the exact string `true` to allow shutdown and reboot. While unset the control is hidden entirely — not shown disabled. |
| `GUARDIAN_POWER_COMMAND` | *(auto-detect)* | Custom command to run, with `{action}` expanded to `poweroff` or `reboot`. Split on whitespace and executed as an argument array — never through a shell. Auto-detection tries `systemctl`, then `shutdown`. |
---
## Enabling shutdown and reboot
This is the only endpoint that can take the machine down, so it is deliberately hard to trigger by accident:
1. It does nothing unless `ENABLE_POWER_CONTROLS=true`.
2. The caller must type the machine's **hostname** to confirm.
3. Every attempt, including refusals, is written to the application log.
```yaml
environment:
- ENABLE_POWER_CONTROLS=true
```
### The container caveat
Guardian runs in a container, so `systemctl poweroff` acts on **the container**, not the host — you'd get a button that restarts Guardian. The dialog warns you when it detects this. To reach the host, supply a command that crosses the boundary:
```yaml
volumes:
- /path/to/key:/keys/guardian:ro
environment:
- ENABLE_POWER_CONTROLS=true
- GUARDIAN_POWER_COMMAND=/usr/bin/ssh -i /keys/guardian -o StrictHostKeyChecking=yes admin@host sudo systemctl {action}
```
Restrict the key in the host's `authorized_keys` so it can only run those two commands:
```
command="/usr/bin/sudo /bin/systemctl $SSH_ORIGINAL_COMMAND",no-port-forwarding,no-pty ssh-ed25519 AAAA...
```
Alternatives are `pid: host` plus `nsenter`, or mounting the systemd D-Bus socket. Both grant the container substantially more power over the host than a scoped SSH key.
> ⚠️ **Guardian has no authentication.** Anyone who can reach the port can read everything and, with power controls on, shut the machine down. Keep it on a trusted network or behind an authenticating reverse proxy.
---
## Runtime settings
Editable in the UI, stored in `guardian.json`, no restart required:
| Setting | Effect |
| --- | --- |
| **App launch target** | Whether tile URLs are built from the browser's address, the LAN IP, the Tailscale IP, or a custom domain. |
| **LAN / Tailscale address** | The addresses those options use. Also seeds the `{lan}` and `{tailscale}` placeholders. |
| **Dashboard title** | Shown in the browser tab. |
| **Telemetry interval** | 5–300 seconds. Applied immediately — the sampling loop re-arms without a restart. |
| **Backup** | Exports icons, categories and bookmarks as JSON. |
---
## API reference
| Method | Route | Purpose |
| --- | --- | --- |
| `GET` | `/api/health` | Liveness, SSE client count, open stats streams, last sample time |
| `GET` | `/api/status` | Current telemetry snapshot |
| `GET` | `/api/live` | SSE stream of snapshots, with heartbeats |
| `GET` | `/api/history/:metric` | One metric's history — `?range=1h\|6h\|24h\|7d\|30d` |
| `GET` | `/api/history` | Several at once — `?metrics=cpu,ram&range=24h` |
| `GET` | `/api/logs` | Application log — `?level=&scope=&limit=` |
| `DELETE` | `/api/logs` | Clear the log buffer |
| `GET` | `/api/containers/:id/logs` | Container logs — `?tail=200` |
| `GET` | `/api/config` | Full persisted config, for backup |
| `POST` | `/api/config/settings` | Update settings |
| `POST` | `/api/containers/:name/custom` | Per-container icon, URL, category, pin, hide |
| `POST` | `/api/custom-apps` | Create or update a bookmark |
| `DELETE` | `/api/custom-apps/:id` | Delete a bookmark |
| `POST` | `/api/docker/prune` | Prune dangling images |
| `POST` | `/api/probes/refresh` | Force a health-probe cycle |
| `GET` | `/api/power` | Whether power control is available, and why not if it isn't |
| `POST` | `/api/power/:action` | `shutdown` or `reboot`, body `{ "confirmation": "" }` |
Metric keys: `cpu`, `ram`, `swap`, `temp`, `netRx`, `netTx`, `disk`.
---
## Local development
```bash
# Install
npm install && (cd client && npm install) && (cd server && npm install)
# Client on :5173 with hot reload, server on :3001
npm run dev
# Or build and serve the production bundle from the server
npm run build && npm start
```
On a non-Linux machine the host and Docker collectors fall back to sample data and the dashboard says so — the UI is fully developable without a Linux host.
To exercise the Docker code paths without a daemon, point `DOCKER_SOCKET` at any process speaking the Engine API subset Guardian uses (`/containers/json`, `/containers/{id}/json`, `/containers/{id}/stats`, `/containers/{id}/logs`, `/system/df`).
---
## Design notes
A single neutral ramp carries the interface, one brand hue marks anything interactive, and three status hues are reserved for state. **Colour always encodes meaning**: a metric turns amber or red because it crossed a threshold, never for decoration. A healthy dashboard is almost entirely monochrome, so anything coloured is worth looking at.
The dark theme is **AMOLED true black** — the page plane is `#000`, where an OLED panel switches the pixel off. Since shadows are invisible on black, elevation comes from brighter borders and a lit top edge instead.
Chart series use a four-slot categorical palette assigned in fixed order and validated in both themes against the real surfaces for lightness band, chroma floor, colour-vision separation and contrast. Charts start the y-axis at zero, break the line across data gaps rather than interpolating across them, and offer a table view so nothing depends on colour alone.
---
## Project layout
```
Guardian/
├── Dockerfile Multi-stage production image
├── docker-compose.yml Local development deployment
├── docker-compose.yml.example Standalone production template (GHCR image)
├── server/ Node · TypeScript · Express
│ └── src/
│ ├── collectors/
│ │ ├── host.ts /proc & /sys — CPU, memory, temps, network
│ │ ├── disk.ts Filesystem discovery via /proc/mounts
│ │ └── docker.ts Socket client, stats streams, log demux
│ ├── prober.ts HTTP health checks on discovered ports
│ ├── history.ts Tiered 30-day metric store
│ ├── logger.ts Structured application log
│ ├── power.ts Guarded shutdown / reboot
│ ├── store.ts Persistence + payload validation
│ └── index.ts Sampling loop, SSE, API routes
└── client/ React 18 · Vite · Tailwind
└── src/
├── components/
│ ├── ui/ Card, Button, Dialog, Input, Badge, Progress, Tabs
│ ├── layout/ Header, PowerMenu, SettingsModal, PruneBanner
│ ├── metrics/ MetricCard, CoreStrip, HostStatsBar, StorageGauges
│ ├── apps/ AppGrid, AppCard, Add/Edit modals
│ ├── logs/ LogsPanel, ContainerLogsModal
│ ├── services/ ServicesTable
│ └── charts/ LiveSparkline, TimeSeriesChart
├── pages/ MetricDetailPage
├── hooks/ useLiveTelemetry
└── lib/ formatters, severity, router, metrics, icons
```
---
## License
This project is licensed under the MIT License - see the [LICENSE](LICENSE) file for details.