A `top`-like tool for your Kubernetes cluster.
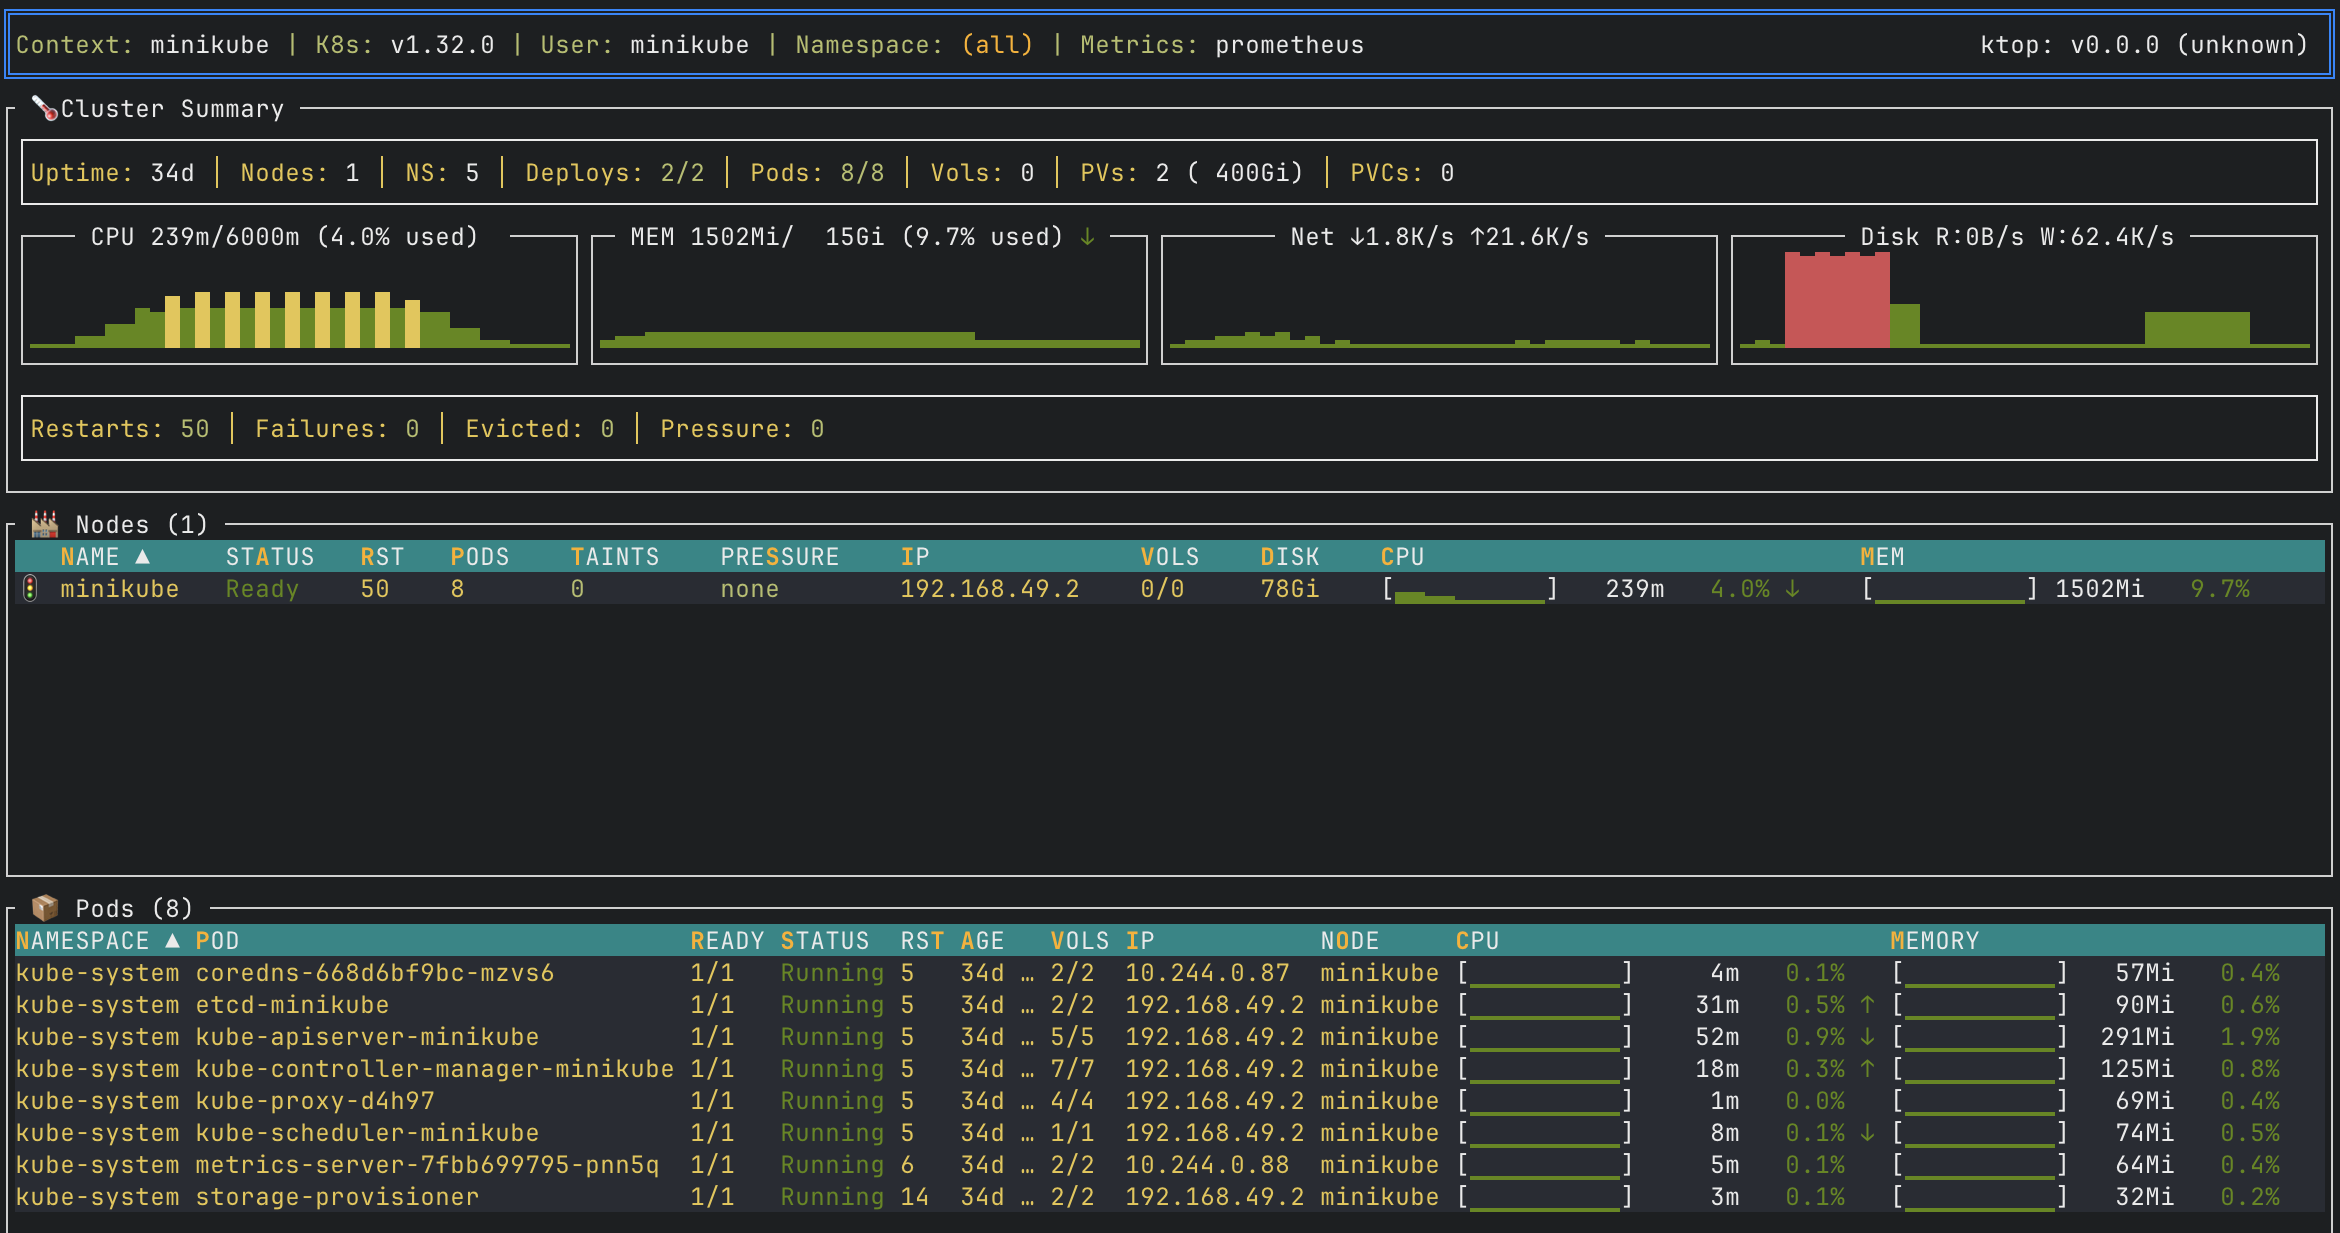
Following the tradition of Unix/Linux `top` tools, `ktop` is a tool that displays useful metrics information about nodes, pods, and other workload resources running in a Kubernetes cluster.
## Features
* **Real-Time Monitoring** - Continuously updated view of nodes, pods, and containers
* **Drill-Down Navigation** - Explore from cluster overview → node → pod → container logs
* **Zero Cluster Installation** - Runs locally using your kubeconfig; no agents or server-side components
* **Works Anywhere kubectl Works** - Connects through the Kubernetes API; no direct node access required
* **Streaming Container Logs** - Real-time logs with filtering, timestamps, line wrap, and full-screen mode
* **Multiple Metrics Sources** - Support Prometheus for enhanced metrics, Metrics-Server, or no-metrics as fallback
* **Graceful Degradation** - Works even without metrics infrastructure by showing resource requests/limits
* **Single Binary** - Download and run; no dependencies beyond a valid kubeconfig
## Installation
### kubectl plugin
```bash
kubectl krew install ktop
kubectl ktop
```
Requires [krew](https://krew.sigs.k8s.io/docs/user-guide/setup/install/) plugin manager.
### Homebrew
```bash
brew tap vladimirvivien/oss-tools
brew install ktop
```
### Go install
```bash
go install github.com/vladimirvivien/ktop@latest
```
### Binary download
Download from [GitHub Releases](https://github.com/vladimirvivien/ktop/releases/latest).
## Quick Start
With a valid kubeconfig file (`$KUBECONFIG` or `~/.kube/config`):
```bash
# Start ktop with default settings
ktop
# Use a specific context
ktop --context my-cluster
# Filter to a namespace
ktop --namespace production
# Use Prometheus for enhanced metrics
ktop --metrics-source=prometheus
```
## Documentation
> See [ktop's](https://vladimirvivien.github.io/ktop/) website for documetation.