### Overview
When you open the **Diagrams** tab of the [Database Object Editor](Database-Object-Editor.md), you can visually
explore, analyze, and customize your database structure. The interface includes:
- **Diagrams editor**: View and rearrange entities and their relationships.
- **Palette panel**: Access tools for adding connections, notes, and more.
- **Toolbar**: Manage diagrams with options for saving, exporting, zooming, and configuration.
DBeaver supports diagrams for existing tables, schemas, and custom visualizations. You can select, modify,
and customize elements or export diagrams for further use. Advanced notations, routing types, and certain features may
depend on your product edition. For more, see [Database Structure Diagrams](Database-Structure-Diagrams.md).
> **Tip**: Create custom diagrams to tailor visualizations. See [Custom Diagrams](Custom-Diagrams.md).
### Selection of Elements in Diagrams
You can use one of the two tools to select elements in diagrams:
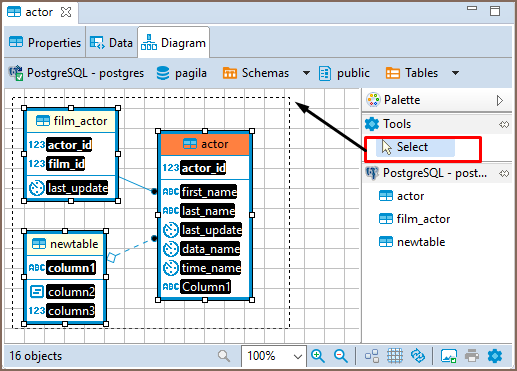
* Select – supports both, single and multi-select modes. To select a single element (table, connection, entity inside a table) in a diagram, just click that element. To select multiple elements, similar to using the Marquee tool, click outside the first element and draw until all elements you need are in focus:
### Generate SQL
Diagrams in DBeaver support generating SQL for various commands, including `SELECT`, `INSERT`, `UPDATE`,
`DELETE`, `MERGE`, `JOIN`, and some database-specific commands such as `INSERT ON CONFLICT`, `UPDATE FROM`, and
`DELETE USING`.
> **Tip**: `INSERT ON CONFLICT`, `UPDATE FROM`, and `DELETE USING` are specific to PostgreSQL.
- Right-click the selected tables and choose **Generate SQL** to create the query automatically.
- To generate a **JOIN** statement, [select multiple tables](#selection-of-elements-in-diagrams) in the diagram.
### Structure Adjustment
> **Note**: All changes to existing database schemas cannot be saved and are intended for exploration purposes only.
You can do the following structural changes in the diagrams.
* Add new tables to a diagram by drag-n-dropping them onto the diagram field from the [Database Navigator](Database-Navigator.md).
* Rearrange tables in the diagram by dragging them all over the space. You can select several tables and drag them to a new location.
* Auto-arrange tables into a compact view after manual rearrangements: click the **Arrange Diagram** () in the toolbar or on the context menu (right-click anywhere on the diagram tab).
* (Available for [Custom Diagrams](Custom-Diagrams.md) only) - connect tables with a connector: click the **Show Palette** button () in the upper-left corner of the diagram tab and then, in the Palette panel, click **Connection**:
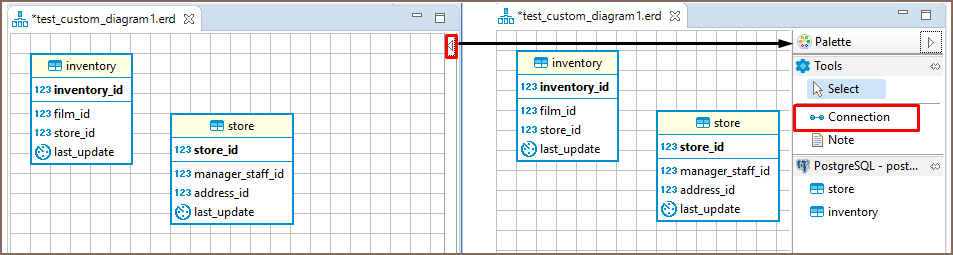
Now click the tables that you want to connect with each other in turn, one by one. To stop the connection line, double-click the last table
* (Available for [Custom Diagrams](Custom-Diagrams.md) only) - removes tables and connections: right-click the table or connection and click **Delete** on the context menu or just click the table or connection and press Delete.
> **Tip**: In cases where tables lack actual foreign keys, dragging one column onto another allows you to set up
> a [virtual foreign key](Virtual-Keys.md#creating-a-virtual-foreign-key). This can be useful for managing data
> relationships in environments where physical constraints are not defined.
### View Adjustment
You can adjust the view of any diagram in the following ways:
* Enable/disable the diagram grid: Click **Toggle Grid** () in the toolbar.
* Modify attributes visibility: Right-click the diagram and, on the context menu, click **Show Attributes** and then select one of the options:
- **All** - all attributes
- **Any keys** - primary and foreign keys
- **Primary key** - only primary keys
- **None** - no attributes
* Modify attributes presentation: Right-click the diagram and, on the context menu, click **View Styles** and then select one of the options:
- **Show Icons**
- **Show Data Types**
- **Show Nullability**
- **Show Comments**
- **Show Fully qualified names**
* Change the color of the entities/notes: Right-click the header of the entity or comment and then click **Set color** on the context menu. Then you can select the color and click **OK**.
* For elements located in front of/behind others, bring an element to the front or send it to the back: Right-click the element and then click **Bring to front** / **Send to back** on the context menu.
* Zoom the diagram in/out: Click the **Zoom In**/**Zoom Out** buttons or choose the scaling value in the dropdown list in the toolbar: 
### Refresh
To see changes made by others to the database schema, you might need to refresh the diagram: click **Refresh Diagram** () in the toolbar.
### Diagram Notations and Routing types
DBeaver offers a variety of notations and routing types for Diagrams, allowing you to customize database
structure representations to suit your needs.
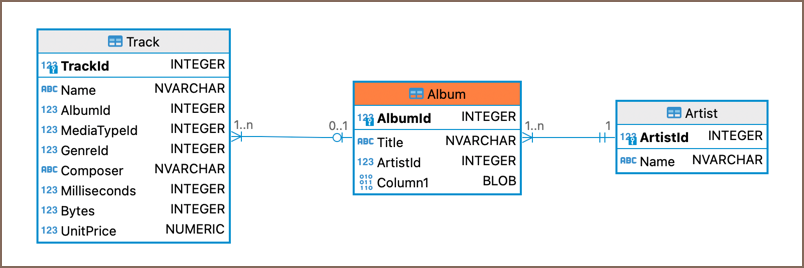
#### Notations
- **IDEF1X** (default): Highly recommended for designing relational databases. It places a strong emphasis on detailing
entity relationships and constraints. For more information, see [IDEF1X Notation](https://www.softwaregems.com.au/Documents/Documentary%20Examples/IDEF1X%20Notation.pdf).
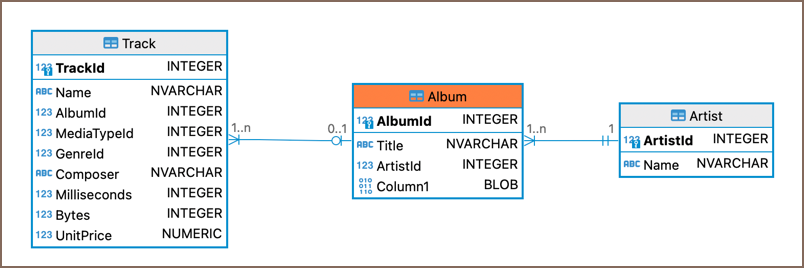
- **Bachman**: A notation that is particularly useful for data processing diagrams and reflects the data structure of
the designed system from the data management perspective. For a more detailed understanding, refer
to [Bachman Notation](https://www.conceptdraw.com/examples/bachman-notation).
> **Note**: Bachman notation is available in [Enterprise](Enterprise-Edition.md), [Ultimate](Ultimate-Edition.md) and
Team editions only.
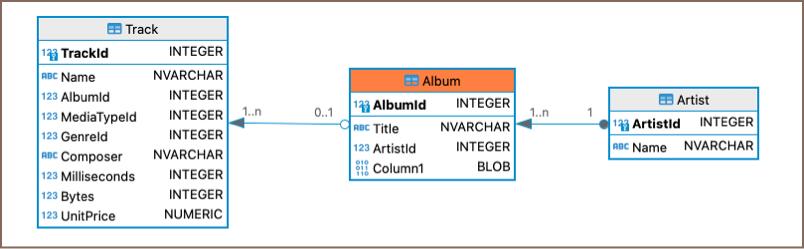
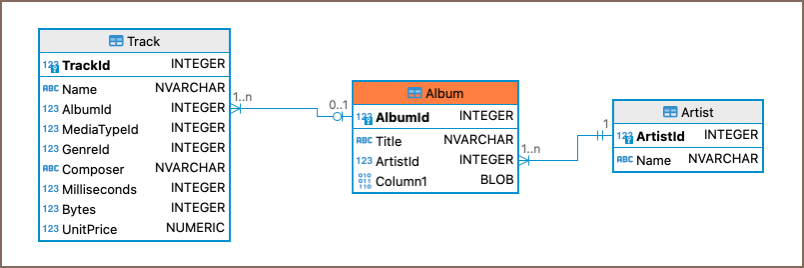
- **Crow's Foot**: This notation is widely used and is particularly intuitive for representing cardinality and
relationships between entities. More information is available
on [Crow's Foot Notation](https://miro.com/diagramming/crows-foot-notation-in-er-diagrams/).
#### Routing types
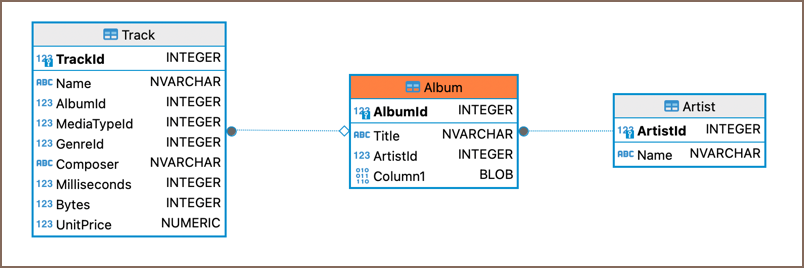
- **Shortest paths** (default): Calculate and display the shortest possible lines connecting entities, ensuring a compact and
efficient diagram representation.
> **Tip**: Click on a connection to view detailed relationships.
- **Orthogonal paths**: Uses right-angled lines for clear, structured layouts; Showing direct relationships between
tables and columns.
> **Note**: Orthogonal paths are available in [Enterprise](Enterprise-Edition.md), [Ultimate](Ultimate-Edition.md) and
Team editions only.
#### Setting Notation and Routing type
To set notation or routing type in an Diagram:
1. Right-click on an empty space within the Diagram area.
2. From the context menu, hover over **Notation** or **Routing** for the respective settings.
3. Select your preferred option from the submenu.
Alternatively, adjust these settings through the Diagram toolbar:
1. Click the **Settings** button .
2. In the **Advanced** section, find the **Notation type** or **Routing type** dropdown menu.
3. Choose your preferred setting.
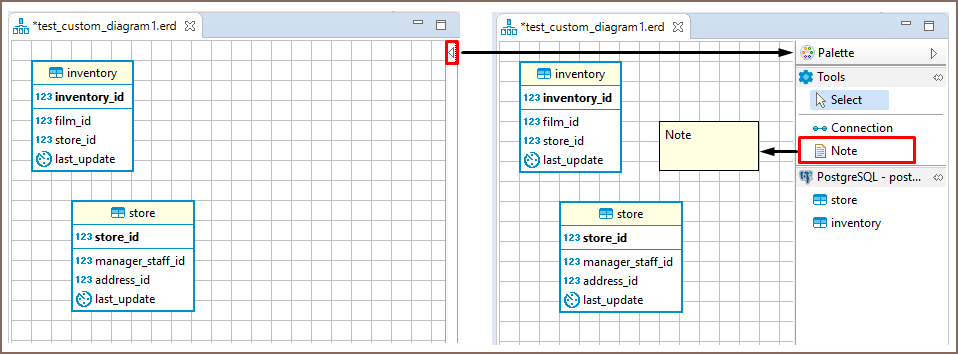
### Notes
You can create notes only in [Custom Diagrams](Custom-Diagrams.md). To create a note, click the **Show Palette** button () in the upper-left corner of the diagram tab. Then, in the Palette panel, click **Note** and click anywhere in the diagram tab. Now you can double-click the **Note** box to enter the note text:
### Search in Diagram Entities
To search among entities of a diagram, click the **Search items** button () in the toolbar, then type in the search combination. The entities that contain the search combination are highlighted in the diagram.
To remove the filter, click the cross icon next to the search field.
### Bindings
#### Navigation and selection
* Use `ARROWS` to navigate between tables.
* Press `SHIFT`|`⇧` + `ARROWS` to select multiple tables.
* Press `CTRL`|`⌃` + `ARROWS` to select additional tables using `SPACEBAR`.
* Press `SPACEBAR` to select the current table.
#### Table Manipulation
* Press `.` (period) to change the mode to move/resize tables, then use `ARROWS` and `ENTER`|`↩` to move/resize tables.
> **Note**: To use this feature on macOS, you may need to enable accessibility permissions for DBeaver. This can be done in `System Preferences —> Security & Privacy —> Accessibility`.
#### Focus
* Press `ENTER`|`↩` to focus on attributes in the table.
* Press `BACKSPACE`|`⌫` to leave the focus.
* Use `|`, `?`, `\` to focus on associations.
* Press `ALT/FN + 1`|`⌥/FN + 1` to focus on the diagram.
* Press `ALT/FN + 2`|`⌥/FN + 2` to focus on the palette.
* Press `ALT/FN + 3`|`⌥/FN + 3` to focus/open the outline.
* Press `ALT/FN + 4`|`⌥/FN + 4` to focus on the parameter view.
#### Other Functions
* Press `CTRL + SHIFT + ENTER` |`⌃ + SHIFT + ↩` to open the selected table diagram.
### Diagram Export
You can export (save) a diagram as an image (PNG, GIF, BMP formats) or as a file in GraphML format. To export a diagram, click **Save diagram in external format** () in the toolbar.
### Diagram Printing
To print a diagram, press CTRL+P or click **Print Diagram** () on the toolbar.
### Settings
To modify the diagram settings, click **Configuration** () on the toolbar.