This document describes the features supported by this extension.
## Table of Contents
* [IntelliSense](#intellisense)
* [Code completion](#code-completion)
* [Signature help](#signature-help)
* [Quick info on hover](#quick-info-on-hover)
* [Code Navigation](#code-navigation)
* [Go to definition](#go-to-definition)
* [Go to symbol](#go-to-symbol)
* [Find references](#find-references)
* [Find interface implementations](#find-interface-implementations)
* [Document outline](#document-outline)
* [Toggle between code and tests](#toggle-between-code-and-tests)
* [Syntax Highlighting](#syntax-highlighting)
* [Inlay Hints](#inlay-hints)
* [Code Editing](#code-editing)
* [Snippets](#snippets)
* [Format and organize imports](#format-and-organize-imports)
* [Add import](#add-import)
* [Rename symbol](#rename-symbol)
* [Refactor](#refactor)
* [Code Generation](#code-generation)
* [Add or remove struct tags](#add-or-remove-struct-tags)
* [Generate interface implementation](#generate-interface-implementation)
* [Generate unit tests](#generate-unit-tests)
* [Fill struct literals](#fill-struct-literals)
* [Diagnostics](#diagnostics)
* [Build errors](#build-errors)
* [Vet and extra analyses](#vet-and-extra-analyses)
* [Lint errors](#lint-errors)
* [Vulnerabilities in dependencies](#analyze-vulnerabilities-in-dependencies)
* [Code Lenses](#code-lenses)
* [Run and test in the editor](#run-and-test-in-the-editor)
* [Run your code](#run-your-code)
* [Test and benchmark](#test-and-benchmark)
* [Code coverage](#code-coverage)
* [Profiling](#profiling)
* [Debug your code](#debugging)
* [Other](#other)
* [Go Playground](#go-playground)
## [IntelliSense](https://code.visualstudio.com/docs/editor/intellisense)
### Code completion
Completion results appear for symbols as you type. You can trigger this manually with the Ctrl+Space shortcut.
Autocompletion is also supported for packages you have not yet imported into your program.
### Signature help
Information about the signature of a function pops up as you type in its parameters.
### Quick info on hover
Documentation appears when you hover over a symbol.
## [Code Navigation](https://code.visualstudio.com/docs/editor/editingevolved)
### Go to definition
Jump to or peek a symbol's declaration.
### Find references
Find or go to the references of a symbol.
This feature is not available if you are using Go modules **without** [`gopls`](gopls), the Go language server.
### Find interface implementations
Find the concrete types that implement a given interface.
This feature is not available if you are using Go modules **without** [`gopls`](gopls), the Go language server.
### [Go to symbol](https://code.visualstudio.com/docs/editor/editingevolved#_go-to-symbol)
Search for symbols in your file or workspace by opening the Command Palette (Ctrl+Shift+P) and typing `@` for symbols in the current file or `#` for symbols in the entire workspace.
### Call hierarchy
Show all calls from or to a function.
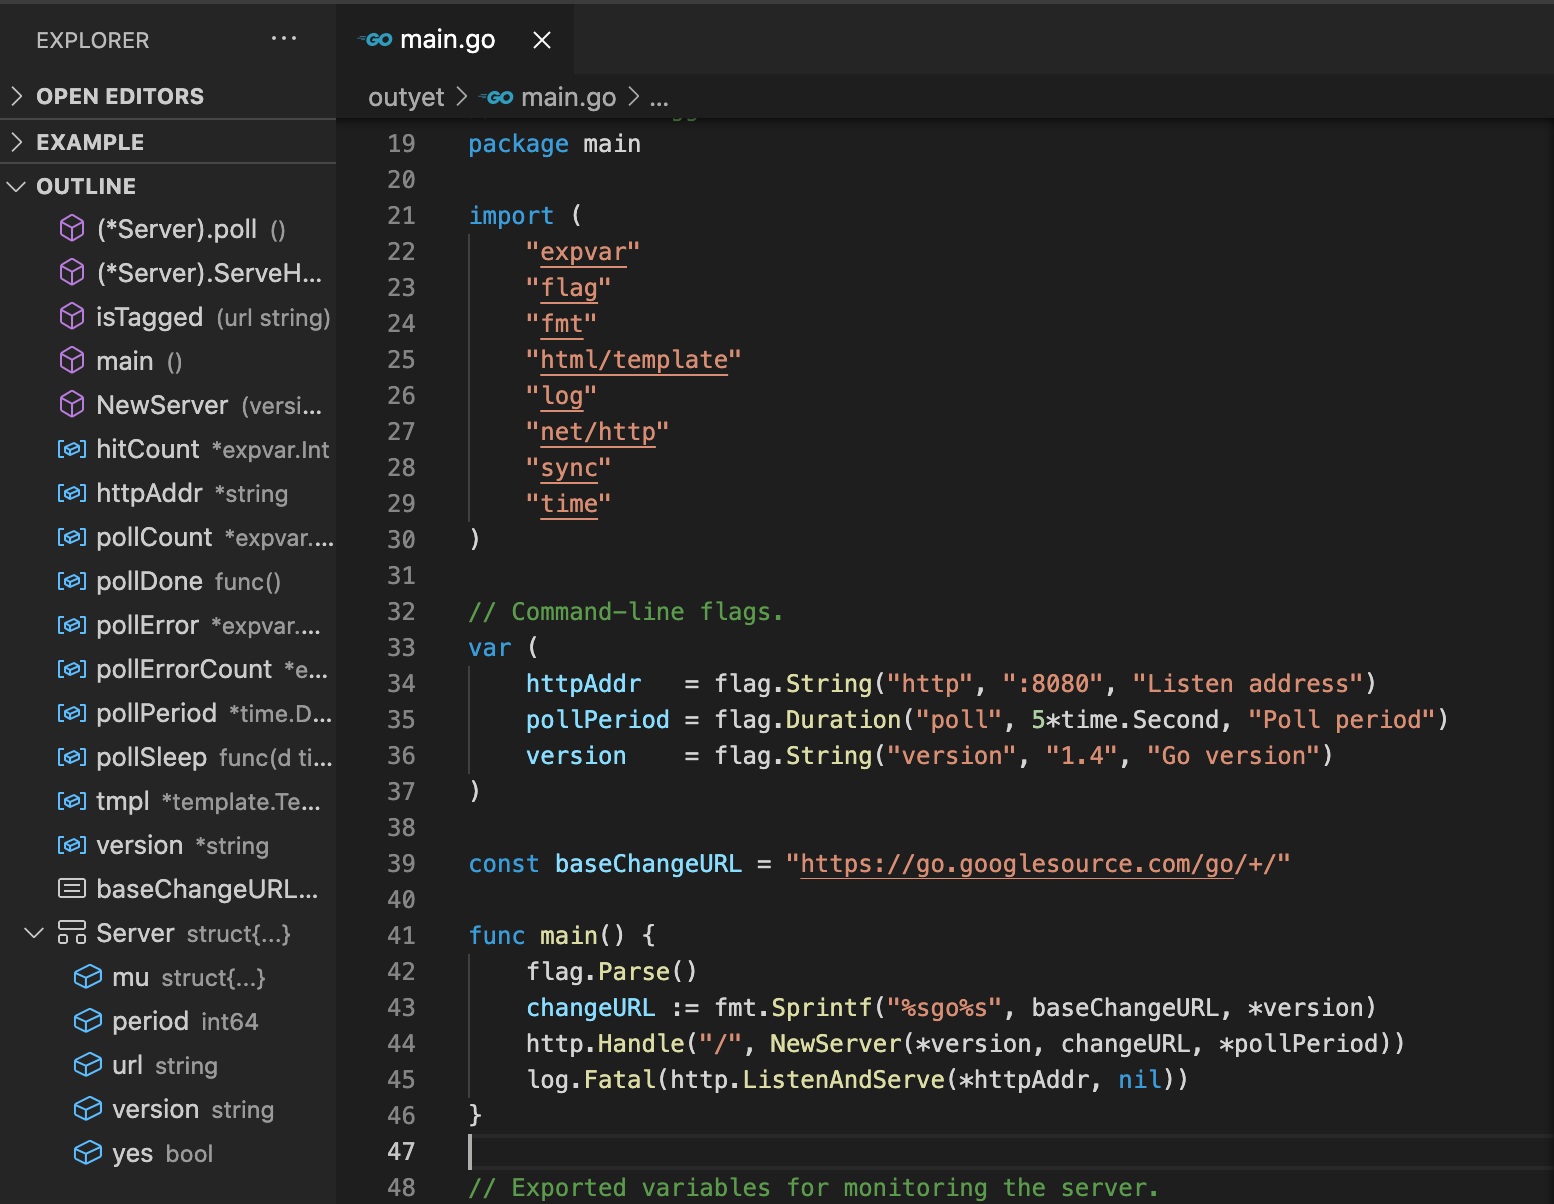
### Document outline
See all the symbols in the current file in the VS Code's [Outline view](https://code.visualstudio.com/docs/getstarted/userinterface#_outline-view).
### Toggle between code and tests
Quickly toggle between a file and its corresponding test file by using the [`Go: Toggle Test File`](commands#go-toggle-test-file) command.
## Syntax Highlighting
The default syntax highlighting for Go files is implemented in Visual Studio Code using TextMate grammar, not by this extension.
If you are using `gopls`, you can enable [Semantic Highlighting](https://code.visualstudio.com/api/language-extensions/semantic-highlight-guide) for more accurate syntax highlighting based on semantic tokenization using this setting:
```
"gopls": {
"ui.semanticTokens": true,
// you can optionally turn on these features for more colors
// see https://go.dev/issue/45753 and https://go.dev/issue/45792
"ui.noSemanticString": true, // delegates string syntax highlighting to vscode
"ui.noSemanticNumber": true, // delegates number syntax highlighting to vscode
}
```
### Go template syntax highlighting
When `gopls`'s semantic tokens feature is enabled, `gopls` also provides semantic tokens for Go template files (language identifier: `gotmpl`). By default, the extension associates all `*.tmpl` or `*.gotmpl` files in the workspace with `gotmpl` language. Users can override the language mode by using Visual Studio Code's UI or the `"files.associations"` setting. See [Visual Studio Code's doc](https://code.visualstudio.com/docs/languages/overview#_changing-the-language-for-the-selected-file) for more details.
## Inlay Hints
Inlay hints render additional inline information to source code to help you understand what the code does.
They can be enabled/disabled with the `editor.inlayHints.enabled` setting in combination with `go.inlayHints` [settings](settings#go.inlayHints.assignVariableTypes) to enable inlay hints types.
### Variable types in assign statements
```go
i/* int*/, j/* int*/ := 0, len(r)-1
```
### Variable types in range statements
```go
for k/* int*/, v/* string*/ := range []string{} {
fmt.Println(k, v)
}
```
### Composite literal field names
```go
{/*in: */"Hello, world", /*want: */"dlrow ,olleH"}
```
### Composite literal types
```go
for _, c := range []struct {
in, want string
}{
/*struct{ in string; want string }*/{"Hello, world", "dlrow ,olleH"},
}
```
### Constant values
```go
const (
KindNone Kind = iota/* = 0*/
KindPrint/* = 1*/
KindPrintf/* = 2*/
KindErrorf/* = 3*/
)
```
### Function type parameters
```go
myFoo/*[int, string]*/(1, "hello")
```
### Parameter names
```go
parseInt(/* str: */ "123", /* radix: */ 8)
```
## Code Editing
### [Snippets](https://code.visualstudio.com/docs/editor/userdefinedsnippets)
Predefined snippets for quick coding. These snippets will appear as completion suggestions when you type. Users can also define their own custom snippets (see [Snippets in Visual Studio Code](https://code.visualstudio.com/docs/editor/userdefinedsnippets#_create-your-own-snippets)).
### Format and organize imports
Format code and organize imports, either manually or on save.
The extension formats Go code, organizes imports, and removes unused imports by default. For different behavior, please override per-language default settings following [the instruction](advanced#formatting-code-and-organizing-imports).
#### Organizing imports
When organizing imports, the imported packages are grouped in the default `goimports` style. In order to group some packages after 3rd-party packages, use the [`"formatting.local"`](settings#formattinglocal) setting.
```json
"gopls": {
"formatting.local": "example.com/myorg,github.com/myorg2"
}
```
#### Add import
The extension organizes imports automatically and can add missing imports if the package is present in your module cache already. However, you can also manually add a new import to your file through the [`Go: Add Import`](commands#go-add-import) command. Available packages are offered from module cache (or from your `GOPATH` in GOPATH mode).
#### Custom formatter
In addition to the default [`go fmt`](https://pkg.go.dev/cmd/gofmt) style formatter, the language server (`gopls`) supports `github.com/mvdan/gofumpt` style formmating. Use gopls's [`formatting.gofumpt`](settings#formattinggofumpt) setting:
```json
"gopls": { "fomatting.gofumpt": true }
```
You can also configure to use other custom formatter (`golines`) by using the `"go.formatTool"` setting. The custom formatter must operate on file contents from STDIN, and output the formatted result to STDOUT.
```json
"go.formatTools": "custom",
"go.alternateTools": {
// the binary name if it is in your PATH, or
// provide the exact path to your
// custom formatter.
"customFormatter": "golines"
}
```
### [Rename symbol](https://code.visualstudio.com/docs/editor/refactoring#_rename-symbol)
Rename all occurrences of a symbol in your workspace.
**Note**: For undo after rename to work on Windows, you need to have `diff` tool on your `PATH`.
This feature is not available if you are using Go modules **without** [`gopls`](gopls), the Go language server.
### Refactor
Select the area for refactoring (e.g. variable, function body, etc). Click on the Code Action light bulb icon
that appears in the selected area, or select "Refactoring..." or "Rename Symbol" from the VS Code Context menu.
For known issues with this feature see [golang/go#37170](https://github.com/golang/go/issues/37170).
## Code Generation
### Add or remove struct tags
Use the [`Go: Add Tags to Struct Fields`](commands#go-add-tags-to-struct-fields) command to automatically generate or remove [tags](https://pkg.go.dev/reflect?tab=doc#StructTag) for your struct. This feature is provided by the [`gomodifytags`](tools#gomodifytags) tool.
### Generate interface implementation
Use the [`Go: Generate Interface Stubs`](commands#go-generate-interface-stubs) command to automatically generate method stubs for a given interface. This feature is provided by the [`impl`](tools#impl) tool.
### Generate unit tests
Easily generate unit tests for your project by running one of the [`Go: Generate Unit Tests for ...`](commands#go-generate-unit-tests-for-file) commands. This can be done at a function, file, or package level. This feature is provided by the [`gotests`](tools#gotests) tool.
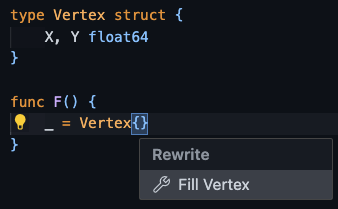
### Fill struct literals
Use the [Code Action](https://code.visualstudio.com/docs/editor/refactoring#_code-actions-quick-fixes-and-refactorings) to automatically fill a struct literal with its default values. The Go language server provides this capability as a `refactor.rewrite` type code action.
**Note**: The old "Go: Fill struct" command was removed in v0.40.0 in favor of the Code Action.
## Diagnostics
The extension, powered by the Go language server (`gopls`), offers various diagnostics and analyses features,
and often with quick fixes to address detected issues.
### Build errors
Compile and type errors are shown as you type by default. This works not only Go source code, but also `go.mod`, `go.work`, and Go template files.
### Vet and extra analyses
The Go language server (`gopls`) reports [`vet`](https://pkg.go.dev/cmd/vet) errors and runs many useful analyzers as you type. A full list of analyzers that `gopls` uses can be found in the [analyses settings section](https://github.com/golang/vscode-go/wiki/settings#uidiagnosticanalyses).
### Lint errors
You can configure an extra linter to run on file save. This behavior is configurable through the [`"go.lintOnSave"`](settings#go.lintOnSave) setting.
The default lint tool is [`staticcheck`]. Popular alternative linters such as [`golint`], [`golangci-lint`] and [`revive`] can be used instead by configuring the [`"go.lintTool"`](settings#go.lintTool) setting. For a complete overview of linter options, see the [documentation for diagnostic tools](tools#diagnostics).
### Analyze vulnerabilities in dependencies
The extension checks the 3rd party dependencies in your code and surfaces vulnerabilities known to the [Go vulnerability database](https://vuln.go.dev). There are two modes that complement each other.
* Import-based analysis: this can be enabled using the [`"go.diagnostic.vulncheck": "Imports"`](settings#go.diagnostic.vulncheck) setting. You can turn on and off this analysis conveniently with the ["Go: Toggle Vulncheck"](commands#go-toggle-vulncheck) command. In this mode, `gopls` reports vulnerabilities that affect packages directly and indirectly used by your code. The diagnostics are reported in the `go.mod` file along with quick fixes to help upgrading vulnerable modules.
* `Govulncheck` analysis: this is based on the [`golang.org/x/vuln/cmd/govulncheck`](https://pkg.go.dev/golang.org/x/vuln/cmd/govulncheck) tool, which is embedded in `gopls`. This provides a low-noise, reliable way to inspect known vulnerabilities. This only surfaces vulnerabilities that actually affect your code, based on which functions in your code are transitively calling vulnerable functions. This can be accessible by the `gopls` [`run_govulncheck`](settings#uicodelenses) code lens. The import-based analysis result also provides the `"Run govulncheck to verify"` option as a quick fix.
These features require _`gopls` v0.11.0 or newer_.
Please share your feedback at https://go.dev/s/vsc-vulncheck-feedback.
Report a bug and feature request in [our issue tracker](https://github.com/golang/vscode-go/issues/new).
**Notes and Caveats**
- The import-based analysis uses the list of packages in the workspace modules, which may be different from what you see from `go.mod` files if `go.work` or module `replace`/`exclude` is used.
- The govulncheck analysis result can become stale as you modify code or the Go vulnerability database is updated. In order to invalidate the analysis results manually, use the [`"Reset go.mod diagnostics"`] codelens shown on the top of the `go.mod` file. Otherwise, the result will be automatically invalidated after an hour.
- These features currently don't report vulnerabilities in the standard libraries or tool chains. We are still investigating UX on where to surface the findings and how to help users handle the issues.
- The extension does not scan private packages nor send any information on private modules. All the analysis is done by pulling a list of known vulnerable modules from the Go vulnerability database and then computing the intersection locally.
## Run and test in the editor
### Run your code
To run your code without debugging, use the keyboard shortcut `Ctrl+F5` or run the command `Debug: Start without Debugging`. To debug, see [Debugging](#debugging) below.
This command requires you to have a [launch configuration](debugging#launch-configuration) in a `launch.json` file. To open or create your `launch.json`, run the `Debug: Open launch.json` command. Use the default `Go: Launch file` configuration.
Behind the scenes, the `Debug: Start without Debugging` command calls `go run`. `go run` usually requires the path to the file to run, so your `launch.json` should contain `"program": "${file}"`.
### Test and benchmark
[Test UI](https://code.visualstudio.com/api/extension-guides/testing) and [Code lenses](https://code.visualstudio.com/blogs/2017/02/12/code-lens-roundup) allow users to easily run tests, benchmarks, and profiles for a given function, file, package, or workspace.
Alternatively, the same functionality is available through a set of commands: [`Go: Test Function At Cursor`](commands#go-test-function-at-cursor), [`Go: Test File`](commands#go-test-file), [`Go: Test Package`](commands#go-test-package), and [`Go: Test All Packages in Workspace`](commands#go-test-all-packages-in-workspace).
### Code Coverage
Show code coverage in the editor, either after running a test or on-demand. This can be done via the commands: [`Go: Apply Cover Profile`](commands#go-apply-cover-profile) and [`Go: Toggle Test Coverage in Current Package`](commands#go-toggle-test-coverage-in-current-package).
### Profiling
"Go Test: Profile" menu in [Test UI](https://code.visualstudio.com/api/extension-guides/testing) collects CPU/Memory/Mutex profiles and allows visualizing them using pprof (`go tool pprof`).
## [Debugging](debugging)
This extension offers debugging of Go programs. See the [debugging documentation](debugging) for more information.
## Other
### Go Playground
Export your current file to the [Go Playground](https://play.golang.org) via the [`Go: Run On Go Playground`](settings#go-run-on-go-playground) command. This is useful for quickly creating a piece of sample code.
[`gopls`]: gopls.md
[`staticcheck`]: https://staticcheck.io/
[`golint`]: https://pkg.go.dev/golang.org/x/lint/golint?tab=overview
[`golangci-lint`]: https://golangci-lint.run/
[`revive`]: https://github.com/mgechev/revive
---
[*✏️ Want to contribute to this wiki?*](https://github.com/golang/vscode-go/edit/master/docs/features.md)
Update [the source](https://github.com/golang/vscode-go/edit/master/docs/features.md) and send a PR.
 Go: Toggle Vulncheck (vulncheck.mp4)