This theme has some special modifications that make ridgeline plots look better, such as properly aligned y axis labels. It can draw plots with and without background grids (see examples).
theme_ridges(
  font_size = 14,
  font_family = "",
  line_size = 0.5,
  grid = TRUE,
  center_axis_labels = FALSE
)
Arguments
| font_size | Overall font size. Default is 14. |
|---|---|
| font_family | Default font family. |
| line_size | Default line size. |
| grid | If |
| center_axis_labels | If |
Value
The theme.
Examples
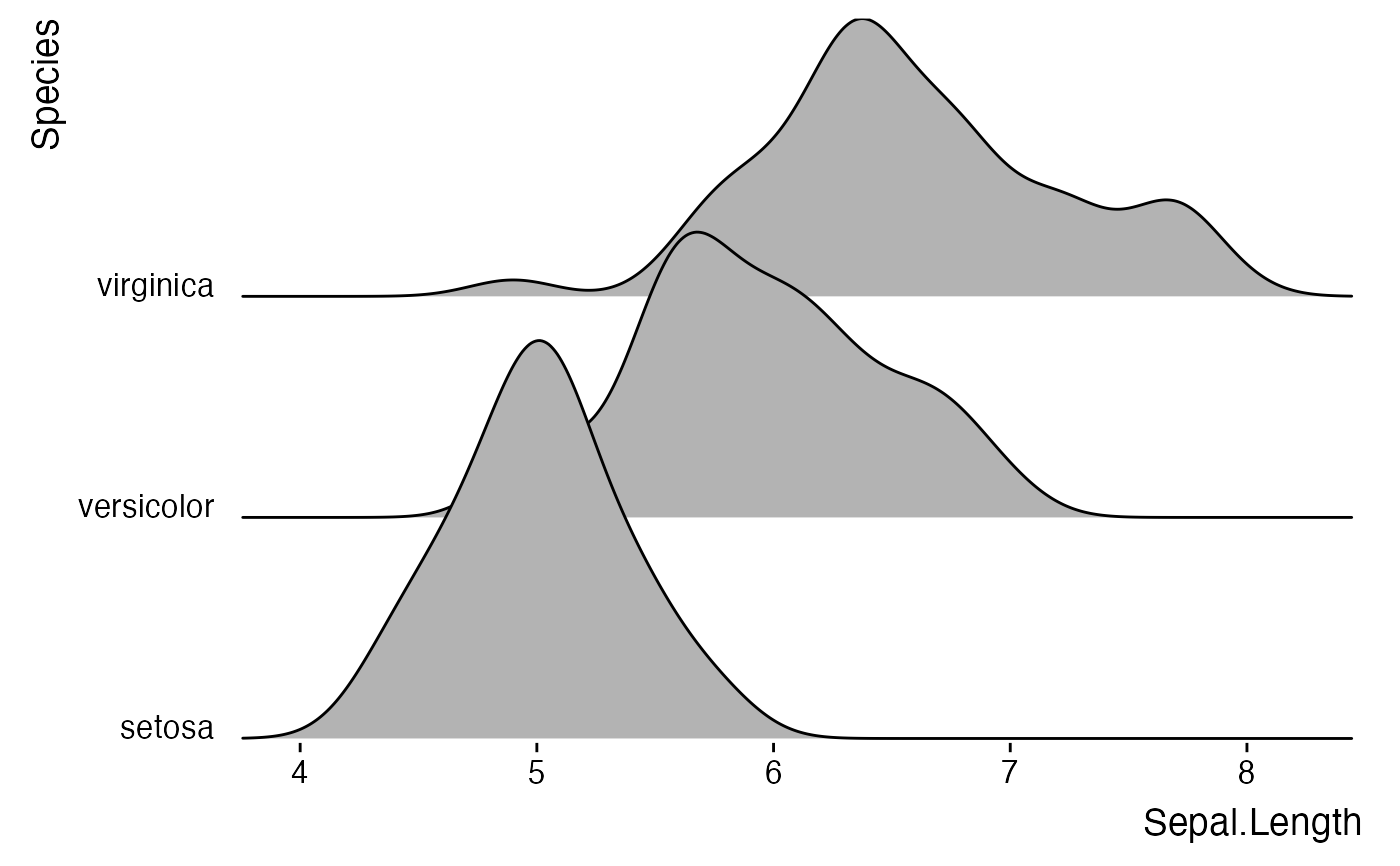
library(ggplot2) # Example with background grid ggplot(iris, aes(x = Sepal.Length, y = Species, group = Species)) + geom_density_ridges(rel_min_height = 0.005) + scale_y_discrete(expand = c(0.01, 0)) + scale_x_continuous(expand = c(0.01, 0)) + theme_ridges()#># Example without background grid ggplot(iris, aes(x = Sepal.Length, y = Species, group = Species)) + geom_density_ridges() + scale_y_discrete(expand = c(0.01, 0)) + scale_x_continuous(expand = c(0.01, 0)) + theme_ridges(grid = FALSE)#>