{
"cells": [
{
"cell_type": "markdown",
"metadata": {},
"source": [
"# Interannual variability of precipitation\n",
"> every year something new\n",
"\n",
"- toc: true \n",
"- badges: true\n",
"- comments: false\n",
"- categories: [jupyter]"
]
},
{
"cell_type": "markdown",
"metadata": {},
"source": [
"\n",
"\n",
"## hydrological year\n",
"\n",
"A time period of 12 months for which precipitation totals are measured. The hydrological year is designated by the calendar year in which it **ends**. \n",
"Let's define the hydrological year for Tel Aviv from 1 October to 30 September.\n",
"\n",
"האם אקלים הגשם שלנו משתנה\n",
"> youtube: https://youtu.be/v0uNpj03Rk4\n",
"\n",
"\n",
"\n",
"\n",
"\n",
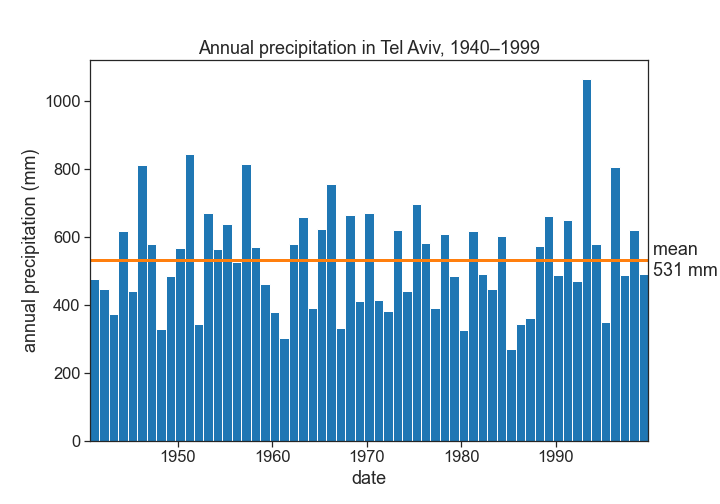
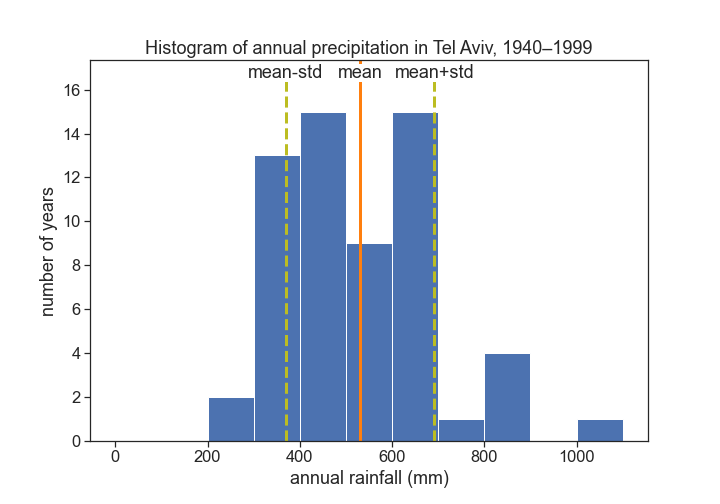
"## coefficient of variation\n",
"\n",
"$\\langle{P}\\rangle=$ average precipitation \n",
"$\\sigma=$ standard deviation\n",
"\n",
"$$CV = \\frac{\\sigma}{\\langle{P}\\rangle}$$\n",
"\n",
"Assuming that the inter-annual distribution is a gaussian: 67% of the time, rainfall will vary +/- 30% from its long term average in Tel Aviv.\n",
"\n",
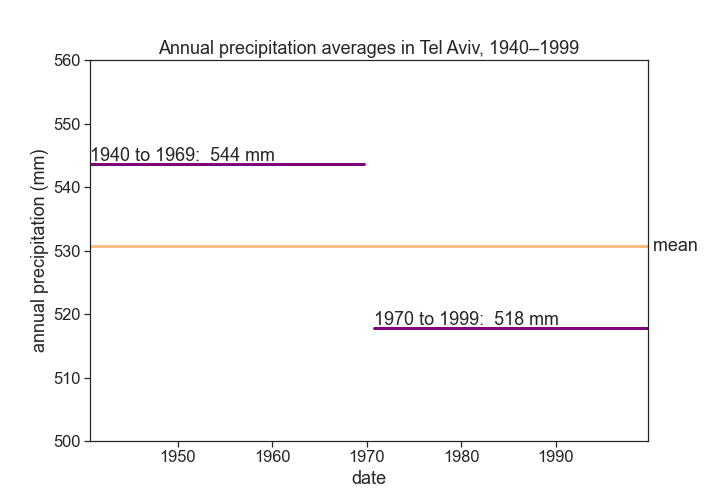
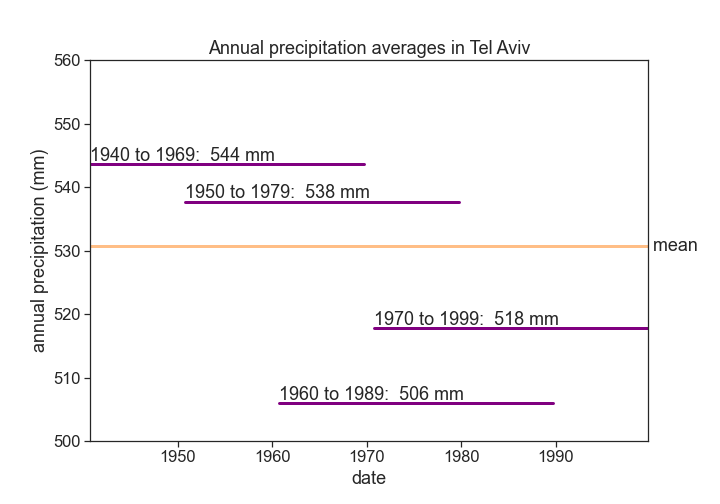
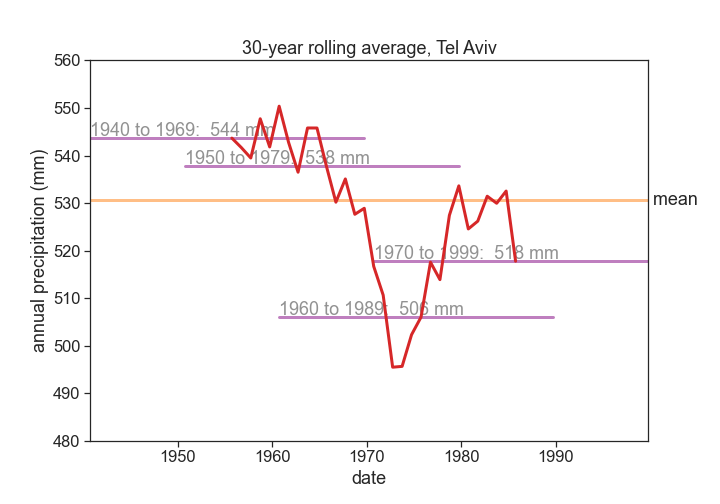
"Precipitation averages are [usually calculated for time intervals of 30 years](https://www.ncdc.noaa.gov/news/defining-climate-normals-new-ways).\n",
"\n",
"\n",
"\n",
""
]
},
{
"cell_type": "code",
"execution_count": 3,
"metadata": {},
"outputs": [
{
"data": {
"text/html": [
"\n",
"\n",
""
],
"text/plain": [
"alt.LayerChart(...)"
]
},
"execution_count": 3,
"metadata": {},
"output_type": "execute_result"
}
],
"source": [
"#collapse-hide\n",
"\n",
"import altair as alt\n",
"import pandas as pd\n",
"\n",
"df = pd.read_csv(\"TEL_AVIV_READING_monthly.csv\", sep=\",\")\n",
"# make 'DATE' the dataframe index\n",
"df['DATE'] = pd.to_datetime(df['DATE'])\n",
"df = df.set_index('DATE')\n",
"\n",
"df_year_all = df['PRCP'].resample('A-SEP').sum().to_frame() # annual frequency, anchored end of September\n",
"df_year_all.columns = ['rain (mm)'] # rename 'PRCP' column to 'rain (mm)'\n",
"df_year = df_year_all.iloc[:-1] # exclude last row\n",
"\n",
"# Altair only recognizes column data; it ignores index values.\n",
"# You can plot the index data by first resetting the index\n",
"# I know that I've just made 'DATE' the index, but I want to have this here nonetheless so I can refer to this in the future\n",
"source = df_year.reset_index()\n",
"brush = alt.selection(type='interval', encodings=['x'])\n",
"\n",
"# T: temporal, a time or date value\n",
"# Q: quantitative, a continuous real-valued quantity\n",
"# https://altair-viz.github.io/user_guide/encoding.html#encoding-data-types\n",
"bars = alt.Chart().mark_bar().encode(\n",
" x=alt.X('DATE:T', axis=alt.Axis(title='date')),\n",
" y=alt.Y('rain (mm):Q', axis=alt.Axis(title='annual precipitation (mm) and average')),\n",
" opacity=alt.condition(brush, alt.OpacityValue(1), alt.OpacityValue(0.2)),\n",
").add_selection(\n",
" brush\n",
").properties(\n",
" title='Select year range and drag for rolling average of annual precipitation in Tel Aviv'\n",
").properties(\n",
" width=600,\n",
" height=400\n",
")\n",
"\n",
"line = alt.Chart().mark_rule(color='orange').encode(\n",
" y='mean(rain (mm)):Q',\n",
" size=alt.SizeValue(3)\n",
").transform_filter(\n",
" brush\n",
")\n",
"\n",
"alt.layer(bars, line, data=source)"
]
},
{
"cell_type": "markdown",
"metadata": {},
"source": [
""
]
},
{
"cell_type": "code",
"execution_count": null,
"metadata": {},
"outputs": [],
"source": []
}
],
"metadata": {
"kernelspec": {
"display_name": "Python 3",
"language": "python",
"name": "python3"
},
"language_info": {
"codemirror_mode": {
"name": "ipython",
"version": 3
},
"file_extension": ".py",
"mimetype": "text/x-python",
"name": "python",
"nbconvert_exporter": "python",
"pygments_lexer": "ipython3",
"version": "3.7.4"
}
},
"nbformat": 4,
"nbformat_minor": 2
}