
 (中文版本请点击 [这里](https://github.com/zkwlx/ADI/wiki/ADI-%E7%AE%80%E4%BB%8B) )
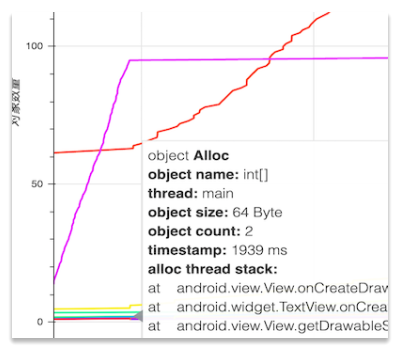 Object allocation, Click for try
|
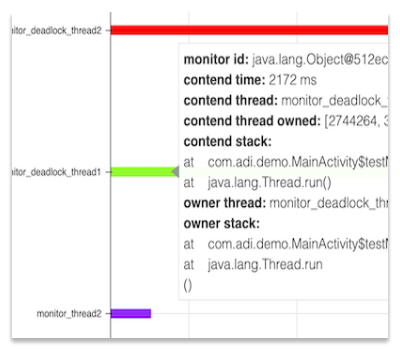 Multithreaded contended, Click for try
|
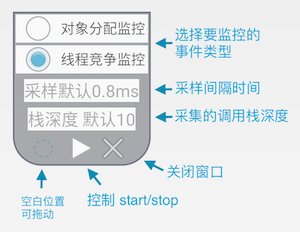
 ADI Controller
|
 ### Parse the Log file and generate a chart
The collected content is stored in the `Context.getExternalCacheDir()`/ADI directory, for example:
```bash
/sdcard/Android/data/APP Package Name/cache/ADI/adi_1570605092.log
```
After removing the Log file, you need to analyze the Log with `adi_analyzer` tool and generate a chart, which is installed via pip3:
```bash
pip3 install adi-analyzer
```
Then run adi_analyzer and pass the log file:
```bash
adi-analyzer ~/adi_1570605092.log
```
adi_anaylzer will create a chart file ending in .html, and then automatically launch the browser to open the chart file. Please refer to the cover for the effect of the chart.
# Detailed function
## Object allocation monitoring
When monitoring object allocation, ADI will monitor the creation events of Java layer objects. There are several points to note:
* Frequently creating objects can cause APPs to get stuck or even get ANR. The sampling interval can be configured via [ADIConfig.sampleIntervalMs](https://github.com/zkwlx/ADI/blob/master/adi_lib/adi/src/main/java/com/adi/ADIConfig.java#L68) or control window (default 0.8 ms)
* The depth of the call stack defaults to 10. Can be modified by [ADIConfig.stackDepth](https://github.com/zkwlx/ADI/blob/master/adi_lib/adi/src/main/java/com/adi/ADIConfig.java#L68) or control window.
* If the generated Log file is too large to affect the chart generation time, it is recommended to increase the sampling interval or reduce the overall sampling duration.
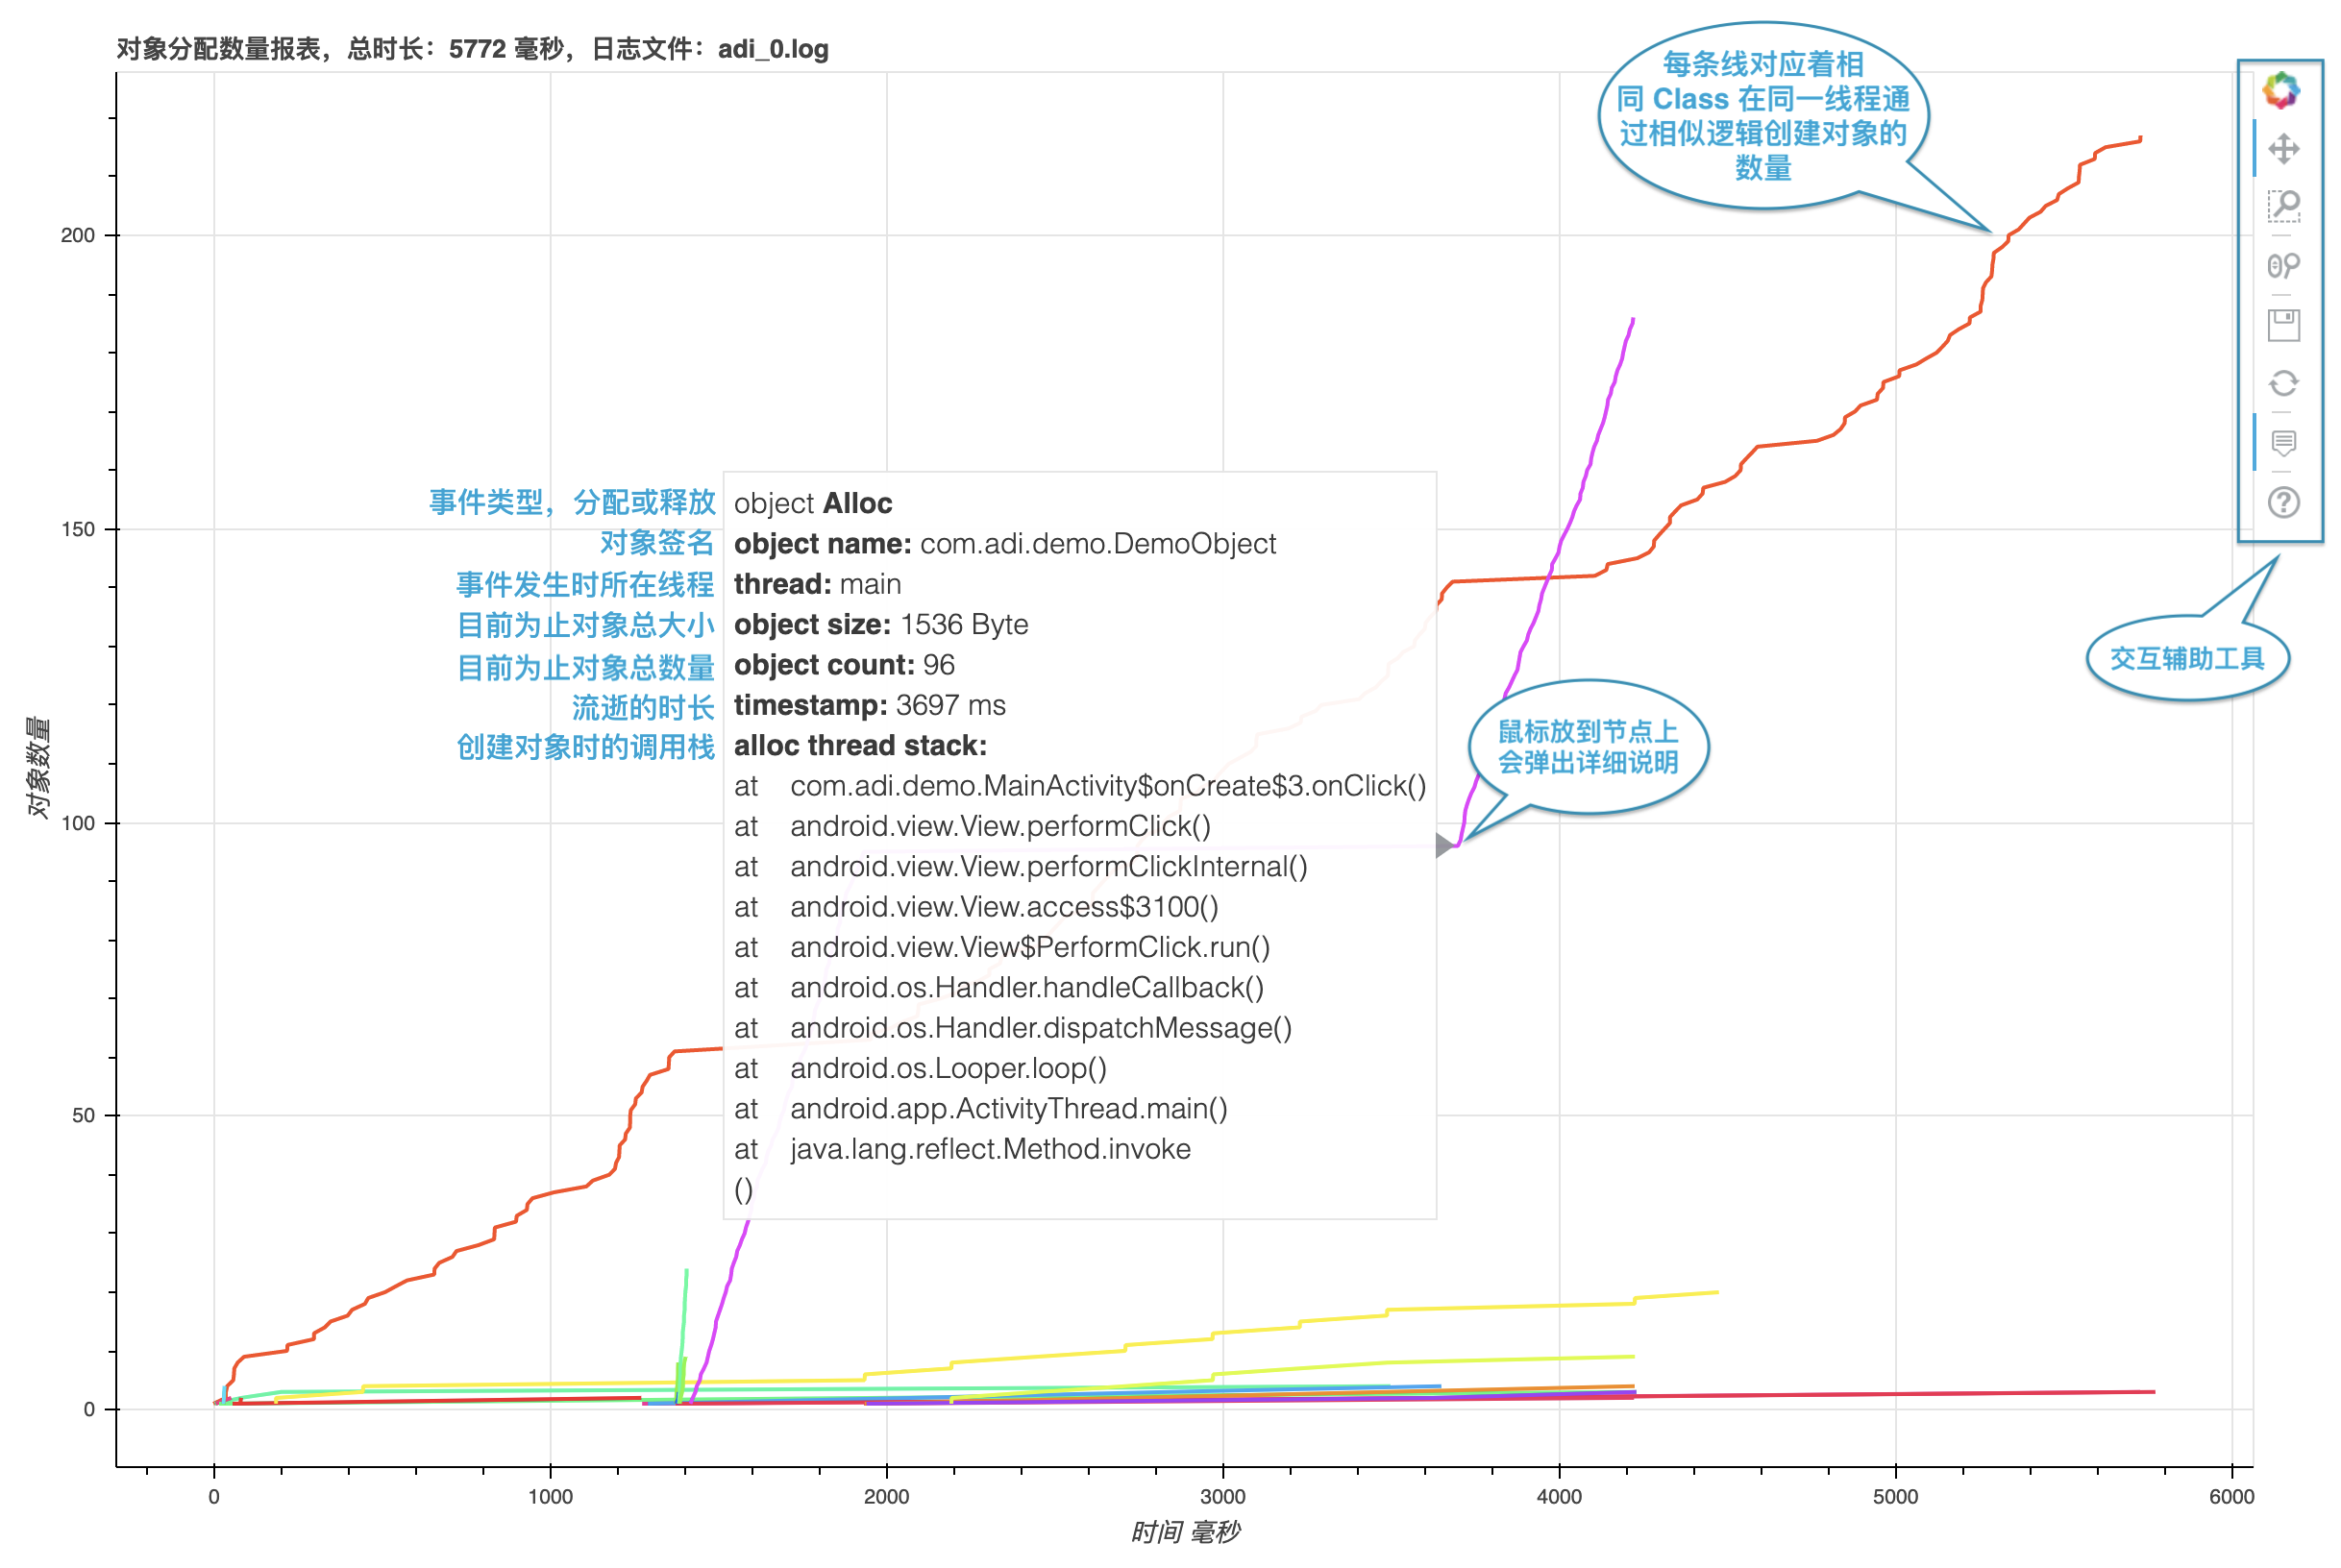
ADI generates two charts for the Log of the object event: the object allocation quantity chart and the object allocation size chart. Let's use the Object allocation chart to describe how to use the chart below.
### Parse the Log file and generate a chart
The collected content is stored in the `Context.getExternalCacheDir()`/ADI directory, for example:
```bash
/sdcard/Android/data/APP Package Name/cache/ADI/adi_1570605092.log
```
After removing the Log file, you need to analyze the Log with `adi_analyzer` tool and generate a chart, which is installed via pip3:
```bash
pip3 install adi-analyzer
```
Then run adi_analyzer and pass the log file:
```bash
adi-analyzer ~/adi_1570605092.log
```
adi_anaylzer will create a chart file ending in .html, and then automatically launch the browser to open the chart file. Please refer to the cover for the effect of the chart.
# Detailed function
## Object allocation monitoring
When monitoring object allocation, ADI will monitor the creation events of Java layer objects. There are several points to note:
* Frequently creating objects can cause APPs to get stuck or even get ANR. The sampling interval can be configured via [ADIConfig.sampleIntervalMs](https://github.com/zkwlx/ADI/blob/master/adi_lib/adi/src/main/java/com/adi/ADIConfig.java#L68) or control window (default 0.8 ms)
* The depth of the call stack defaults to 10. Can be modified by [ADIConfig.stackDepth](https://github.com/zkwlx/ADI/blob/master/adi_lib/adi/src/main/java/com/adi/ADIConfig.java#L68) or control window.
* If the generated Log file is too large to affect the chart generation time, it is recommended to increase the sampling interval or reduce the overall sampling duration.
ADI generates two charts for the Log of the object event: the object allocation quantity chart and the object allocation size chart. Let's use the Object allocation chart to describe how to use the chart below.
 Click for try
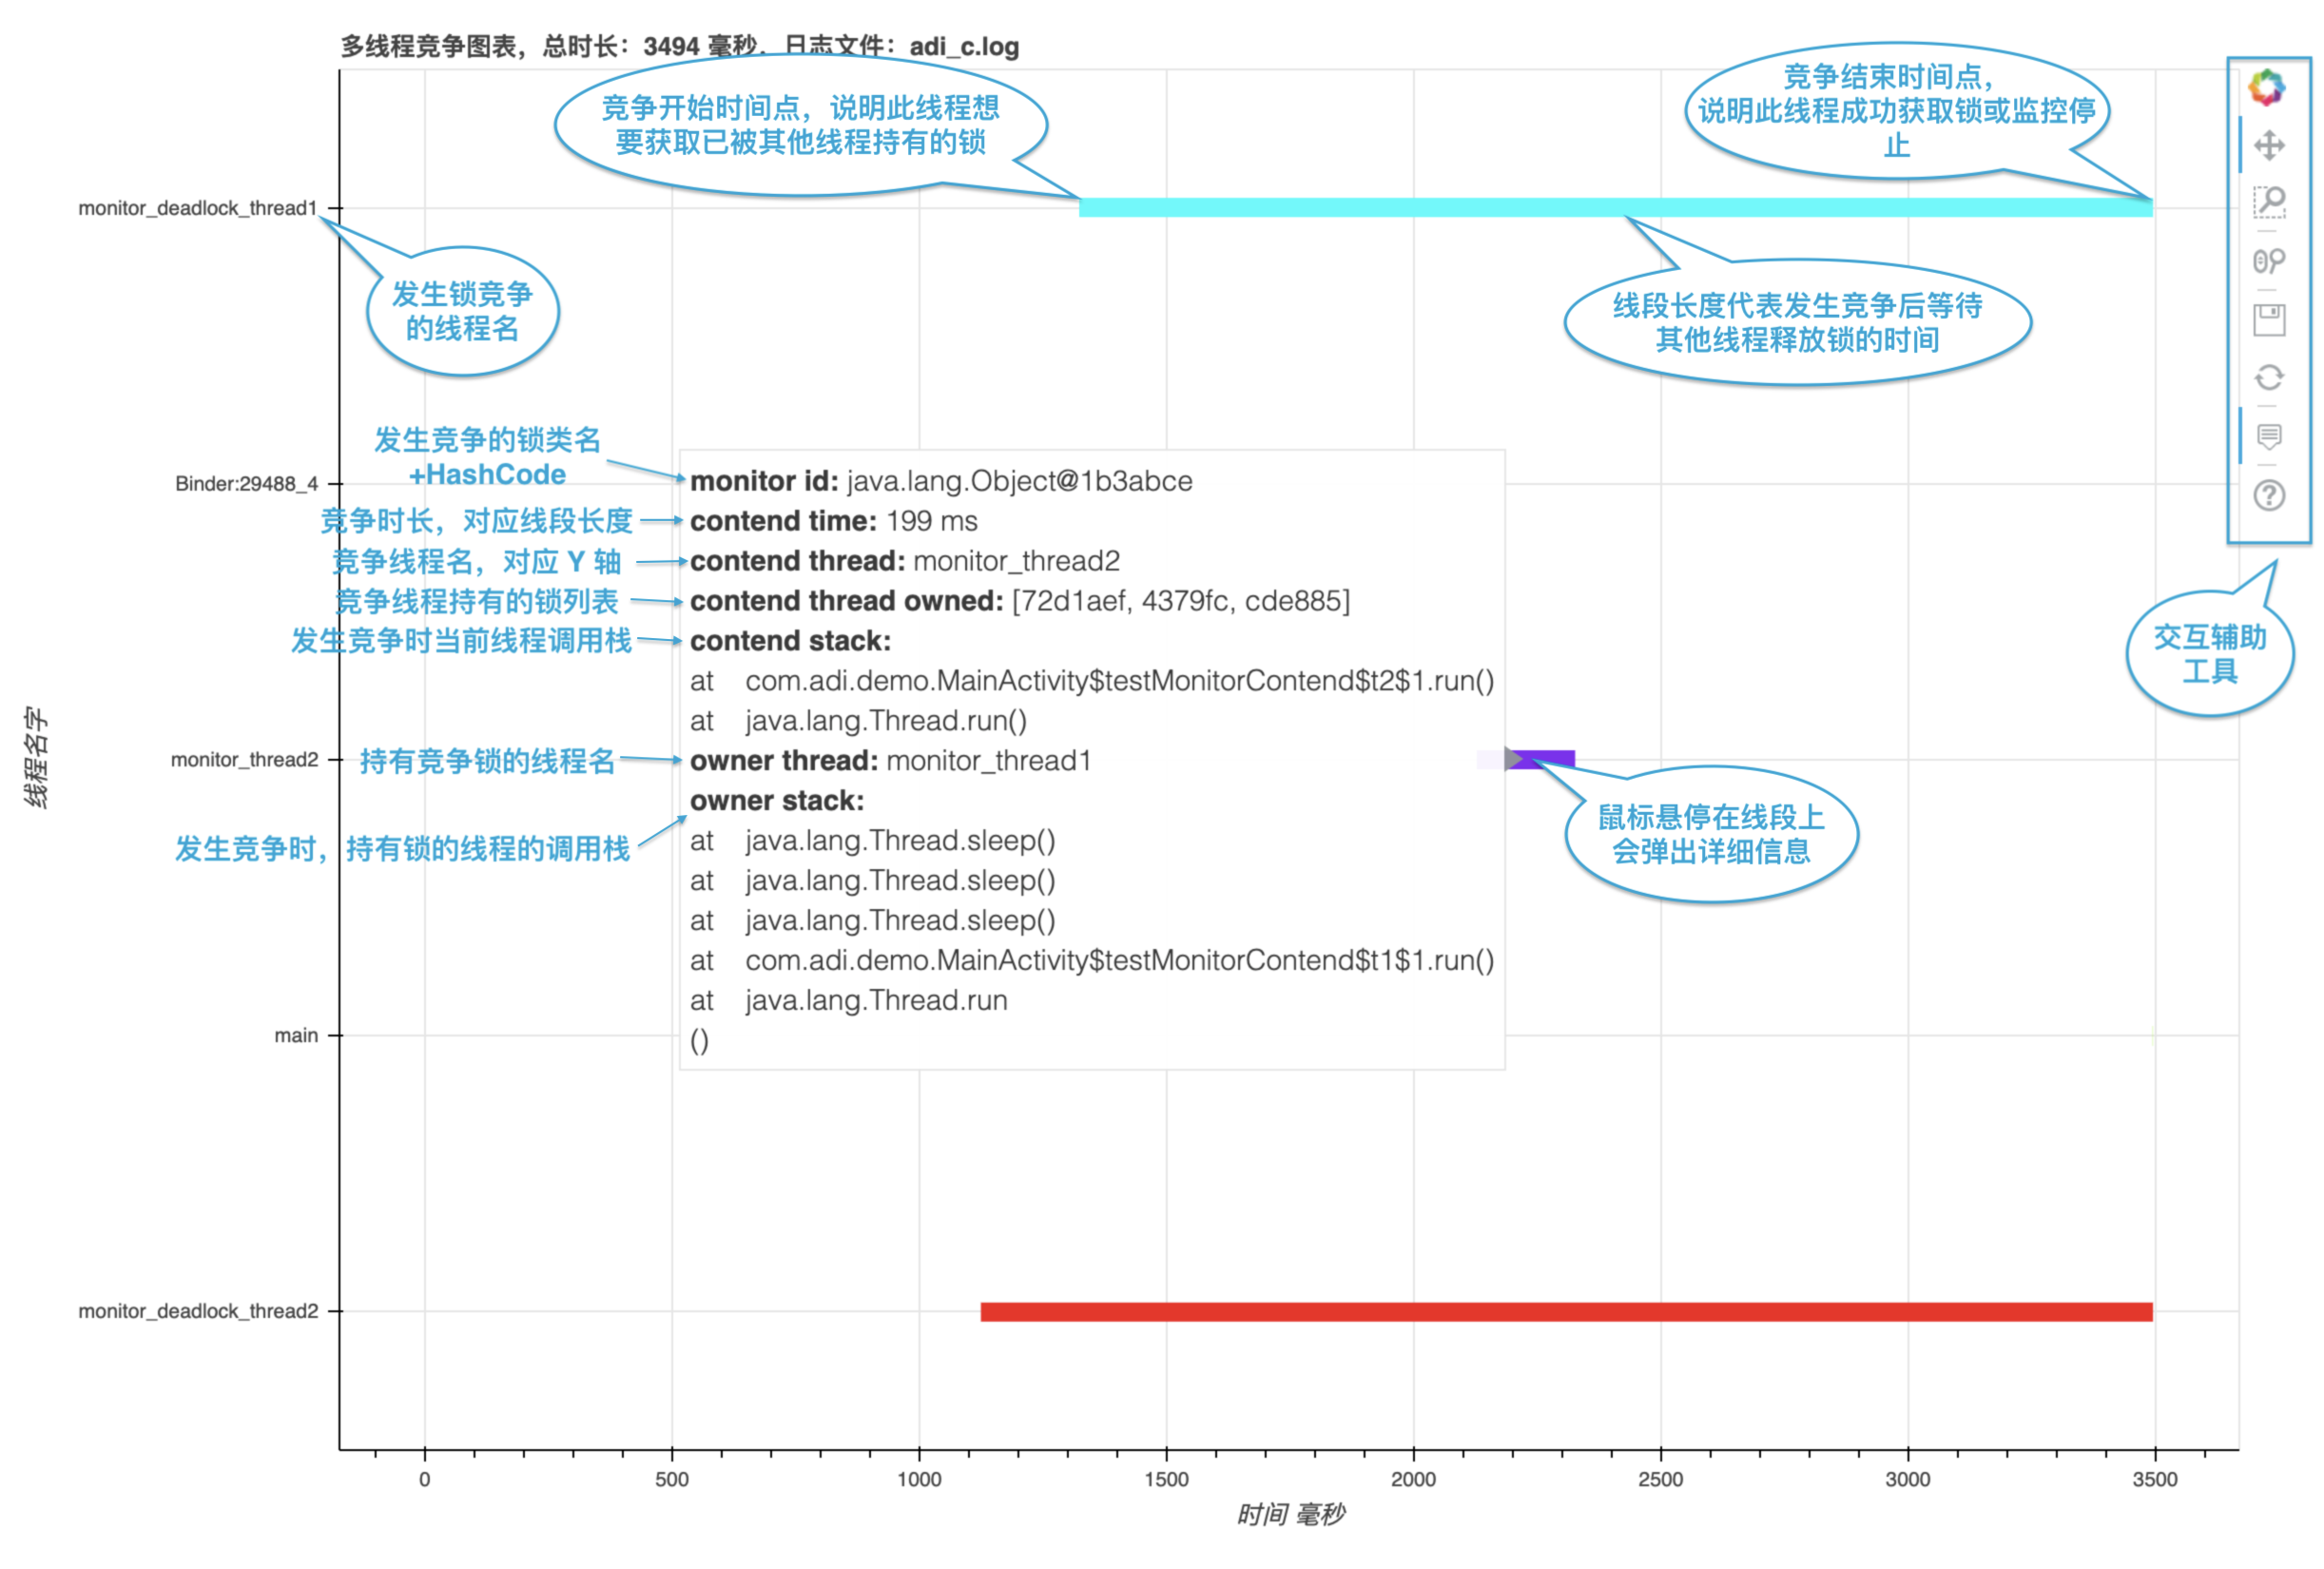
## Multi-threaded competition monitoring
When monitoring multi-threaded contention, ADI monitors multi-threaded lock contention events caused by the `synchronized` keywords of all Java layers.
The following points need to be noted:
* The depth of the call stack defaults to 10 and can be modified via [ADIConfig.stackDepth](https://github.com/zkwlx/ADI/blob/master/adi_lib/adi/src/main/java/com/adi/ADIConfig.java#L68) or the control window.
* If the generated Log file is too large to affect the chart generation time, it is recommended to reduce the sampling duration.
The Y-axis of the multi-threaded competition chart is the name of the thread in which the competition occurs, and the X-axis is the time. For details, see the diagram.
Click for try
## Multi-threaded competition monitoring
When monitoring multi-threaded contention, ADI monitors multi-threaded lock contention events caused by the `synchronized` keywords of all Java layers.
The following points need to be noted:
* The depth of the call stack defaults to 10 and can be modified via [ADIConfig.stackDepth](https://github.com/zkwlx/ADI/blob/master/adi_lib/adi/src/main/java/com/adi/ADIConfig.java#L68) or the control window.
* If the generated Log file is too large to affect the chart generation time, it is recommended to reduce the sampling duration.
The Y-axis of the multi-threaded competition chart is the name of the thread in which the competition occurs, and the X-axis is the time. For details, see the diagram.
 Click for try
# License
```
Copyright 2019 Square, Inc.
Licensed under the Apache License, Version 2.0 (the "License");
you may not use this file except in compliance with the License.
You may obtain a copy of the License at
http://www.apache.org/licenses/LICENSE-2.0
Unless required by applicable law or agreed to in writing, software
distributed under the License is distributed on an "AS IS" BASIS,
WITHOUT WARRANTIES OR CONDITIONS OF ANY KIND, either express or implied.
See the License for the specific language governing permissions and
limitations under the License.
```
Click for try
# License
```
Copyright 2019 Square, Inc.
Licensed under the Apache License, Version 2.0 (the "License");
you may not use this file except in compliance with the License.
You may obtain a copy of the License at
http://www.apache.org/licenses/LICENSE-2.0
Unless required by applicable law or agreed to in writing, software
distributed under the License is distributed on an "AS IS" BASIS,
WITHOUT WARRANTIES OR CONDITIONS OF ANY KIND, either express or implied.
See the License for the specific language governing permissions and
limitations under the License.
```