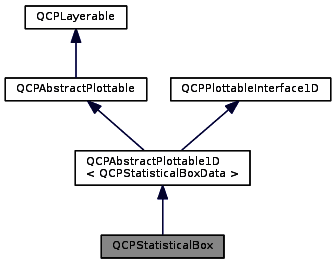
A plottable representing a single statistical box in a plot. More...
Public Functions | |
| QCPStatisticalBox (QCPAxis *keyAxis, QCPAxis *valueAxis) | |
| QSharedPointer< QCPStatisticalBoxDataContainer > | data () const |
| double | width () const |
| double | whiskerWidth () const |
| QPen | whiskerPen () const |
| QPen | whiskerBarPen () const |
| bool | whiskerAntialiased () const |
| QPen | medianPen () const |
| QCPScatterStyle | outlierStyle () const |
| void | setData (QSharedPointer< QCPStatisticalBoxDataContainer > data) |
| void | setData (const QVector< double > &keys, const QVector< double > &minimum, const QVector< double > &lowerQuartile, const QVector< double > &median, const QVector< double > &upperQuartile, const QVector< double > &maximum, bool alreadySorted=false) |
| void | setWidth (double width) |
| void | setWhiskerWidth (double width) |
| void | setWhiskerPen (const QPen &pen) |
| void | setWhiskerBarPen (const QPen &pen) |
| void | setWhiskerAntialiased (bool enabled) |
| void | setMedianPen (const QPen &pen) |
| void | setOutlierStyle (const QCPScatterStyle &style) |
| void | addData (const QVector< double > &keys, const QVector< double > &minimum, const QVector< double > &lowerQuartile, const QVector< double > &median, const QVector< double > &upperQuartile, const QVector< double > &maximum, bool alreadySorted=false) |
| void | addData (double key, double minimum, double lowerQuartile, double median, double upperQuartile, double maximum, const QVector< double > &outliers=QVector< double >()) |
| virtual QCPDataSelection | selectTestRect (const QRectF &rect, bool onlySelectable) const |
| virtual double | selectTest (const QPointF &pos, bool onlySelectable, QVariant *details=0) const |
| virtual QCPRange | getKeyRange (bool &foundRange, QCP::SignDomain inSignDomain=QCP::sdBoth) const |
| virtual QCPRange | getValueRange (bool &foundRange, QCP::SignDomain inSignDomain=QCP::sdBoth, const QCPRange &inKeyRange=QCPRange()) const |
 Public Functions inherited from QCPAbstractPlottable1D< QCPStatisticalBoxData > Public Functions inherited from QCPAbstractPlottable1D< QCPStatisticalBoxData > | |
| QCPAbstractPlottable1D (QCPAxis *keyAxis, QCPAxis *valueAxis) | |
| virtual int | dataCount () const |
| virtual double | dataMainKey (int index) const |
| virtual double | dataSortKey (int index) const |
| virtual double | dataMainValue (int index) const |
| virtual QCPRange | dataValueRange (int index) const |
| virtual QPointF | dataPixelPosition (int index) const |
| virtual bool | sortKeyIsMainKey () const |
| virtual int | findBegin (double sortKey, bool expandedRange=true) const |
| virtual int | findEnd (double sortKey, bool expandedRange=true) const |
| virtual QCPPlottableInterface1D * | interface1D () |
| Public Functions inherited from QCPAbstractPlottable | |
| QCPAbstractPlottable (QCPAxis *keyAxis, QCPAxis *valueAxis) | |
| QString | name () const |
| bool | antialiasedFill () const |
| bool | antialiasedScatters () const |
| QPen | pen () const |
| QBrush | brush () const |
| QCPAxis * | keyAxis () const |
| QCPAxis * | valueAxis () const |
| QCP::SelectionType | selectable () const |
| bool | selected () const |
| QCPDataSelection | selection () const |
| QCPSelectionDecorator * | selectionDecorator () const |
| void | setName (const QString &name) |
| void | setAntialiasedFill (bool enabled) |
| void | setAntialiasedScatters (bool enabled) |
| void | setPen (const QPen &pen) |
| void | setBrush (const QBrush &brush) |
| void | setKeyAxis (QCPAxis *axis) |
| void | setValueAxis (QCPAxis *axis) |
| Q_SLOT void | setSelectable (QCP::SelectionType selectable) |
| Q_SLOT void | setSelection (QCPDataSelection selection) |
| void | setSelectionDecorator (QCPSelectionDecorator *decorator) |
| void | coordsToPixels (double key, double value, double &x, double &y) const |
| const QPointF | coordsToPixels (double key, double value) const |
| void | pixelsToCoords (double x, double y, double &key, double &value) const |
| void | pixelsToCoords (const QPointF &pixelPos, double &key, double &value) const |
| void | rescaleAxes (bool onlyEnlarge=false) const |
| void | rescaleKeyAxis (bool onlyEnlarge=false) const |
| void | rescaleValueAxis (bool onlyEnlarge=false, bool inKeyRange=false) const |
| bool | addToLegend (QCPLegend *legend) |
| bool | addToLegend () |
| bool | removeFromLegend (QCPLegend *legend) const |
| bool | removeFromLegend () const |
| Public Functions inherited from QCPLayerable | |
| QCPLayerable (QCustomPlot *plot, QString targetLayer=QString(), QCPLayerable *parentLayerable=0) | |
| bool | visible () const |
| QCustomPlot * | parentPlot () const |
| QCPLayerable * | parentLayerable () const |
| QCPLayer * | layer () const |
| bool | antialiased () const |
| void | setVisible (bool on) |
| Q_SLOT bool | setLayer (QCPLayer *layer) |
| bool | setLayer (const QString &layerName) |
| void | setAntialiased (bool enabled) |
| bool | realVisibility () const |
Protected Functions | |
| virtual void | draw (QCPPainter *painter) |
| virtual void | drawLegendIcon (QCPPainter *painter, const QRectF &rect) const |
| virtual void | drawStatisticalBox (QCPPainter *painter, QCPStatisticalBoxDataContainer::const_iterator it, const QCPScatterStyle &outlierStyle) const |
| void | getVisibleDataBounds (QCPStatisticalBoxDataContainer::const_iterator &begin, QCPStatisticalBoxDataContainer::const_iterator &end) const |
| QRectF | getQuartileBox (QCPStatisticalBoxDataContainer::const_iterator it) const |
| QVector< QLineF > | getWhiskerBackboneLines (QCPStatisticalBoxDataContainer::const_iterator it) const |
| QVector< QLineF > | getWhiskerBarLines (QCPStatisticalBoxDataContainer::const_iterator it) const |
| Protected Functions inherited from QCPAbstractPlottable1D< QCPStatisticalBoxData > | |
| void | getDataSegments (QList< QCPDataRange > &selectedSegments, QList< QCPDataRange > &unselectedSegments) const |
| void | drawPolyline (QCPPainter *painter, const QVector< QPointF > &lineData) const |
| Protected Functions inherited from QCPAbstractPlottable | |
| virtual QRect | clipRect () const |
| virtual QCP::Interaction | selectionCategory () const |
| void | applyDefaultAntialiasingHint (QCPPainter *painter) const |
| virtual void | selectEvent (QMouseEvent *event, bool additive, const QVariant &details, bool *selectionStateChanged) |
| virtual void | deselectEvent (bool *selectionStateChanged) |
| void | applyFillAntialiasingHint (QCPPainter *painter) const |
| void | applyScattersAntialiasingHint (QCPPainter *painter) const |
| Protected Functions inherited from QCPLayerable | |
| virtual void | parentPlotInitialized (QCustomPlot *parentPlot) |
| virtual void | mousePressEvent (QMouseEvent *event, const QVariant &details) |
| virtual void | mouseMoveEvent (QMouseEvent *event, const QPointF &startPos) |
| virtual void | mouseReleaseEvent (QMouseEvent *event, const QPointF &startPos) |
| virtual void | mouseDoubleClickEvent (QMouseEvent *event, const QVariant &details) |
| virtual void | wheelEvent (QWheelEvent *event) |
| void | initializeParentPlot (QCustomPlot *parentPlot) |
| void | setParentLayerable (QCPLayerable *parentLayerable) |
| bool | moveToLayer (QCPLayer *layer, bool prepend) |
| void | applyAntialiasingHint (QCPPainter *painter, bool localAntialiased, QCP::AntialiasedElement overrideElement) const |
Additional Inherited Members | |
| Signals inherited from QCPAbstractPlottable | |
| void | selectionChanged (bool selected) |
| void | selectionChanged (const QCPDataSelection &selection) |
| void | selectableChanged (QCP::SelectionType selectable) |
| Signals inherited from QCPLayerable | |
| void | layerChanged (QCPLayer *newLayer) |
Detailed Description
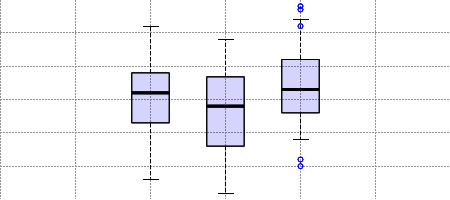
A plottable representing a single statistical box in a plot.
To plot data, assign it with the setData or addData functions. Alternatively, you can also access and modify the data via the data method, which returns a pointer to the internal QCPStatisticalBoxDataContainer.
Additionally each data point can itself have a list of outliers, drawn as scatter points at the key coordinate of the respective statistical box data point. They can either be set by using the respective addData method or accessing the individual data points through data, and setting the QVector<double> outliers of the data points directly.
Changing the appearance
The appearance of each data point box, ranging from the lower to the upper quartile, is controlled via setPen and setBrush. You may change the width of the boxes with setWidth in plot coordinates.
Each data point's visual representation also consists of two whiskers. Whiskers are the lines which reach from the upper quartile to the maximum, and from the lower quartile to the minimum. The appearance of the whiskers can be modified with: setWhiskerPen, setWhiskerBarPen, setWhiskerWidth. The whisker width is the width of the bar perpendicular to the whisker at the top (for maximum) and bottom (for minimum). If the whisker pen is changed, make sure to set the capStyle to Qt::FlatCap. Otherwise the backbone line might exceed the whisker bars by a few pixels due to the pen cap being not perfectly flat.
The median indicator line inside the box has its own pen, setMedianPen.
The outlier data points are drawn as normal scatter points. Their look can be controlled with setOutlierStyle
Usage
Like all data representing objects in QCustomPlot, the QCPStatisticalBox is a plottable (QCPAbstractPlottable). So the plottable-interface of QCustomPlot applies (QCustomPlot::plottable, QCustomPlot::removePlottable, etc.)
Usually, you first create an instance:
which registers it with the QCustomPlot instance of the passed axes. Note that this QCustomPlot instance takes ownership of the plottable, so do not delete it manually but use QCustomPlot::removePlottable() instead. The newly created plottable can be modified, e.g.:
Constructor & Destructor Documentation
§ QCPStatisticalBox()
Constructs a statistical box which uses keyAxis as its key axis ("x") and valueAxis as its value axis ("y"). keyAxis and valueAxis must reside in the same QCustomPlot instance and not have the same orientation. If either of these restrictions is violated, a corresponding message is printed to the debug output (qDebug), the construction is not aborted, though.
The created QCPStatisticalBox is automatically registered with the QCustomPlot instance inferred from keyAxis. This QCustomPlot instance takes ownership of the QCPStatisticalBox, so do not delete it manually but use QCustomPlot::removePlottable() instead.
Member Function Documentation
§ data()
|
inline |
Returns a shared pointer to the internal data storage of type QCPStatisticalBoxDataContainer. You may use it to directly manipulate the data, which may be more convenient and faster than using the regular setData or addData methods.
§ setData() [1/2]
| void QCPStatisticalBox::setData | ( | QSharedPointer< QCPStatisticalBoxDataContainer > | data | ) |
This is an overloaded function.
Replaces the current data container with the provided data container.
Since a QSharedPointer is used, multiple QCPStatisticalBoxes may share the same data container safely. Modifying the data in the container will then affect all statistical boxes that share the container. Sharing can be achieved by simply exchanging the data containers wrapped in shared pointers:
If you do not wish to share containers, but create a copy from an existing container, rather use the QCPDataContainer<DataType>::set method on the statistical box data container directly:
- See also
- addData
§ setData() [2/2]
| void QCPStatisticalBox::setData | ( | const QVector< double > & | keys, |
| const QVector< double > & | minimum, | ||
| const QVector< double > & | lowerQuartile, | ||
| const QVector< double > & | median, | ||
| const QVector< double > & | upperQuartile, | ||
| const QVector< double > & | maximum, | ||
| bool | alreadySorted = false |
||
| ) |
This is an overloaded function.
Replaces the current data with the provided points in keys, minimum, lowerQuartile, median, upperQuartile and maximum. The provided vectors should have equal length. Else, the number of added points will be the size of the smallest vector.
If you can guarantee that the passed data points are sorted by keys in ascending order, you can set alreadySorted to true, to improve performance by saving a sorting run.
- See also
- addData
§ setWidth()
| void QCPStatisticalBox::setWidth | ( | double | width | ) |
Sets the width of the boxes in key coordinates.
- See also
- setWhiskerWidth
§ setWhiskerWidth()
| void QCPStatisticalBox::setWhiskerWidth | ( | double | width | ) |
Sets the width of the whiskers in key coordinates.
Whiskers are the lines which reach from the upper quartile to the maximum, and from the lower quartile to the minimum.
- See also
- setWidth
§ setWhiskerPen()
| void QCPStatisticalBox::setWhiskerPen | ( | const QPen & | pen | ) |
Sets the pen used for drawing the whisker backbone.
Whiskers are the lines which reach from the upper quartile to the maximum, and from the lower quartile to the minimum.
Make sure to set the capStyle of the passed pen to Qt::FlatCap. Otherwise the backbone line might exceed the whisker bars by a few pixels due to the pen cap being not perfectly flat.
- See also
- setWhiskerBarPen
§ setWhiskerBarPen()
| void QCPStatisticalBox::setWhiskerBarPen | ( | const QPen & | pen | ) |
Sets the pen used for drawing the whisker bars. Those are the lines parallel to the key axis at each end of the whisker backbone.
Whiskers are the lines which reach from the upper quartile to the maximum, and from the lower quartile to the minimum.
- See also
- setWhiskerPen
§ setWhiskerAntialiased()
| void QCPStatisticalBox::setWhiskerAntialiased | ( | bool | enabled | ) |
Sets whether the statistical boxes whiskers are drawn with antialiasing or not.
Note that antialiasing settings may be overridden by QCustomPlot::setAntialiasedElements and QCustomPlot::setNotAntialiasedElements.
§ setMedianPen()
| void QCPStatisticalBox::setMedianPen | ( | const QPen & | pen | ) |
Sets the pen used for drawing the median indicator line inside the statistical boxes.
§ setOutlierStyle()
| void QCPStatisticalBox::setOutlierStyle | ( | const QCPScatterStyle & | style | ) |
Sets the appearance of the outlier data points.
Outliers can be specified with the method addData(double key, double minimum, double lowerQuartile, double median, double upperQuartile, double maximum, const QVector<double> &outliers)
§ addData() [1/2]
| void QCPStatisticalBox::addData | ( | const QVector< double > & | keys, |
| const QVector< double > & | minimum, | ||
| const QVector< double > & | lowerQuartile, | ||
| const QVector< double > & | median, | ||
| const QVector< double > & | upperQuartile, | ||
| const QVector< double > & | maximum, | ||
| bool | alreadySorted = false |
||
| ) |
This is an overloaded function.
Adds the provided points in keys, minimum, lowerQuartile, median, upperQuartile and maximum to the current data. The provided vectors should have equal length. Else, the number of added points will be the size of the smallest vector.
If you can guarantee that the passed data points are sorted by keys in ascending order, you can set alreadySorted to true, to improve performance by saving a sorting run.
Alternatively, you can also access and modify the data directly via the data method, which returns a pointer to the internal data container.
§ addData() [2/2]
| void QCPStatisticalBox::addData | ( | double | key, |
| double | minimum, | ||
| double | lowerQuartile, | ||
| double | median, | ||
| double | upperQuartile, | ||
| double | maximum, | ||
| const QVector< double > & | outliers = QVector<double>() |
||
| ) |
This is an overloaded function.
Adds the provided data point as key, minimum, lowerQuartile, median, upperQuartile and maximum to the current data.
Alternatively, you can also access and modify the data directly via the data method, which returns a pointer to the internal data container.
§ selectTestRect()
|
virtual |
Returns a data selection containing all the data points of this plottable which are contained (or hit by) rect. This is used mainly in the selection rect interaction for data selection (data selection mechanism).
If onlySelectable is true, an empty QCPDataSelection is returned if this plottable is not selectable (i.e. if QCPAbstractPlottable::setSelectable is QCP::stNone).
- Note
- rect must be a normalized rect (positive or zero width and height). This is especially important when using the rect of QCPSelectionRect::accepted, which is not necessarily normalized. Use
QRect::normalized()when passing a rect which might not be normalized.
Reimplemented from QCPAbstractPlottable1D< QCPStatisticalBoxData >.
§ selectTest()
|
virtual |
Implements a selectTest specific to this plottable's point geometry.
If details is not 0, it will be set to a QCPDataSelection, describing the closest data point to pos.
For general information about this virtual method, see the base class implementation. QCPAbstractPlottable::selectTest
Reimplemented from QCPAbstractPlottable1D< QCPStatisticalBoxData >.
§ getKeyRange()
|
virtual |
Returns the coordinate range that all data in this plottable span in the key axis dimension. For logarithmic plots, one can set inSignDomain to either QCP::sdNegative or QCP::sdPositive in order to restrict the returned range to that sign domain. E.g. when only negative range is wanted, set inSignDomain to QCP::sdNegative and all positive points will be ignored for range calculation. For no restriction, just set inSignDomain to QCP::sdBoth (default). foundRange is an output parameter that indicates whether a range could be found or not. If this is false, you shouldn't use the returned range (e.g. no points in data).
Note that foundRange is not the same as QCPRange::validRange, since the range returned by this function may have size zero (e.g. when there is only one data point). In this case foundRange would return true, but the returned range is not a valid range in terms of QCPRange::validRange.
- See also
- rescaleAxes, getValueRange
Implements QCPAbstractPlottable.
§ getValueRange()
|
virtual |
Returns the coordinate range that the data points in the specified key range (inKeyRange) span in the value axis dimension. For logarithmic plots, one can set inSignDomain to either QCP::sdNegative or QCP::sdPositive in order to restrict the returned range to that sign domain. E.g. when only negative range is wanted, set inSignDomain to QCP::sdNegative and all positive points will be ignored for range calculation. For no restriction, just set inSignDomain to QCP::sdBoth (default). foundRange is an output parameter that indicates whether a range could be found or not. If this is false, you shouldn't use the returned range (e.g. no points in data).
If inKeyRange has both lower and upper bound set to zero (is equal to QCPRange()), all data points are considered, without any restriction on the keys.
Note that foundRange is not the same as QCPRange::validRange, since the range returned by this function may have size zero (e.g. when there is only one data point). In this case foundRange would return true, but the returned range is not a valid range in terms of QCPRange::validRange.
- See also
- rescaleAxes, getKeyRange
Implements QCPAbstractPlottable.
§ draw()
|
protectedvirtual |
This function draws the layerable with the specified painter. It is only called by QCustomPlot, if the layerable is visible (setVisible).
Before this function is called, the painter's antialiasing state is set via applyDefaultAntialiasingHint, see the documentation there. Further, the clipping rectangle was set to clipRect.
Implements QCPAbstractPlottable.
§ drawLegendIcon()
|
protectedvirtual |
called by QCPLegend::draw (via QCPPlottableLegendItem::draw) to create a graphical representation of this plottable inside rect, next to the plottable name.
The passed painter has its cliprect set to rect, so painting outside of rect won't appear outside the legend icon border.
Implements QCPAbstractPlottable.
§ drawStatisticalBox()
|
protectedvirtual |
Draws the graphical representation of a single statistical box with the data given by the iterator it with the provided painter.
If the statistical box has a set of outlier data points, they are drawn with outlierStyle.
§ getVisibleDataBounds()
|
protected |
called by draw to determine which data (key) range is visible at the current key axis range setting, so only that needs to be processed. It also takes into account the bar width.
begin returns an iterator to the lowest data point that needs to be taken into account when plotting. Note that in order to get a clean plot all the way to the edge of the axis rect, lower may still be just outside the visible range.
end returns an iterator one higher than the highest visible data point. Same as before, end may also lie just outside of the visible range.
if the plottable contains no data, both begin and end point to constEnd.
§ getQuartileBox()
|
protected |
Returns the box in plot coordinates (keys in x, values in y of the returned rect) that covers the value range from the lower to the upper quartile, of the data given by it.
§ getWhiskerBackboneLines()
|
protected |
Returns the whisker backbones (keys in x, values in y of the returned lines) that cover the value range from the minimum to the lower quartile, and from the upper quartile to the maximum of the data given by it.
§ getWhiskerBarLines()
|
protected |
Returns the whisker bars (keys in x, values in y of the returned lines) that are placed at the end of the whisker backbones, at the minimum and maximum of the data given by it.
The documentation for this class was generated from the following files:
- src/plottables/plottable-statisticalbox.h
- src/plottables/plottable-statisticalbox.cpp