Aggplot types
Python source code: [download source: aggplot-collisions-1]
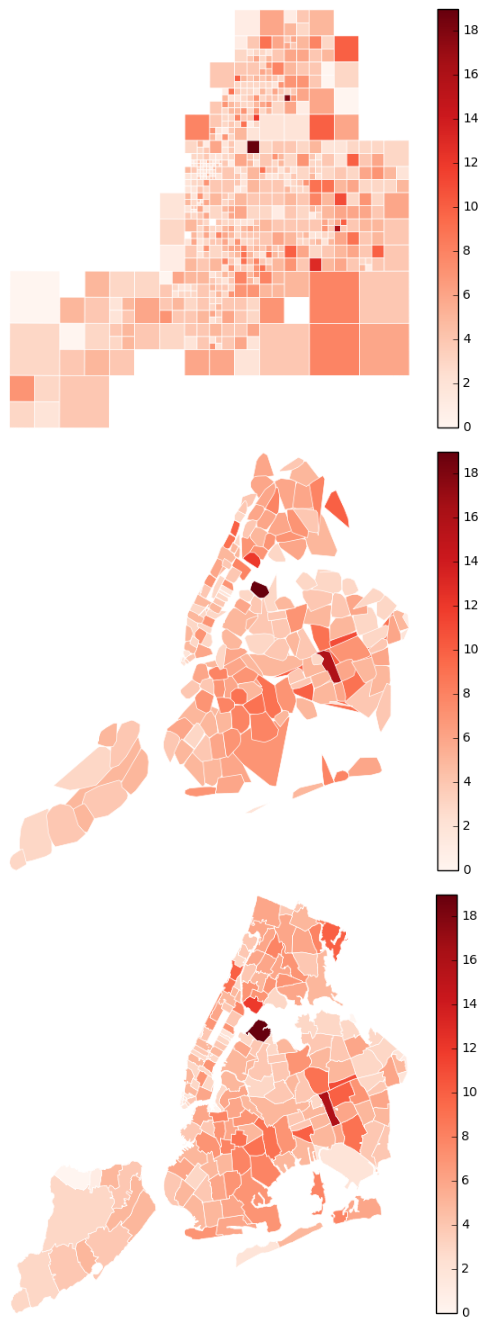
# This example demonstrates how to use the `aggplot` function, using part of a NYC traffic collisions dataset.
#
# In the first plot we have a bunch of point data, but don't provide any geometry about the locations. So `aggplot`
# invents its own, partitioning the sample space into increasingly fine squares (known as a "quadtree"). Each of the
# squares has between approximately `nmin` and `nmax` samples inside, and the `agg` statistic (`np.avg` by default; `np
# .max` here) is applied to each square.
#
# It is relatively common for datasets to contain a field describing the "neighborhood" a particular observation is in.
# In that case you can use the `by` parameter to summarize by neighborhood (`ZIP CODE` in this example). The result is
# an aggregation using convex hulls: still not pretty, but functional.
#
# Finally there is the case that we have full geospatial context. In that case pass the geometry to the `geometry`
# field; `aggplot` will handle aggregating the result and generate a nicely packaged choropleth!

# Load the data (uses the `quilt` package).
from quilt.data.ResidentMario import nyc_collisions
import shapely
import geopandas as gpd
import pandas as pd

collisions = nyc_collisions.collisions()

def pointify(srs):
    try:
        lat, long = float(srs['LATITUDE']), float(srs['LONGITUDE'])
        if pd.isnull(lat) or pd.isnull(long):
            return shapely.geometry.Point((0, 0))
        else:
            return shapely.geometry.Point((long, lat))
    except ValueError:
        return shapely.geometry.Point((0, 0))

collisions = gpd.GeoDataFrame(collisions.head(5000), geometry=collisions.head(5000).apply(pointify, axis='columns'))
collisions = collisions[collisions.geometry.map(lambda srs: not (srs.x == 0))]
collisions['BOROUGH'] = collisions['BOROUGH'].str.strip().map(lambda v: np.nan if len(v) == 0 else v)


# Plot the data.
import geoplot as gplt
import geoplot.crs as gcrs
import numpy as np
import matplotlib.pyplot as plt

f, axarr = plt.subplots(3, 1, figsize=(12, 12), subplot_kw={
    'projection': gcrs.AlbersEqualArea(central_latitude=40.7128, central_longitude=-74.0059)
})
plt.suptitle('Max(Injuries) in Collision by Area, 2016', fontsize=16)
plt.subplots_adjust(top=0.95)


ax1 = gplt.aggplot(collisions, projection=gcrs.AlbersEqualArea(),
                   hue='NUMBER OF PERSONS INJURED', agg=np.max, cmap='Reds',
                   nmin=100, nmax=500,
                   linewidth=0.5, edgecolor='white',
                   ax=axarr[0])
ax1.set_title("No Geometry (Quadtree)")


ax2 = gplt.aggplot(collisions, projection=gcrs.AlbersEqualArea(),
                   hue='NUMBER OF PERSONS INJURED', agg=np.max, cmap='Reds', by='ZIP CODE',
                   linewidth=0.5, edgecolor='white',
                   ax=axarr[1])
ax2.set_title("Categorical Geometry (Convex Hull)")


zip_codes = gplt.datasets.load('nyc-zip-codes')
ax3 = gplt.aggplot(collisions, projection=gcrs.AlbersEqualArea(),
                   hue='NUMBER OF PERSONS INJURED', agg=np.max, by='ZIP CODE', geometry=zip_codes.geometry,
                   cmap='Reds', linewidth=0.5, edgecolor='white',
                   ax=axarr[2])
ax3.set_title("Geometry Provided (Choropleth)")


plt.savefig("aggplot-collisions-1.png", bbox_inches='tight', pad_inches=0.1)