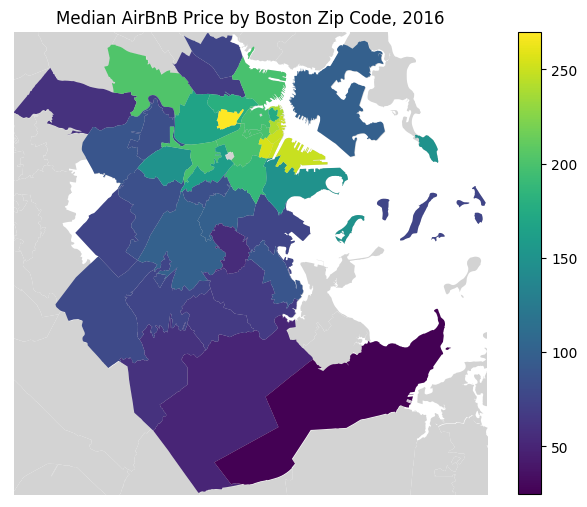
Aggplot singular

Python source code: [download source: boston-airbnb-aggplot]
# Load the data (uses the `quilt` package).
from quilt.data.ResidentMario import geoplot_data
import geopandas as gpd

boston_zip_codes = gpd.read_file(geoplot_data.boston_zip_codes())
boston_zip_codes = boston_zip_codes.assign(id=boston_zip_codes.id.astype(float)).set_index('id')

listings = gpd.read_file(geoplot_data.boston_airbnb_listings())
listings = listings.assign(zipcode=listings.zipcode.astype(float))


# Plot the data.
import geoplot as gplt
import geoplot.crs as gcrs
import numpy as np
import matplotlib.pyplot as plt

ax = gplt.polyplot(boston_zip_codes.geometry, projection=gcrs.AlbersEqualArea(),
                   facecolor='lightgray', edgecolor='gray', linewidth=0)

gplt.aggplot(listings, projection=gcrs.AlbersEqualArea(), hue='price',
             by='zipcode', geometry=boston_zip_codes.geometry, agg=np.median, ax=ax,
             linewidth=0)


ax.set_title("Median AirBnB Price by Boston Zip Code, 2016")
plt.savefig("boston-airbnb-aggplot.png", bbox_inches='tight', pad_inches=0.1)