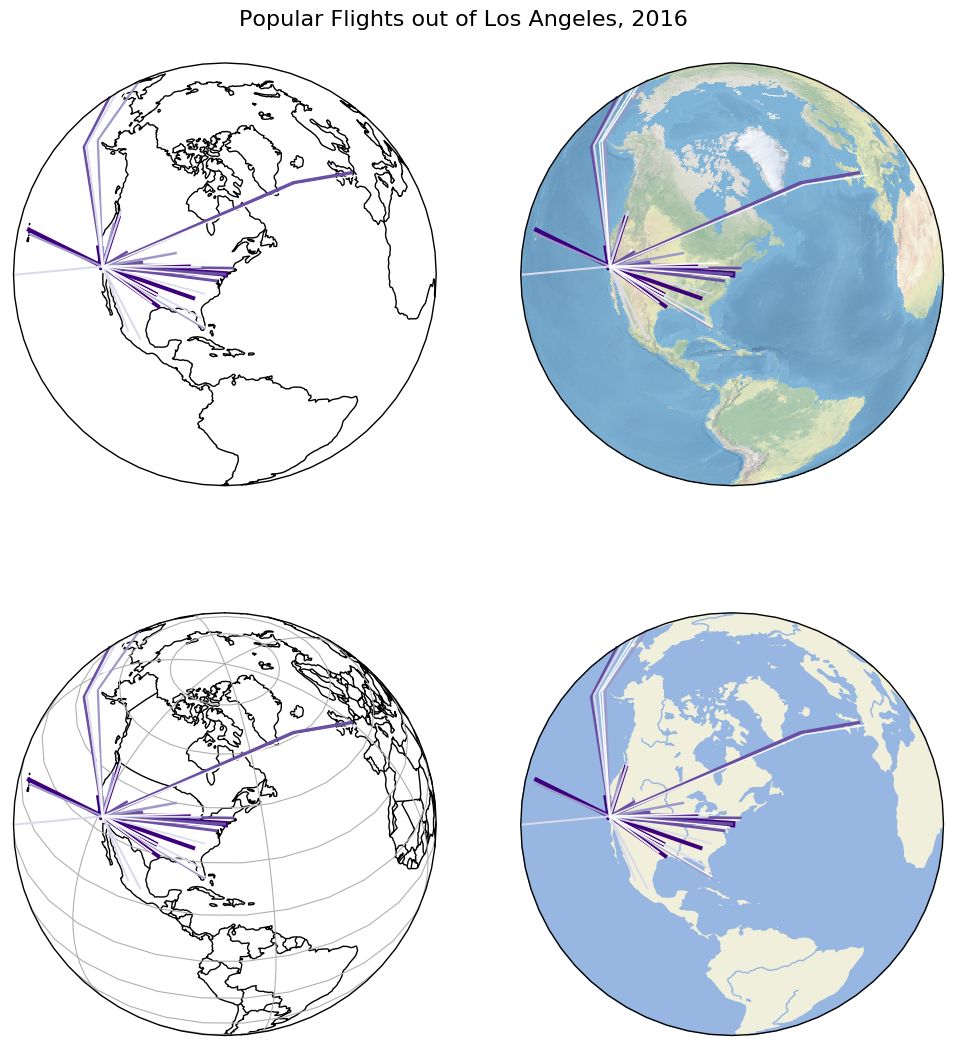
Sankey demo of Cartopy globe options
Python source code: [download source: los-angeles-flights.py]
# This script demonstrates using the cartopy feature interface alongside geoplot.
# For more information visit http://scitools.org.uk/cartopy/docs/latest/matplotlib/feature_interface.html.


# Load the data (uses the `quilt` package).
import geopandas as gpd
from quilt.data.ResidentMario import geoplot_data

la_flights = gpd.read_file(geoplot_data.la_flights())
la_flights = la_flights.assign(
    start=la_flights.geometry.map(lambda mp: mp[0]),
    end=la_flights.geometry.map(lambda mp: mp[1])
)


# Plot the data.
import geoplot as gplt
import geoplot.crs as gcrs
import matplotlib.pyplot as plt
import cartopy

f, axarr = plt.subplots(2, 2, figsize=(12, 12), subplot_kw={
    'projection': gcrs.Orthographic(central_latitude=40.7128, central_longitude=-74.0059)
})
plt.suptitle('Popular Flights out of Los Angeles, 2016', fontsize=16)
plt.subplots_adjust(top=0.95)

ax = gplt.sankey(la_flights, start='start', end='end',
                 projection=gcrs.Orthographic(), scale='Passengers', hue='Passengers', cmap='Purples', ax=axarr[0][0])
ax.set_global()
ax.outline_patch.set_visible(True)
ax.coastlines()

ax = gplt.sankey(la_flights, start='start', end='end',
                 projection=gcrs.Orthographic(), scale='Passengers', hue='Passengers', cmap='Purples', ax=axarr[0][1])
ax.set_global()
ax.outline_patch.set_visible(True)
ax.stock_img()

ax = gplt.sankey(la_flights, start='start', end='end',
                 projection=gcrs.Orthographic(), scale='Passengers', hue='Passengers', cmap='Purples', ax=axarr[1][0])
ax.set_global()
ax.outline_patch.set_visible(True)
ax.gridlines()
ax.coastlines()
ax.add_feature(cartopy.feature.BORDERS)

ax = gplt.sankey(la_flights, start='start', end='end',
                 projection=gcrs.Orthographic(), scale='Passengers', hue='Passengers', cmap='Purples', ax=axarr[1][1])
ax.set_global()
ax.outline_patch.set_visible(True)
ax.coastlines()
ax.add_feature(cartopy.feature.LAND)
ax.add_feature(cartopy.feature.OCEAN)
ax.add_feature(cartopy.feature.LAKES)
ax.add_feature(cartopy.feature.RIVERS)

plt.savefig("los-angeles-flights.png", bbox_inches='tight', pad_inches=0.1)