Clipped heatmaps
Python source code: [download source: nyc-collision-factors.py]
# Load the data (uses the `quilt` package).
import geopandas as gpd
from quilt.data.ResidentMario import geoplot_data
boroughs = gpd.read_file(geoplot_data.nyc_boroughs())
collisions = gpd.read_file(geoplot_data.nyc_collision_factors())
# Plot the data.
import geoplot.crs as gcrs
import geoplot as gplt
import matplotlib.pyplot as plt
fig = plt.figure(figsize=(10,5))
ax1 = plt.subplot(121, projection=gcrs.AlbersEqualArea(central_latitude=40.7128, central_longitude=-74.0059))
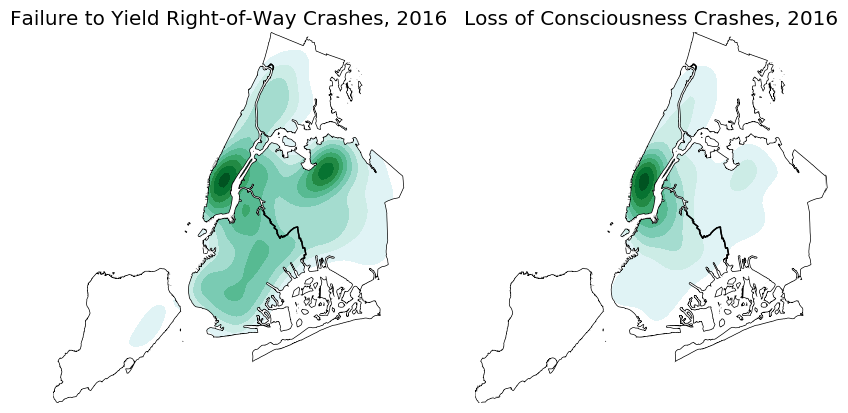
gplt.kdeplot(collisions[collisions["CONTRIBUTING FACTOR VEHICLE 1"] == 'Failure to Yield Right-of-Way'],
projection=gcrs.AlbersEqualArea(), shade=True, clip=boroughs.geometry, shade_lowest=False, ax=ax1)
gplt.polyplot(boroughs, projection=gcrs.AlbersEqualArea(), ax=ax1)
plt.title("Failure to Yield Right-of-Way Crashes, 2016")
ax2 = plt.subplot(122, projection=gcrs.AlbersEqualArea(central_latitude=40.7128, central_longitude=-74.0059))
gplt.kdeplot(collisions[collisions["CONTRIBUTING FACTOR VEHICLE 1"] == 'Lost Consciousness'],
projection=gcrs.AlbersEqualArea(), shade=True, clip=boroughs.geometry, shade_lowest=False, ax=ax2)
gplt.polyplot(boroughs, projection=gcrs.AlbersEqualArea(), ax=ax2)
plt.title("Loss of Consciousness Crashes, 2016")
plt.savefig("nyc-collision-factors.png", bbox_inches='tight', pad_inches=0.1)