Layered subplots
Python source code: [download source: nyc-collisions-map.py]
# Load the data (uses the `quilt` package).
import geopandas as gpd
from quilt.data.ResidentMario import geoplot_data
boroughs = gpd.read_file(geoplot_data.nyc_boroughs())
fatal_collisions = gpd.read_file(geoplot_data.nyc_fatal_collisions())
injurious_collisions = gpd.read_file(geoplot_data.nyc_injurious_collisions())
# Plot the data.
import geoplot as gplt
import geoplot.crs as gcrs
import matplotlib.pyplot as plt
fig = plt.figure(figsize=(10,5))
ax1 = plt.subplot(121, projection=gcrs.AlbersEqualArea(central_latitude=40.7128, central_longitude=-74.0059))
gplt.polyplot(boroughs, ax=ax1, projection=gcrs.AlbersEqualArea())
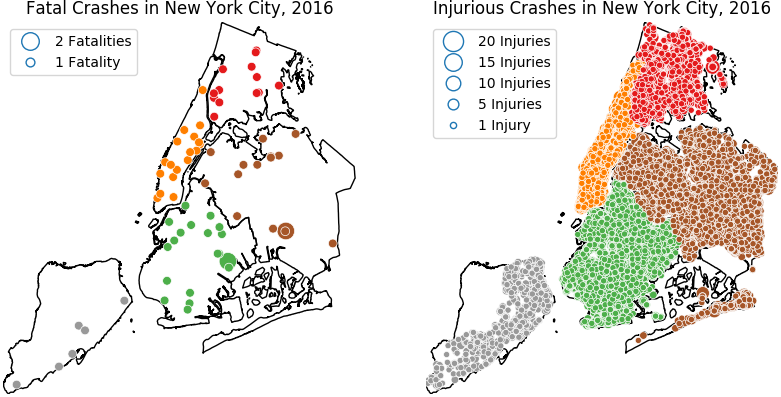
gplt.pointplot(fatal_collisions, projection=gcrs.AlbersEqualArea(),
hue='BOROUGH', categorical=True,
edgecolor='white', linewidth=0.5, zorder=10,
scale='NUMBER OF PERSONS KILLED', limits=(2, 8),
legend=True, legend_var='scale', legend_kwargs={'loc': 'upper left'},
legend_values=[2, 1], legend_labels=['2 Fatalities', '1 Fatality'],
ax=ax1)
plt.title("Fatal Crashes in New York City, 2016")
ax2 = plt.subplot(122, projection=gcrs.AlbersEqualArea(central_latitude=40.7128, central_longitude=-74.0059))
gplt.polyplot(boroughs, ax=ax2, projection=gcrs.AlbersEqualArea())
gplt.pointplot(injurious_collisions, projection=gcrs.AlbersEqualArea(),
hue='BOROUGH', categorical=True,
edgecolor='white', linewidth=0.5, zorder=10,
scale='NUMBER OF PERSONS INJURED', limits=(1, 10),
legend=True, legend_var='scale', legend_kwargs={'loc': 'upper left'},
legend_values=[20, 15, 10, 5, 1],
legend_labels=['20 Injuries', '15 Injuries', '10 Injuries', '5 Injuries', '1 Injury'],
ax=ax2)
plt.title("Injurious Crashes in New York City, 2016")
plt.savefig("nyc-collisions-map.png", bbox_inches='tight', pad_inches=0)