Choropleth subplots
Python source code: [download source: nyc-parking-tickets.py]
# Load the data (uses the `quilt` package).
import geopandas as gpd
from quilt.data.ResidentMario import geoplot_data
boroughs = gpd.read_file(geoplot_data.nyc_boroughs())
precincts = gpd.read_file(geoplot_data.nyc_police_precincts())
tickets = gpd.read_file(geoplot_data.nyc_parking_tickets_sample())
# This example inspired by:
# http://iquantny.tumblr.com/post/84393789169/californians-love-brooklyn-new-jerseyans-love
# Plot the data.
import geoplot as gplt
import geoplot.crs as gcrs
import matplotlib.pyplot as plt
def plot_state_to_ax(state, ax):
"""Reusable plotting wrapper."""
gplt.choropleth(tickets.set_index('id').loc[:, [state, 'geometry']],
hue=state,
projection=gcrs.AlbersEqualArea(), cmap='Blues',
linewidth=0.0, ax=ax)
gplt.polyplot(boroughs, projection=gcrs.AlbersEqualArea(), edgecolor='black', linewidth=0.5, ax=ax)
# Finally, plot the data.
f, axarr = plt.subplots(2, 2, figsize=(12, 12), subplot_kw={
'projection': gcrs.AlbersEqualArea(central_latitude=40.7128, central_longitude=-74.0059)
})
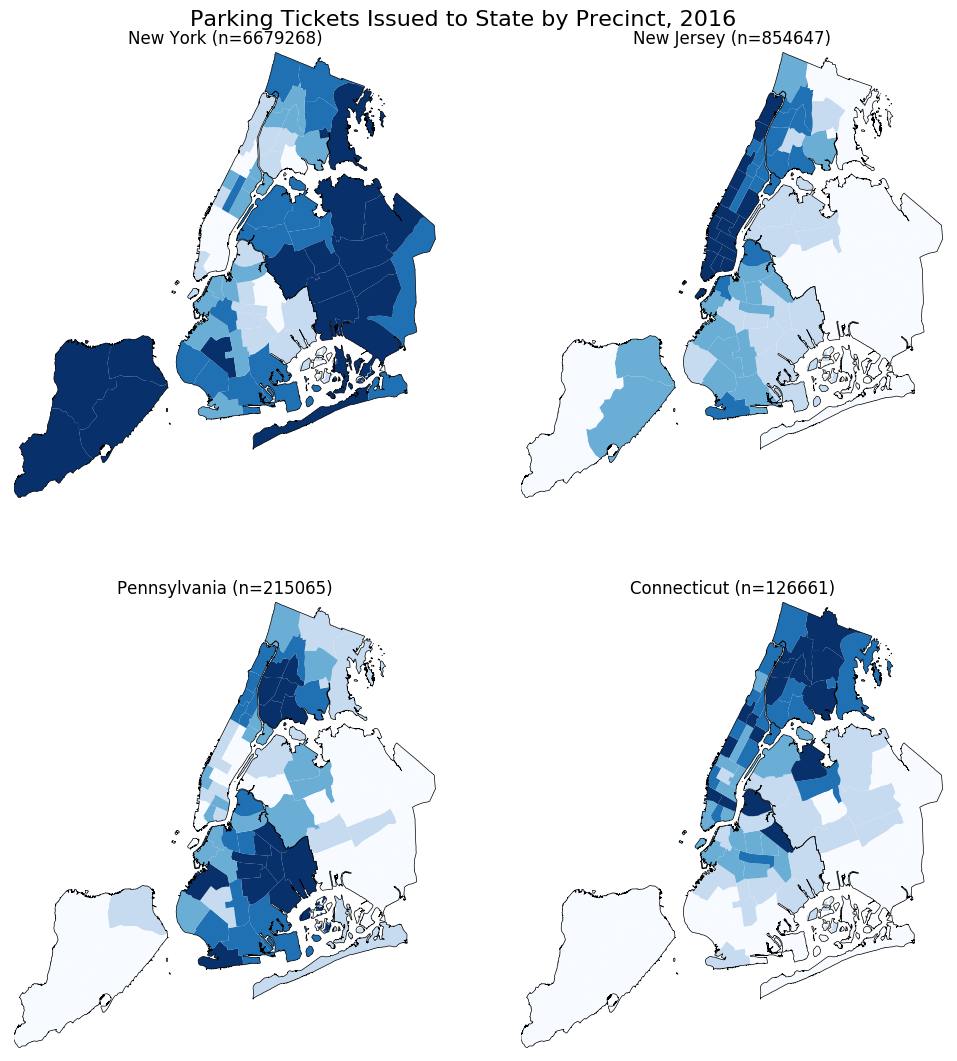
plt.suptitle('Parking Tickets Issued to State by Precinct, 2016', fontsize=16)
plt.subplots_adjust(top=0.95)
plot_state_to_ax('ny', axarr[0][0])
axarr[0][0].set_title('New York (n=6679268)')
plot_state_to_ax('nj', axarr[0][1])
axarr[0][1].set_title('New Jersey (n=854647)')
plot_state_to_ax('pa', axarr[1][0])
axarr[1][0].set_title('Pennsylvania (n=215065)')
plot_state_to_ax('ct', axarr[1][1])
axarr[1][1].set_title('Connecticut (n=126661)')
plt.savefig("nyc-parking-tickets.png", bbox_inches='tight')