# Capture
[Overview](../README.md) . [Inspect](inspect.md) . [Record](record.md)
* [Introduction](#introduction)
* [Capturing Frame Data](#capturing-frame-data)
* [Saving and Loading Captures](#saving-and-loading-captures)
* [Reopening a Capture in a New Tab or Window](#reopening-a-capture-in-a-new-tab-or-window)
* [Frame Commands](#frame-commands)
* [Render Pass Textures](#render-pass-textures)
* [Command Stacktrace](#command-stacktrace)
* [Command Inspection](#command-inspection)
* [Uniform and Storage Buffer Inspection](#uniform-and-storage-buffer-inspection)
* [Formatting Buffer Data](formatting_buffer_data.md)
* [Vertex Buffer Data](#vertex-buffer-data)
* [Pixel History](#pixel-history)
* [Debug Groups](#debug-groups)
* [Frame Stats](#frame-stats)
* [Shader Debugger](#shader-debugger)
## Introduction
###### [Back to top](#capture)
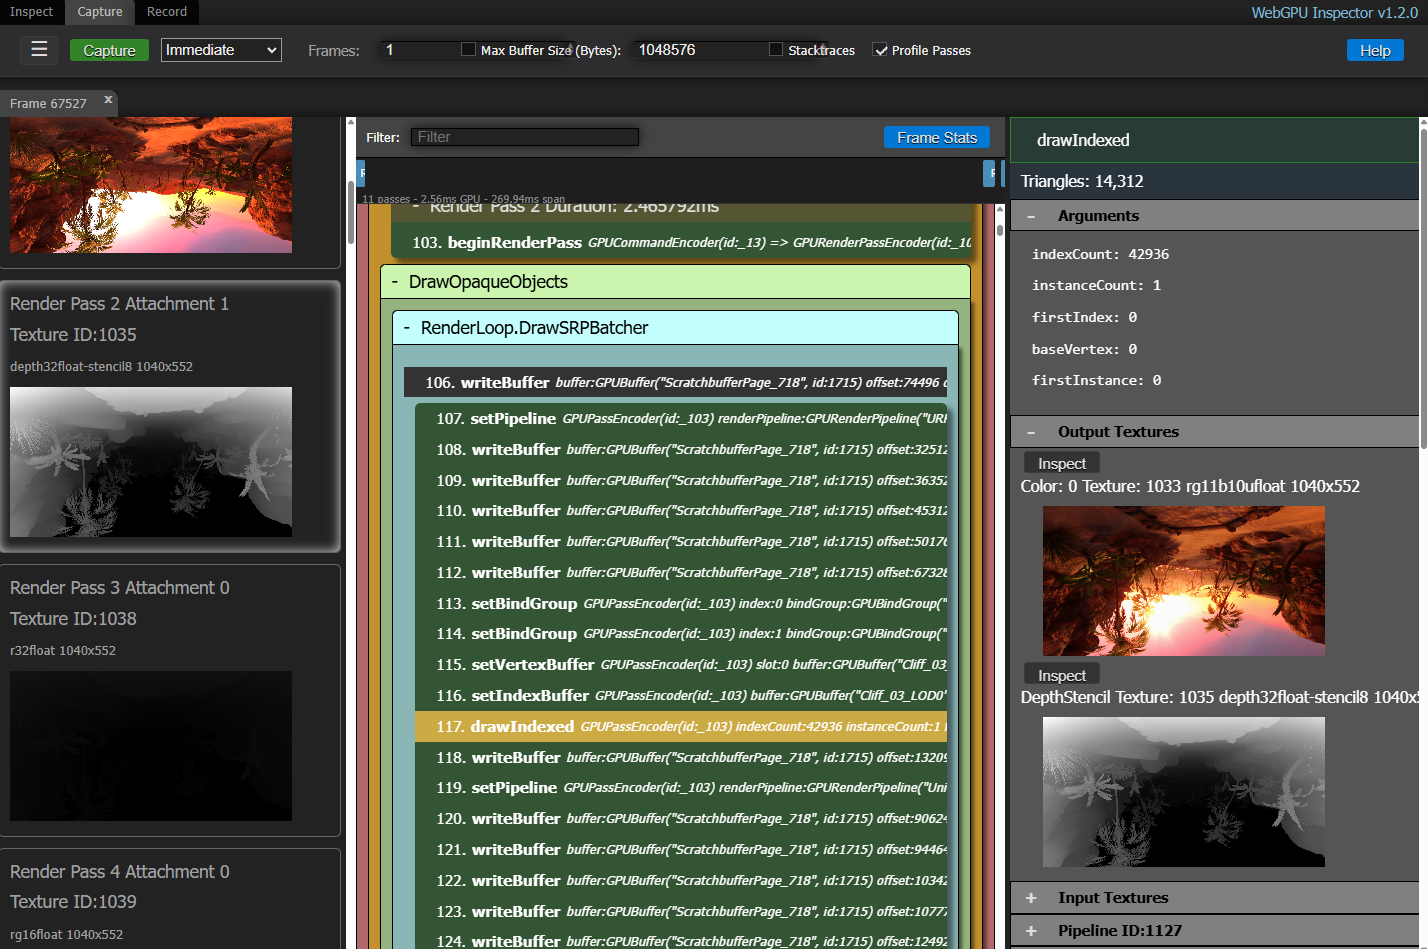
Capture all rendering commands used to render a frame, letting you inspect each command, as well as providing information about the rendering state at each command. It also captures the image results of each render pass.
 ## Capturing Frame Data
###### [Back to top](#capture)
Press the **Capture** button to capture a frame from the page.
### Capture Mode
Capture has two modes: **Immediate** and **Specific Frame**.
#### Immediate Capture

Immediate capture will record the current frame on the page.
**Frames** indicates how many frames to capture.
#### Specific Frame Capture

Specific frame capture will record a specific frame from the load of the page. Using this capture mode will cause the page to refresh, and start recording at the indicated frame.
A start frame of **0** will record all commands from the start of the page load, including those outside of a requestAnimationFrame frame. This allows you to capture commands for pages that do not use requestAnimationFrame.
**Frames** indicates how many frames to capture once it has started recording.
For pages that do not use requestAnimationFrame, the Frames value does not do anything. In that case, recording will continue until the GPU device has been destroyed or garbage collected, or you press the inspector overlay on the page to stop the recording.
#### Max Buffer Size
The **Max Buffer Size** value specifies the maximum buffer size Capture will record, for Uniform and Storage buffers. Sending buffer data to the DevTools panel can be slow, so limiting the buffer size can help capture performance. Large buffers are typically used for storage buffers.
#### Stacktraces
The **Stacktraces** checkbox controls whether a stacktrace is recorded for each captured command. It is **off by default**, because recording a stacktrace per command can significantly increase the size of a capture for frames with many commands. Enable it when you need to know where in the page's code a command was issued. See [Command Stacktrace](#command-stacktrace).
#### Profile Passes
The **Profile Passes** checkbox injects GPU timestamp queries around each render and compute pass so the capture can report per-pass GPU duration. It is **on by default**.
This requires the page's adapter to support the `timestamp-query` feature. If the adapter doesn't grant it, the injection is silently skipped and no timing data is produced.
When timing data is available, it is presented in several places:
* A **GPU pass timeline** at the top of the frame's command list, showing each render/compute pass as a bar sized to the fraction of the frame it took. A dashed **frame-budget marker** shows where the display refresh interval falls, so you can see how much of the budget the GPU work fills — passes crossing the marker mean the GPU can't keep up with the refresh rate.
* Each pass header in the command list is annotated with its `Duration:ms`.
* The [Frame Stats](#frame-stats) panel includes a **Frame Bound** card and a **Pass Timings** breakdown.
The **Frame Bound** card estimates whether the frame is **CPU-**, **GPU-**, or **vsync-bound** by comparing the main-thread submit time and the total GPU time against the frame budget (the display refresh interval), with bars showing each against the budget. The CPU submit time and frame budget come from the live page's frame metrics, so the verdict is most meaningful for captures taken from a running page; GPU time comes from the pass timestamps.
Because the timing data travels with the capture, the timeline, pass timings, and Frame Bound card also appear for [saved/loaded](#saving-and-loading-captures) captures.
#### Note
Frame capture works best when requestAnimationFrame is used, as Capture uses that to identify what commands to capture for a frame. Immediate capture will not work without requestAnimationFrame. In that case, use **Specific Frame** capture with frame 0, to start recording after page load.
## Saving and Loading Captures
###### [Back to top](#capture)
Captures can be saved to disk as a file and re-opened later in the panel. This is useful for sharing a frame capture in bug reports, comparing captures from different builds, or returning to a capture after closing the DevTools.
The Save / Load actions live in the hamburger (**☰**) menu on the left side of the Capture panel's toolbar, next to the **Capture** button.
### Save Capture
**Save Capture** is enabled whenever a capture tab is active. Selecting it downloads the active tab as a `webgpu_capture_frame_.wgpuc` file, where `` is the captured frame index.
The file is a binary container: an ASCII `WGPUCAP` header line and the capture metadata as JSON (both readable if you open the file in a text editor), followed by the raw buffer/texture payload bytes. Storing the payloads as raw binary instead of base64-encoded JSON keeps files ~25% smaller and lets even very large captures save without memory pressure. The file contains everything the panel needs to fully reconstruct the capture:
* The full GPU object graph (adapters, devices, buffers, textures, texture views, samplers, bind groups, bind group layouts, pipeline layouts, render and compute pipelines, render bundles, shader modules) with their descriptors and stacktraces.
* The recorded command list for the frame, with arguments, results, and captured stacktraces.
* The image data for each render pass color/depth attachment that was read back during capture, stored as per-mip payload data on the corresponding Texture record.
* The buffer data captured for `setVertexBuffer`, `setIndexBuffer`, indirect draws/dispatches, and any Uniform / Storage buffer bound for inspection, attached to the command record it belongs to.
* Validation errors raised during the capture.
The file is self-contained, so once saved it can be shared and opened on any machine without needing the original page.
### Load Capture
**Load Capture** opens a file picker; selecting a previously-saved capture file opens it as a new tab in the Capture panel alongside any live or already-loaded captures. Both the binary `.wgpuc` format and the older JSON / NDJSON capture files are accepted. The loaded tab supports all of the same inspection features (command list, render pass thumbnails, BindGroup / vertex buffer / pipeline inspection, frame stats), driven entirely off the data in the file.
Imported textures with serialized image data are uploaded back onto the inspector's WebGPU device when the tab is built, so render-pass thumbnails and BindGroup texture previews render the same way they did in the original live capture. Textures that didn't have image data captured (e.g. resources that weren't bound or written to as an attachment) show their descriptor without a preview.
Each imported capture lives in its own ID namespace, so loading multiple captures (or loading a capture while a live capture is also open) won't cause object ID collisions between them.
### Capturing Outside DevTools
The same capture format can also be produced *without* the DevTools panel by loading `webgpu_inspector.js` directly via a `
## Capturing Frame Data
###### [Back to top](#capture)
Press the **Capture** button to capture a frame from the page.
### Capture Mode
Capture has two modes: **Immediate** and **Specific Frame**.
#### Immediate Capture

Immediate capture will record the current frame on the page.
**Frames** indicates how many frames to capture.
#### Specific Frame Capture

Specific frame capture will record a specific frame from the load of the page. Using this capture mode will cause the page to refresh, and start recording at the indicated frame.
A start frame of **0** will record all commands from the start of the page load, including those outside of a requestAnimationFrame frame. This allows you to capture commands for pages that do not use requestAnimationFrame.
**Frames** indicates how many frames to capture once it has started recording.
For pages that do not use requestAnimationFrame, the Frames value does not do anything. In that case, recording will continue until the GPU device has been destroyed or garbage collected, or you press the inspector overlay on the page to stop the recording.
#### Max Buffer Size
The **Max Buffer Size** value specifies the maximum buffer size Capture will record, for Uniform and Storage buffers. Sending buffer data to the DevTools panel can be slow, so limiting the buffer size can help capture performance. Large buffers are typically used for storage buffers.
#### Stacktraces
The **Stacktraces** checkbox controls whether a stacktrace is recorded for each captured command. It is **off by default**, because recording a stacktrace per command can significantly increase the size of a capture for frames with many commands. Enable it when you need to know where in the page's code a command was issued. See [Command Stacktrace](#command-stacktrace).
#### Profile Passes
The **Profile Passes** checkbox injects GPU timestamp queries around each render and compute pass so the capture can report per-pass GPU duration. It is **on by default**.
This requires the page's adapter to support the `timestamp-query` feature. If the adapter doesn't grant it, the injection is silently skipped and no timing data is produced.
When timing data is available, it is presented in several places:
* A **GPU pass timeline** at the top of the frame's command list, showing each render/compute pass as a bar sized to the fraction of the frame it took. A dashed **frame-budget marker** shows where the display refresh interval falls, so you can see how much of the budget the GPU work fills — passes crossing the marker mean the GPU can't keep up with the refresh rate.
* Each pass header in the command list is annotated with its `Duration:ms`.
* The [Frame Stats](#frame-stats) panel includes a **Frame Bound** card and a **Pass Timings** breakdown.
The **Frame Bound** card estimates whether the frame is **CPU-**, **GPU-**, or **vsync-bound** by comparing the main-thread submit time and the total GPU time against the frame budget (the display refresh interval), with bars showing each against the budget. The CPU submit time and frame budget come from the live page's frame metrics, so the verdict is most meaningful for captures taken from a running page; GPU time comes from the pass timestamps.
Because the timing data travels with the capture, the timeline, pass timings, and Frame Bound card also appear for [saved/loaded](#saving-and-loading-captures) captures.
#### Note
Frame capture works best when requestAnimationFrame is used, as Capture uses that to identify what commands to capture for a frame. Immediate capture will not work without requestAnimationFrame. In that case, use **Specific Frame** capture with frame 0, to start recording after page load.
## Saving and Loading Captures
###### [Back to top](#capture)
Captures can be saved to disk as a file and re-opened later in the panel. This is useful for sharing a frame capture in bug reports, comparing captures from different builds, or returning to a capture after closing the DevTools.
The Save / Load actions live in the hamburger (**☰**) menu on the left side of the Capture panel's toolbar, next to the **Capture** button.
### Save Capture
**Save Capture** is enabled whenever a capture tab is active. Selecting it downloads the active tab as a `webgpu_capture_frame_.wgpuc` file, where `` is the captured frame index.
The file is a binary container: an ASCII `WGPUCAP` header line and the capture metadata as JSON (both readable if you open the file in a text editor), followed by the raw buffer/texture payload bytes. Storing the payloads as raw binary instead of base64-encoded JSON keeps files ~25% smaller and lets even very large captures save without memory pressure. The file contains everything the panel needs to fully reconstruct the capture:
* The full GPU object graph (adapters, devices, buffers, textures, texture views, samplers, bind groups, bind group layouts, pipeline layouts, render and compute pipelines, render bundles, shader modules) with their descriptors and stacktraces.
* The recorded command list for the frame, with arguments, results, and captured stacktraces.
* The image data for each render pass color/depth attachment that was read back during capture, stored as per-mip payload data on the corresponding Texture record.
* The buffer data captured for `setVertexBuffer`, `setIndexBuffer`, indirect draws/dispatches, and any Uniform / Storage buffer bound for inspection, attached to the command record it belongs to.
* Validation errors raised during the capture.
The file is self-contained, so once saved it can be shared and opened on any machine without needing the original page.
### Load Capture
**Load Capture** opens a file picker; selecting a previously-saved capture file opens it as a new tab in the Capture panel alongside any live or already-loaded captures. Both the binary `.wgpuc` format and the older JSON / NDJSON capture files are accepted. The loaded tab supports all of the same inspection features (command list, render pass thumbnails, BindGroup / vertex buffer / pipeline inspection, frame stats), driven entirely off the data in the file.
Imported textures with serialized image data are uploaded back onto the inspector's WebGPU device when the tab is built, so render-pass thumbnails and BindGroup texture previews render the same way they did in the original live capture. Textures that didn't have image data captured (e.g. resources that weren't bound or written to as an attachment) show their descriptor without a preview.
Each imported capture lives in its own ID namespace, so loading multiple captures (or loading a capture while a live capture is also open) won't cause object ID collisions between them.
### Capturing Outside DevTools
The same capture format can also be produced *without* the DevTools panel by loading `webgpu_inspector.js` directly via a `