Homework 08: Collecting and analyzing data from the web
Overview
Due before class Monday November 20.
We learned three ways of collecting data from the internet:
- Accessing data using packages that wrap APIs
- Running (basic) API queries “by hand”
- Web scraping
For the homework, you will
- Combine two existing datasets in a novel (and reproducible!) way
- Create a new dataset by writing your own API interface or web scraping
Fork the hw08 repository
Go here to fork the repo for homework 08.
Part 1: Exploring the gapminder data (even more)
We’ve examined the gapminder data quite a bit. One relationship we’ve looked at (or are about to) is the relationship between population and life expectancy.
library(tidyverse)
library(gapminder)

gapminder %>%
  # convert to population in millions
  mutate(pop = pop / 1000000) %>%
  ggplot(aes(pop, lifeExp)) +
  geom_point(alpha = .2) +
  geom_smooth() +
  scale_x_log10() +
  labs(title = "As population increases, life expectancy increases",
       x = "Population (in millions)",
       y = "Average life expectancy")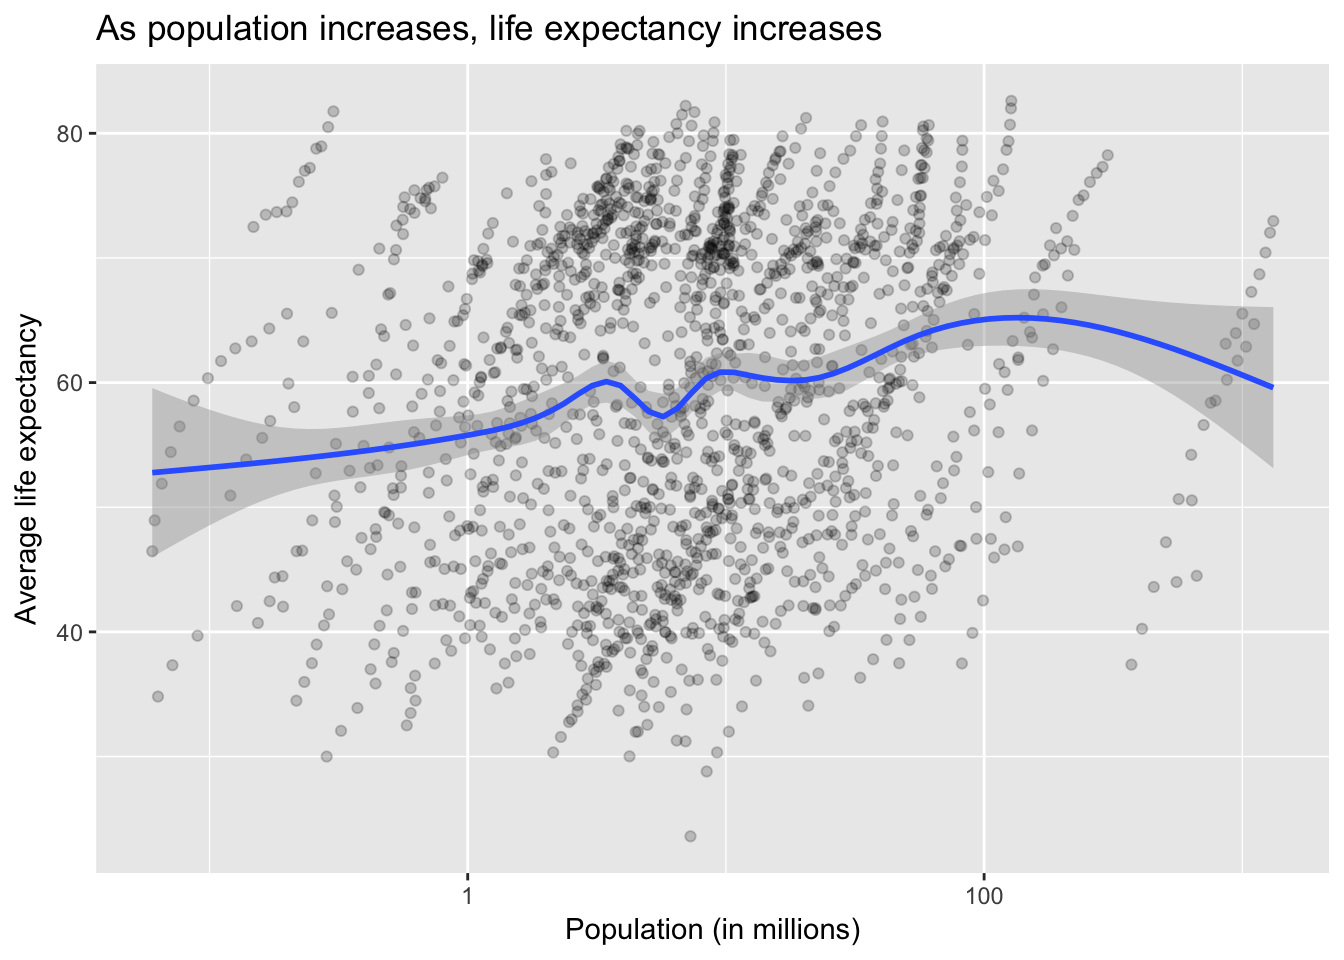
For the assignment, I want you to replace population with population density and evaluate its relationship with average life expectancy. To do this:
- Get the country information using geonames - remember there is a R package for this (see the lecture notes)
- Merge
gapminderand the country information fromgeonames- Use
left_joinfromdplyrto merge the tables - Note that you cannot directly do this -
gapminderwrites the name of countries differently fromgeonames. To complete the merge, you need a unique key to match observations between the data frames - There is neat little package for R called
countrycodethat helps solve this problem.countrycode()takes as an input a country’s name in a specific format and outputs it using whatever format you specify.gapminderstores them using thecountry.nameformatgeonamesstores them under thecountryCodecolumn using theiso2cformat- I leave it to you to make the joining operation work
- Use
- Calculate the population density for each observation
- Produce an updated graph using population density
- If you want to be real fancy, estimate a statistical model or compare the relationship across continents
Part 2: More complicated data collection
For the second part of the assignment, I want you to create a new dataset and analyze it. You can do so using any of the following methods:
- Install and play
- Write an API query function
- Scrape a website
If you go either of the last two routes, you need to write your own code or function to query the server and obtain the results. If you decide to skip the API entirely, you will need to use rvest to scrape the content of a web page and extract the relevant information.
If you use the install and play option, I expect immaculate and thorough analysis since you are choosing a much easier method to obtain your data. Consider yourself warned.
The end result must be a tidy data frame stored in the repository with some analytical component. This can be exploratory description and visualization or some method of statistical learning. I should be able to run your code and reproduce your data and analysis.1 2
Submit the assignment
Your assignment should be submitted as a set of R scripts, R Markdown documents, data files, etc. Whatever is necessary to show your code and present your results. Follow instructions on homework workflow. As part of the pull request, you’re encouraged to reflect on what was hard/easy, problems you solved, helpful tutorials you read, etc.
Rubric
Check minus: Cannot get code to run. Fail to accurately create the population density variable. Generated data set is not tidy. No documentation explaining how to use your API function or web scraping script.
Check: Solid effort. Hits all the elements. No clear mistakes. Easy to follow (both the code and the output). Nothing spectacular, either bad or good.
Check plus: Estimate a statistical model for the gapminder question, or do something beyond producing a graph. Implement an advanced statistical learning model or extensive exploratory analysis. Write an API function that uses authentication.
Acknowledgments
- This page is derived in part from “UBC STAT 545A and 547M”, licensed under the CC BY-NC 3.0 Creative Commons License.
Obviously if you are scraping from a web page that frequently updates its content, I may not perfectly reproduce your results. That’s fine - just make sure you’ve saved a copy of the data frame in the repo.↩
Also if you write your own API function for a site that requires authentication, make sure to include instructions about where to store my API key so I can run your code without sharing your private key.↩
This work is licensed under the CC BY-NC 4.0 Creative Commons License.