Strata at axes
geom_stratum receives a dataset of the horizontal (x) and
vertical (y, ymin, ymax) positions of the strata of an
alluvial diagram.
It plots rectangles for these strata of a provided width.
geom_stratum(mapping = NULL, data = NULL, stat = "stratum",
  position = "identity", show.legend = NA, inherit.aes = TRUE,
  width = 1/3, axis_width = NULL, na.rm = FALSE, ...)
Arguments
| mapping | Set of aesthetic mappings created by |
|---|---|
| data | The data to be displayed in this layer. There are three options: If A A |
| stat | The statistical transformation to use on the data; override the default. |
| position | Position adjustment, either as a string, or the result of a call to a position adjustment function. |
| show.legend | logical. Should this layer be included in the legends?
|
| inherit.aes | If |
| width | Numeric; the width of each stratum, as a proportion of the distance between axes. Defaults to 1/3. |
| axis_width | Deprecated; alias for |
| na.rm | Logical:
if |
| ... | Additional arguments passed to |
Aesthetics
geom_stratum understands the following aesthetics
(required aesthetics are in bold):
xyyminymaxalphacolourfilllinetypesizegroup
group is used internally; arguments are ignored.
See also
layer for additional arguments, and
stat_stratum for the corresponding geom.
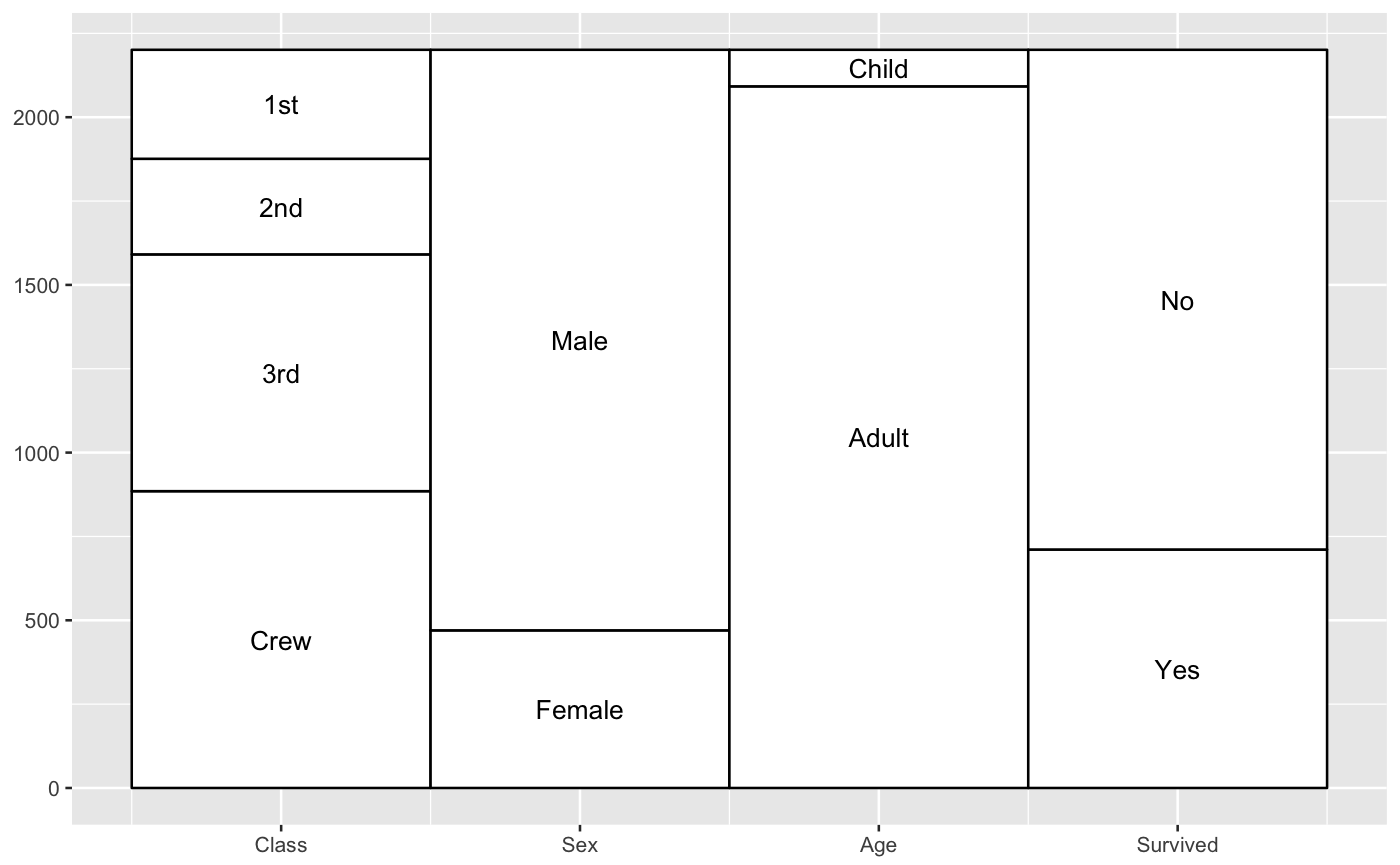
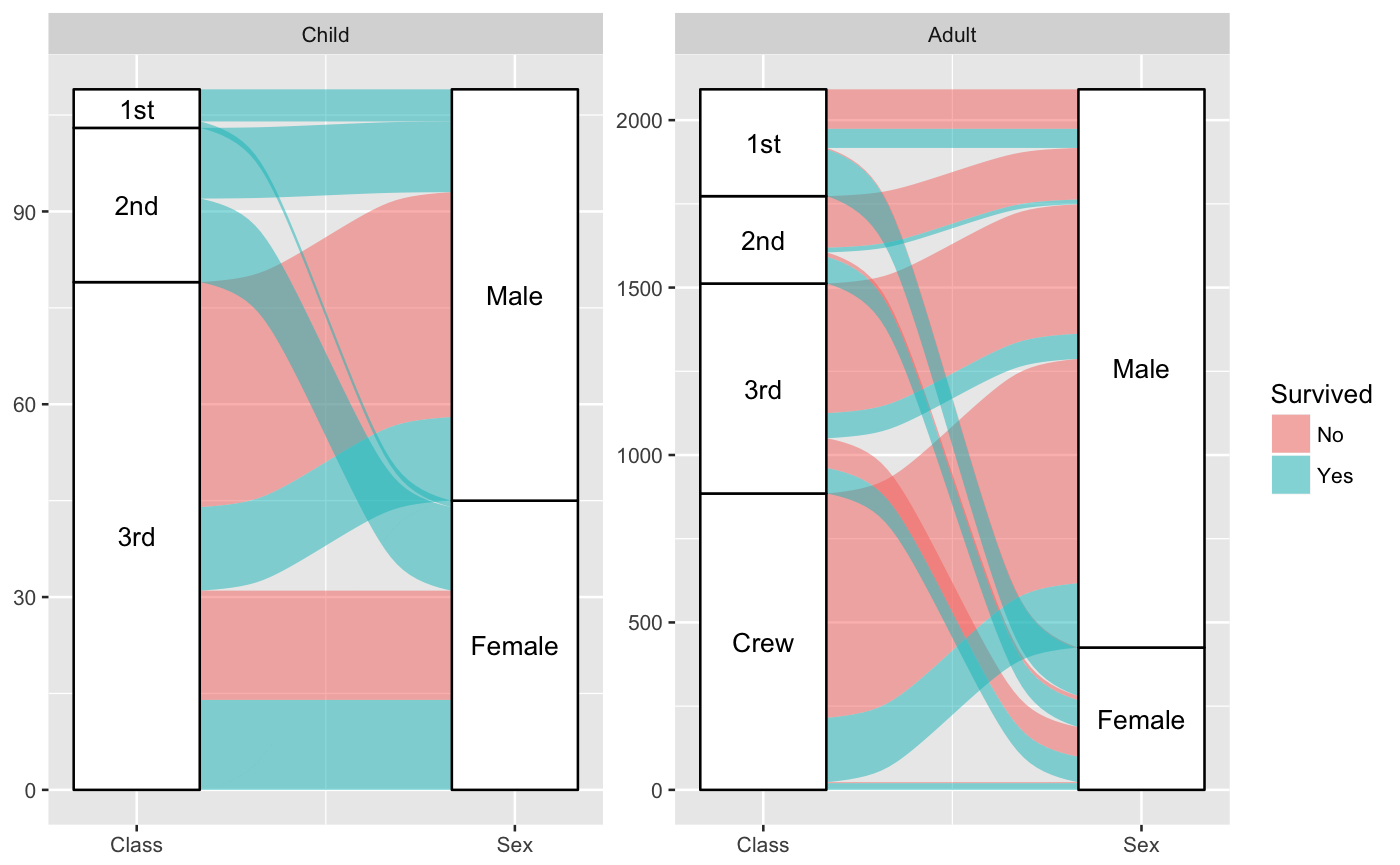
Examples
# full axis width ggplot(as.data.frame(Titanic), aes(weight = Freq, axis1 = Class, axis2 = Sex, axis3 = Age, axis4 = Survived)) + geom_stratum(width = 1) + geom_text(stat = "stratum", label.strata = TRUE) + scale_x_continuous(breaks = 1:4, labels = c("Class", "Sex", "Age", "Survived"))# use of facets ggplot(as.data.frame(Titanic), aes(weight = Freq, axis1 = Class, axis2 = Sex)) + geom_flow(aes(fill = Survived)) + geom_stratum() + geom_text(stat = "stratum", label.strata = TRUE) + scale_x_continuous(breaks = 1:2, labels = c("Class", "Sex")) + facet_wrap(~ Age, scales = "free_y")