Stratum positions
Given a dataset with alluvial structure, stat_stratum calculates the
centroids of the strata at each axis, together with their weights (heights).
stat_stratum(mapping = NULL, data = NULL, geom = "stratum",
  position = "identity", decreasing = NA, reverse = TRUE,
  label.strata = FALSE, show.legend = NA, inherit.aes = TRUE,
  na.rm = FALSE, ...)
Arguments
| mapping | Set of aesthetic mappings created by |
|---|---|
| data | The data to be displayed in this layer. There are three options: If A A |
| geom | The geometric object to use display the data; override the default. |
| position | Position adjustment, either as a string, or the result of a call to a position adjustment function. |
| decreasing | Logical; whether to arrange the strata at each axis
in the order of the variable values ( |
| reverse | Logical; if |
| label.strata | Logical; whether to assign the values of the axis
variables to the strata. Defaults to FALSE, and requires that no
|
| show.legend | logical. Should this layer be included in the legends?
|
| inherit.aes | If |
| na.rm | Logical:
if |
| ... | Additional arguments passed to |
Aesthetics
stat_stratum requires one of two sets of aesthetics:
x,stratum, and (optionally)alluviumany number of
axis[0-9]*(axis1,axis2, etc.)
Use x and stratum for data in lodes format
(alluvium is ignored)
and axis[0-9]* for data in alluvia format
(see is_alluvial).
Arguments to parameters inconsistent with the format will be ignored.
Additionally, stat_stratum accepts the following optional aesthetics:
weightlabelgroup
weight controls the vertical dimensions of the alluvia
and are aggregated across equivalent observations.
label is used to label the strata and must take a unique value across
the observations within each stratum.
These and any other aesthetics are aggregated as follows:
Numeric aesthetics, including weight, are summed.
Character and factor aesthetics, including label,
are assigned to strata provided they take unique values across the
observations within each stratum (otherwise NA is assigned).
group is used internally; arguments are ignored.
See also
layer for additional arguments,
geom_stratum for the corresponding geom, and
stat_alluvium and geom_alluvium for
alluvial flows.
Examples
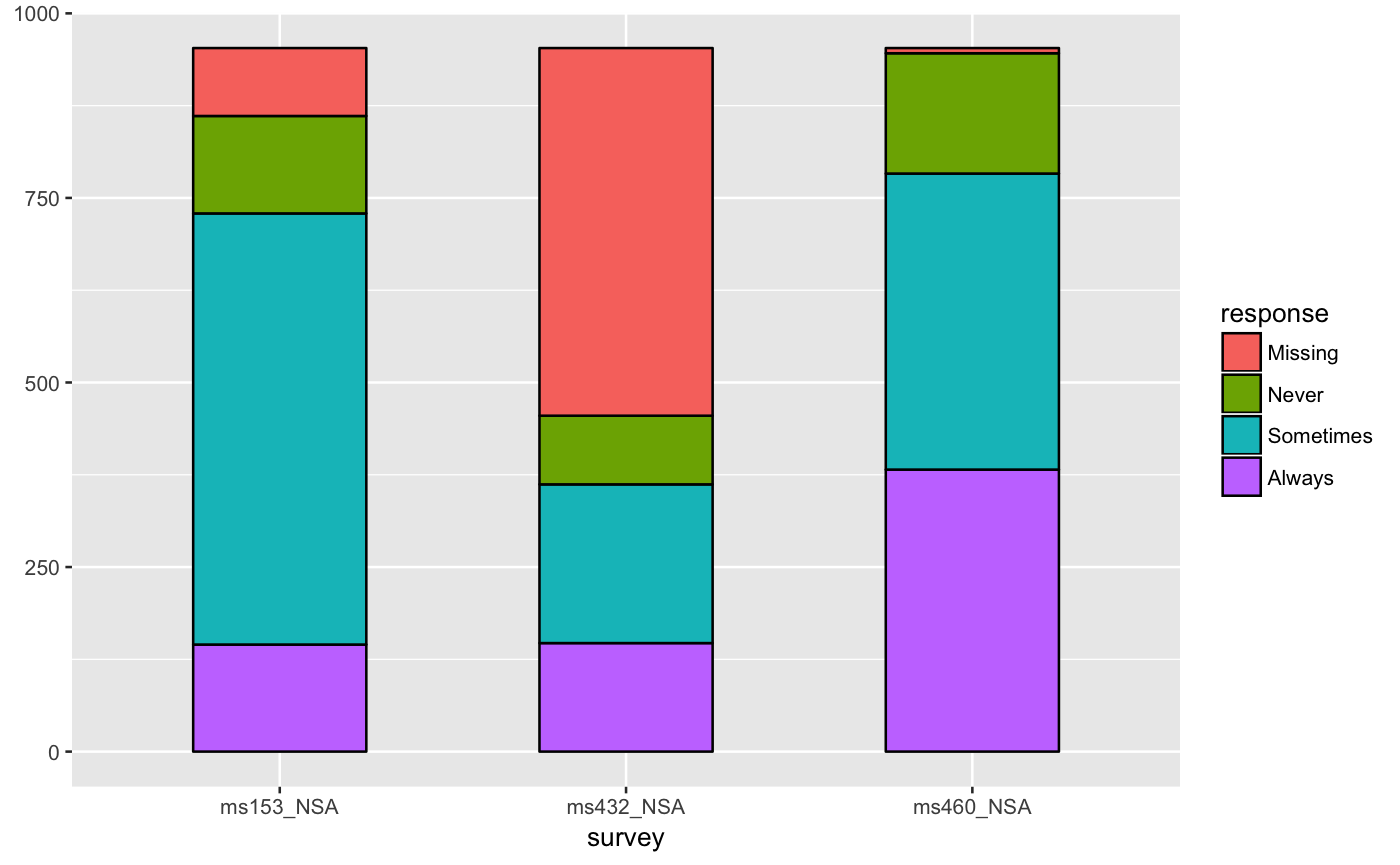
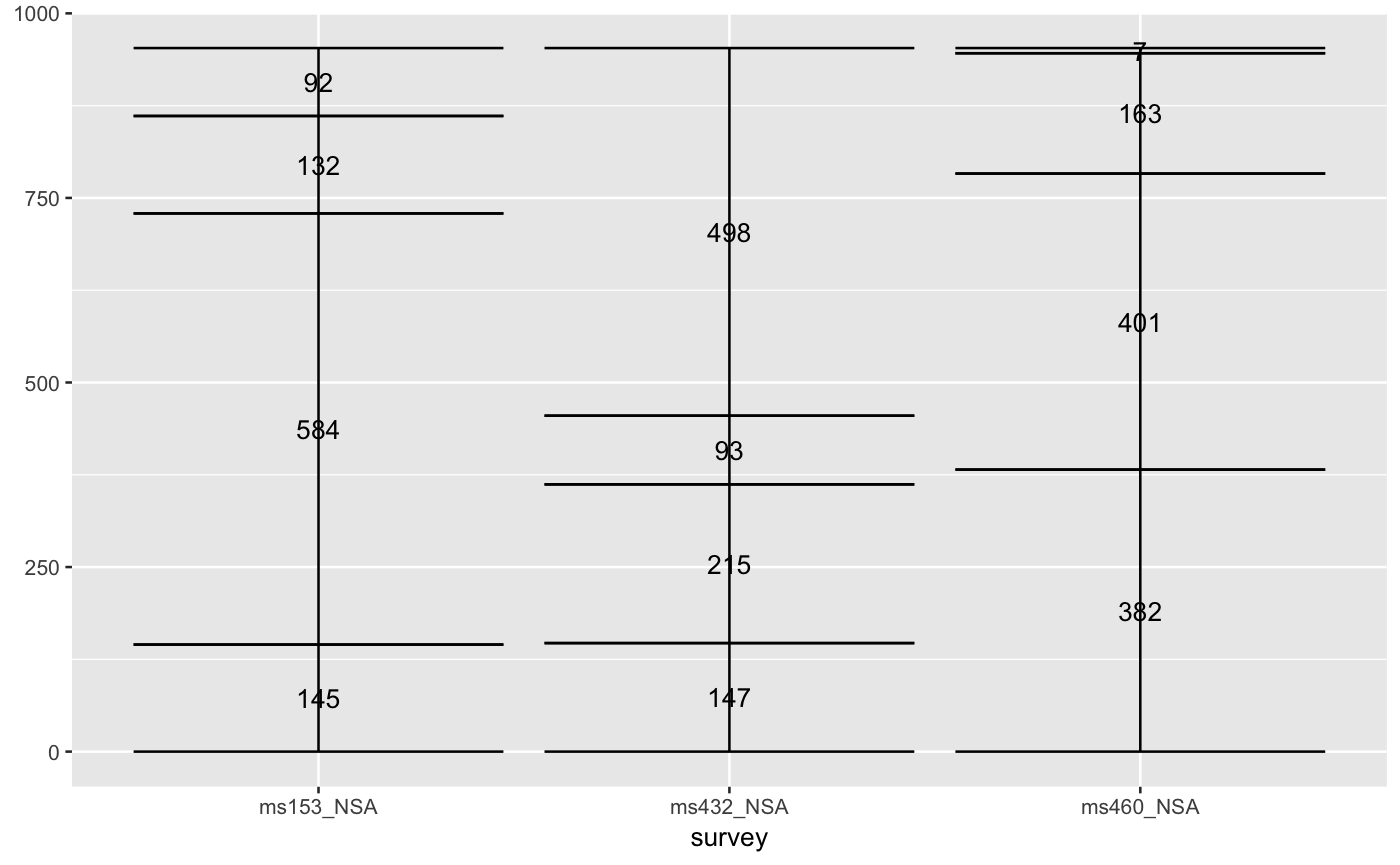
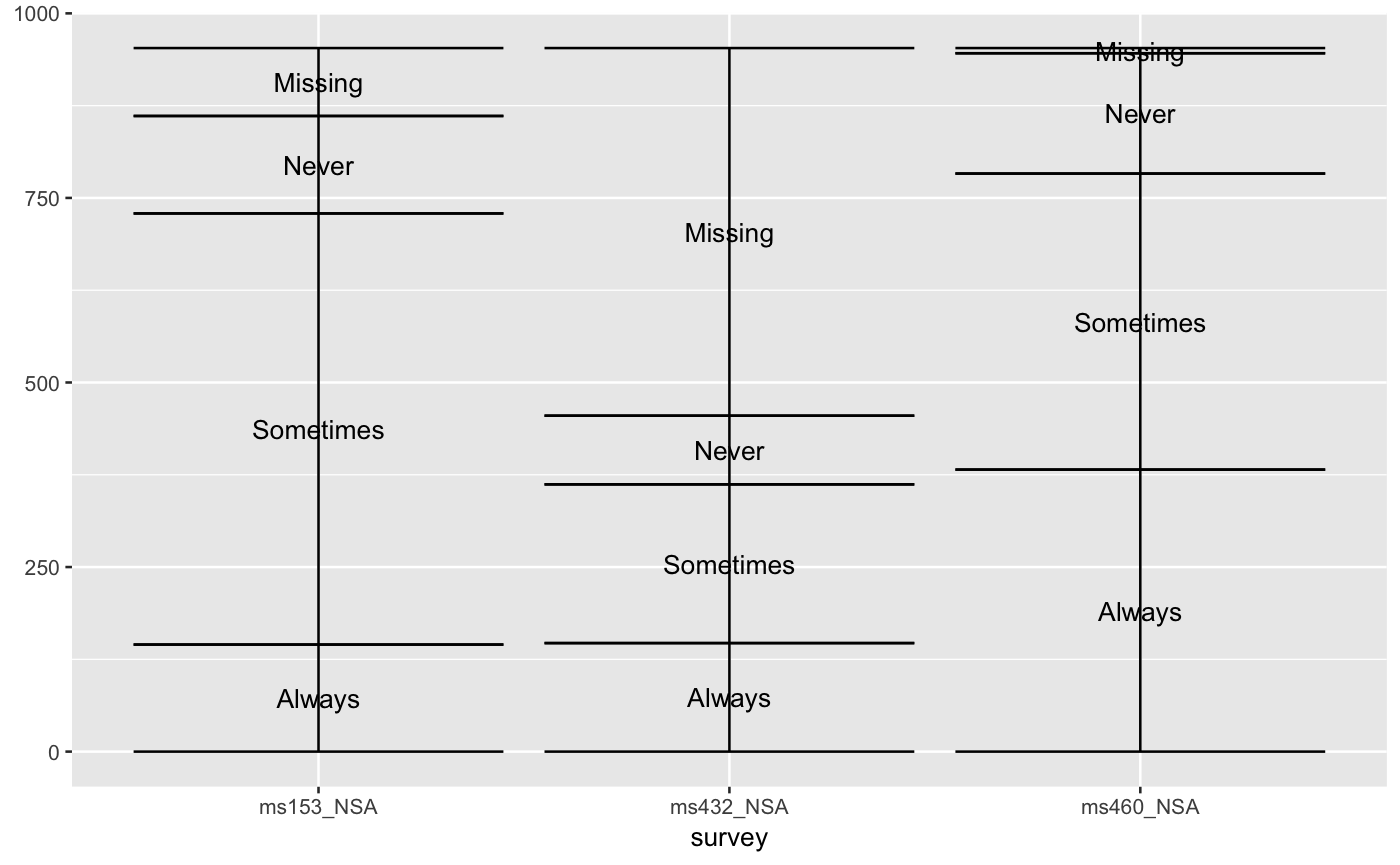
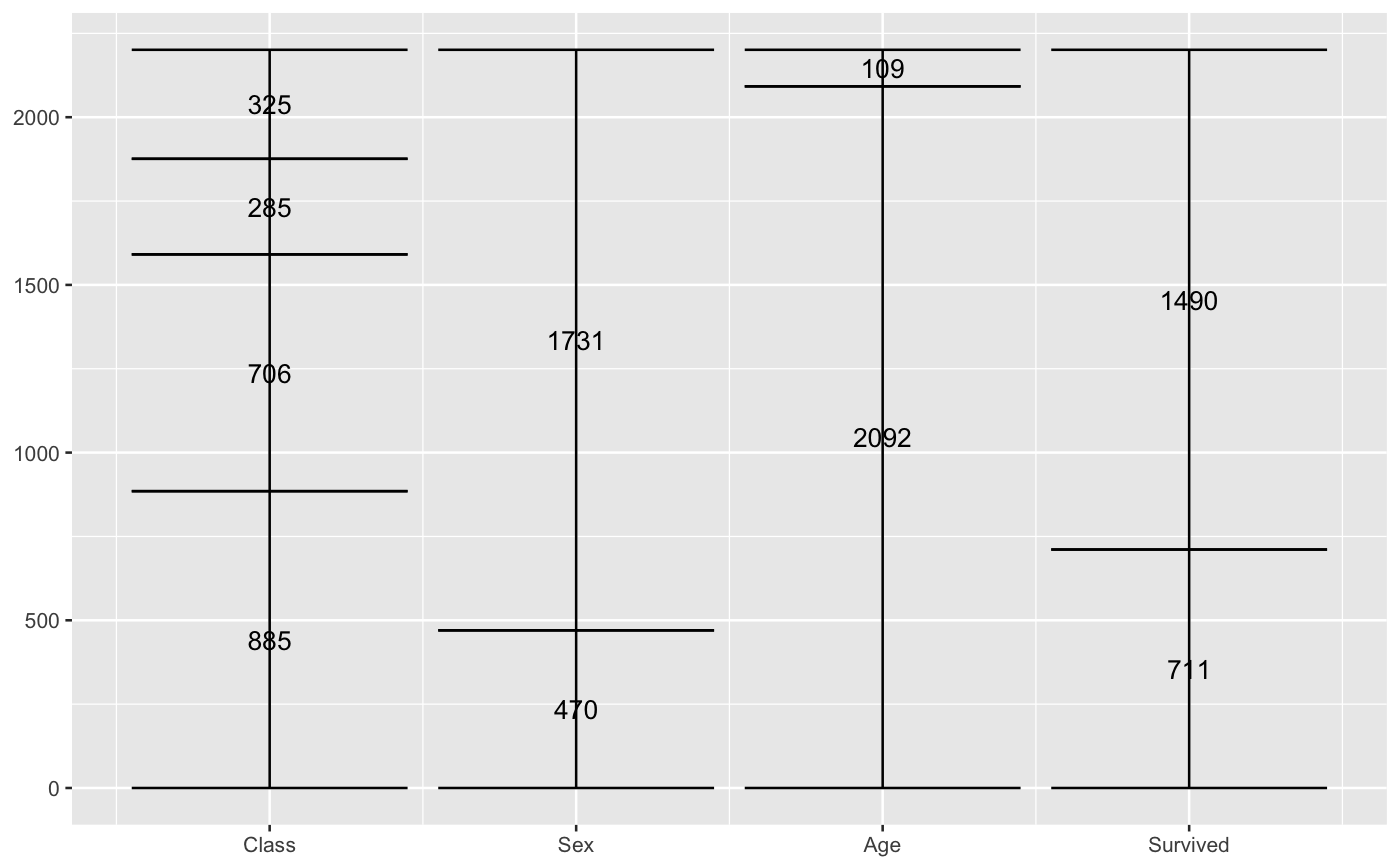
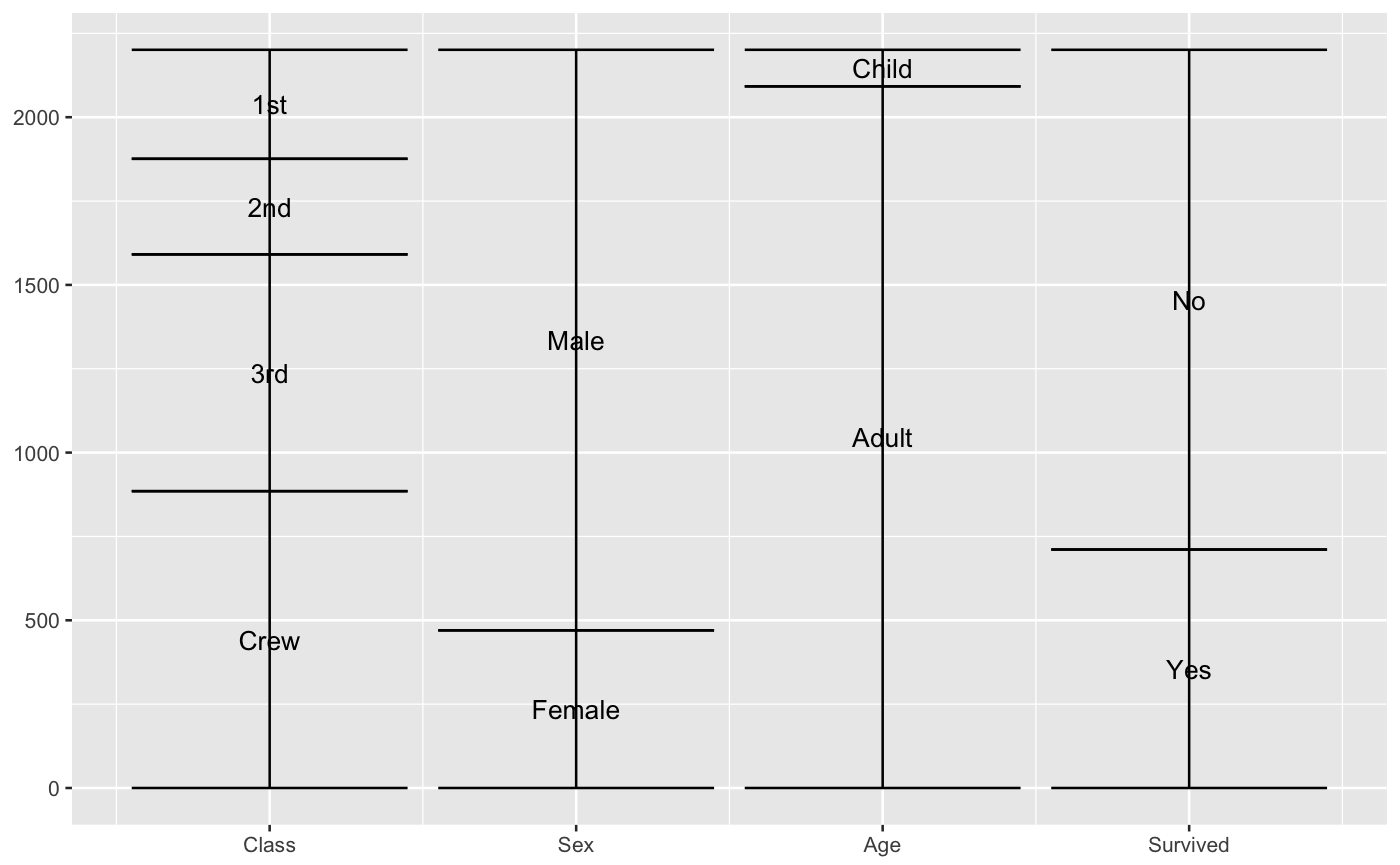
# only 'stratum' assignment is necessary to generate strata data(vaccinations) ggplot(vaccinations, aes(weight = freq, x = survey, stratum = response, fill = response)) + stat_stratum(width = .5)# lode data: positioning with weight labels ggplot(vaccinations, aes(weight = freq, x = survey, stratum = response, alluvium = subject, label = freq)) + stat_stratum(geom = "errorbar") + geom_text(stat = "stratum")# lode data: positioning with stratum labels ggplot(vaccinations, aes(weight = freq, x = survey, stratum = response, alluvium = subject, label = response)) + stat_stratum(geom = "errorbar") + geom_text(stat = "stratum")# alluvium data: positioning with weight labels ggplot(as.data.frame(Titanic), aes(weight = Freq, axis1 = Class, axis2 = Sex, axis3 = Age, axis4 = Survived, label = Freq)) + geom_text(stat = "stratum") + stat_stratum(geom = "errorbar") + scale_x_continuous(breaks = 1:4, labels = c("Class", "Sex", "Age", "Survived"))# alluvium data: positioning with stratum labels ggplot(as.data.frame(Titanic), aes(weight = Freq, axis1 = Class, axis2 = Sex, axis3 = Age, axis4 = Survived)) + geom_text(stat = "stratum", label.strata = TRUE) + stat_stratum(geom = "errorbar") + scale_x_continuous(breaks = 1:4, labels = c("Class", "Sex", "Age", "Survived"))
