Alluvial positions
Given a dataset with alluvial structure, stat_alluvium calculates the
centroids (x and y) of the lodes, the intersections of
the alluvia with the strata, together with their weights (heights;
ymin and ymax). It leverages the group aesthetic for
plotting purposes (for now).
stat_alluvium(mapping = NULL, data = NULL, geom = "alluvium",
  position = "identity", decreasing = NA, reverse = TRUE,
  aggregate.wts = FALSE, lode.guidance = "zigzag", lode.ordering = NULL,
  na.rm = FALSE, show.legend = NA, inherit.aes = TRUE, ...)
Arguments
| mapping | Set of aesthetic mappings created by |
|---|---|
| data | The data to be displayed in this layer. There are three options: If A A |
| geom | The geometric object to use display the data; override the default. |
| position | Position adjustment, either as a string, or the result of a call to a position adjustment function. |
| decreasing | Logical; whether to arrange the strata at each axis
in the order of the variable values ( |
| reverse | Logical; if |
| aggregate.wts | Whether to aggregate weights across otherwise equivalent
rows before computing lode and flow positions. Set to |
| lode.guidance | The function to prioritize the axis variables for
ordering the lodes within each stratum. Options are "zigzag", "rightleft",
"leftright", "rightward", and "leftward" (see
|
| lode.ordering | A list (of length the number of axes) of integer vectors
(each of length the number of rows of |
| na.rm | Logical:
if |
| show.legend | logical. Should this layer be included in the legends?
|
| inherit.aes | If |
| ... | Additional arguments passed to |
Aesthetics
stat_alluvium requires one of two sets of aesthetics:
x,alluvium, and (optionally)stratumany number of
axis[0-9]*(axis1,axis2, etc.)
Use x, alluvium, and stratum for data in lodes format
and axis[0-9]* for data in alluvia format
(see is_alluvial).
Arguments to parameters inconsistent with the format will be ignored.
Additionally, stat_alluvium accepts the following optional aesthetics:
weightgroup
weight controls the vertical dimensions of the alluvia
and are aggregated across equivalent observations.
group is used internally; arguments are ignored.
See also
layer for additional arguments,
geom_alluvium for the corresponding geom, and
stat_stratum and geom_stratum for
intra-axis boxes.
Examples
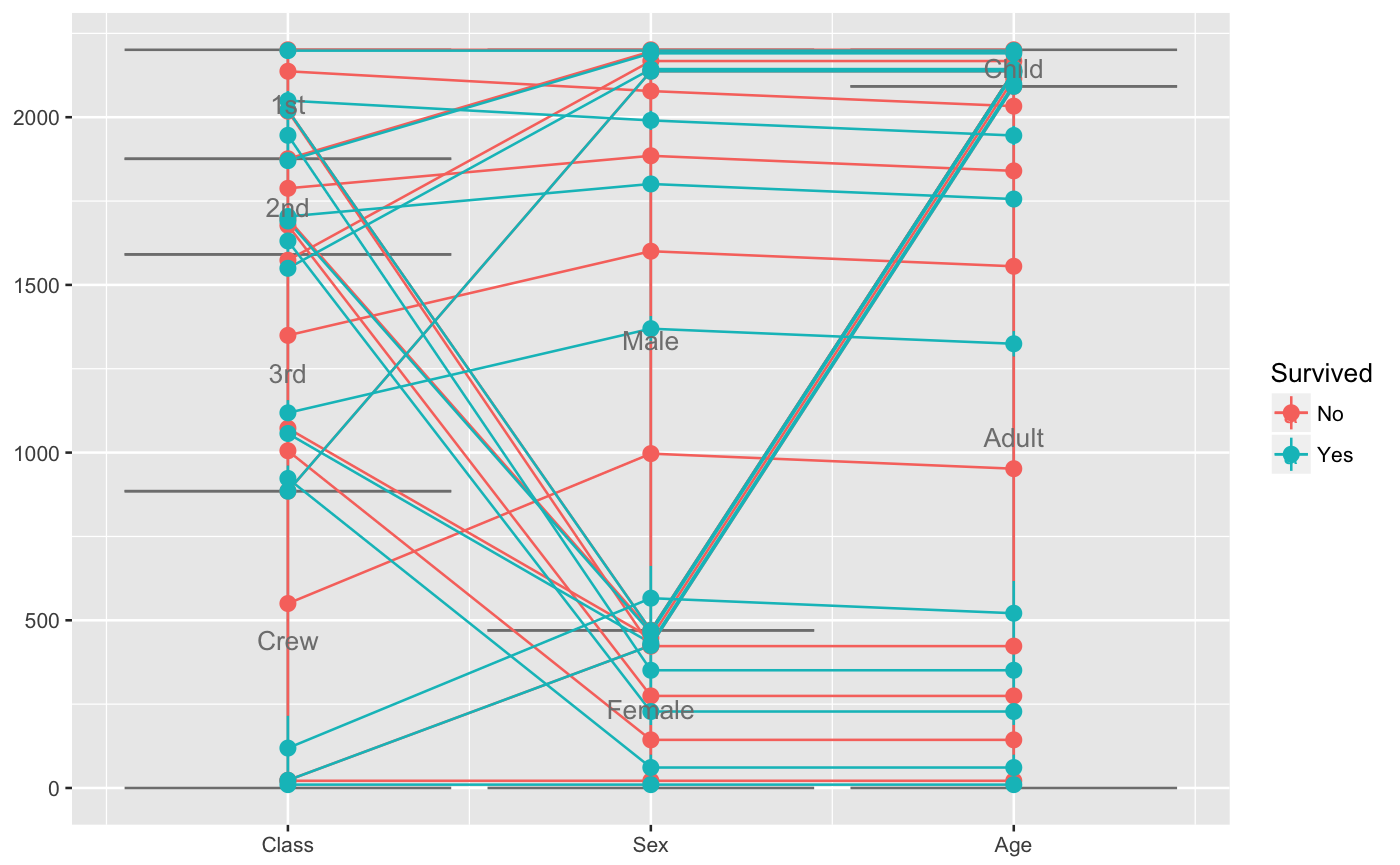
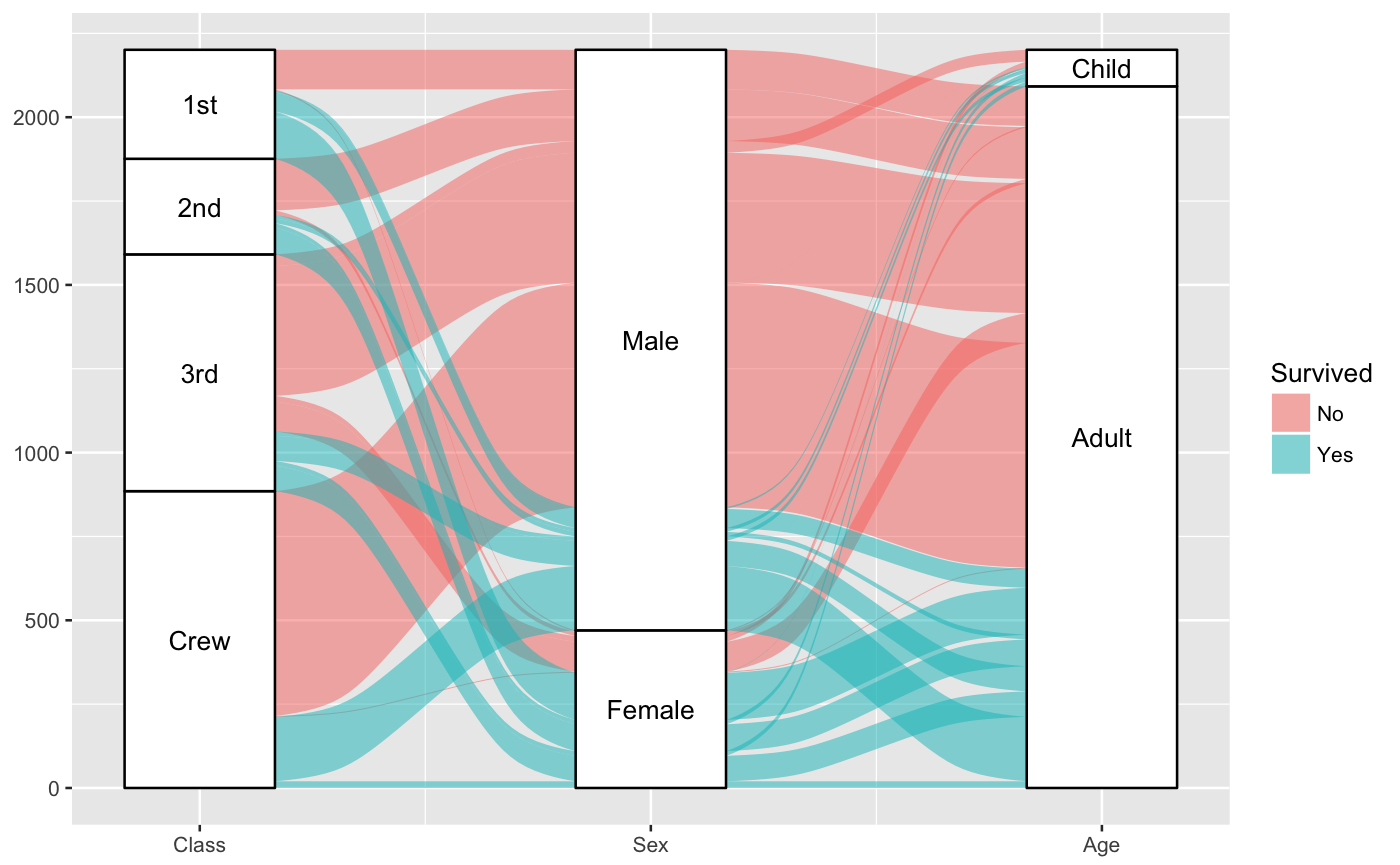
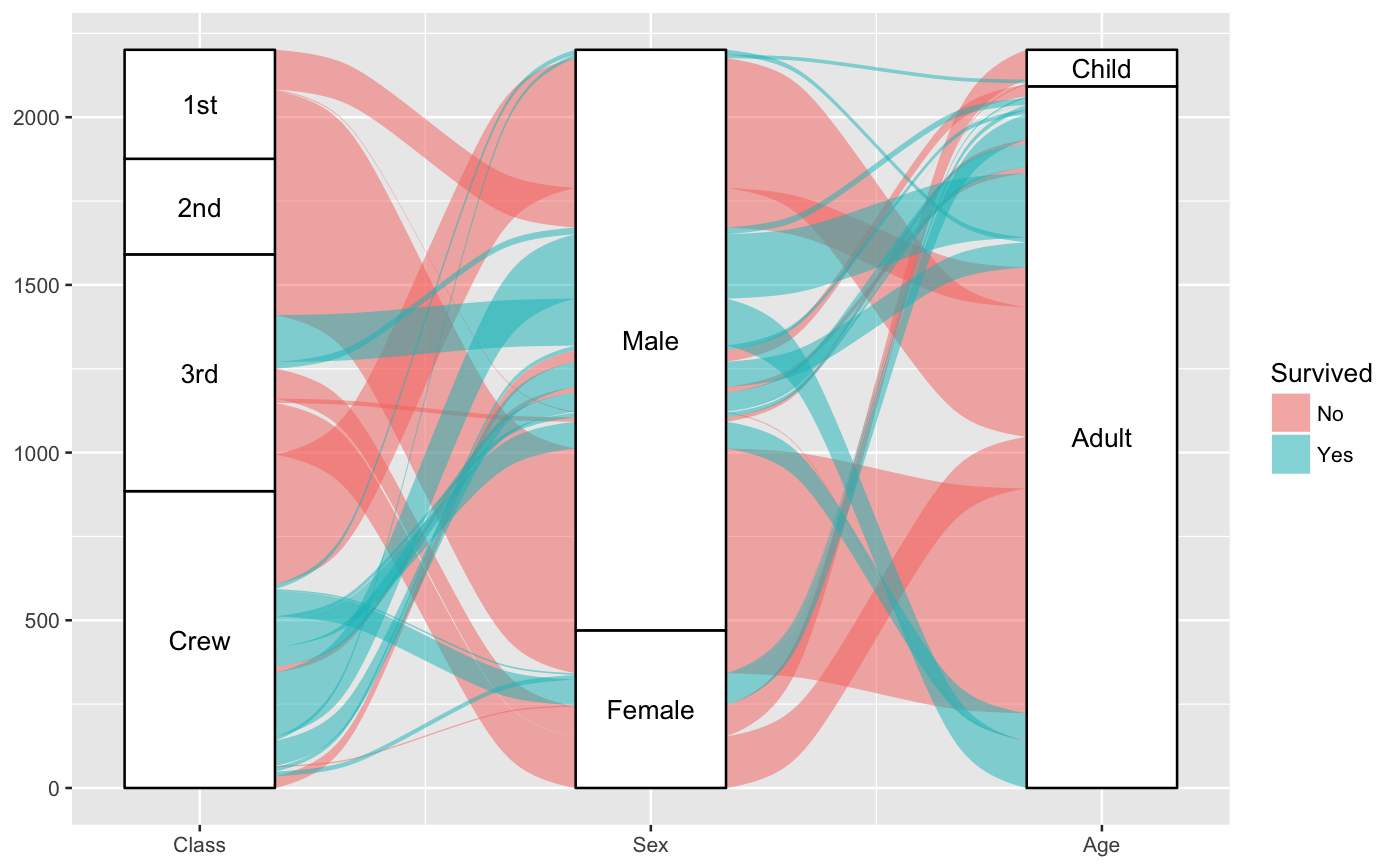
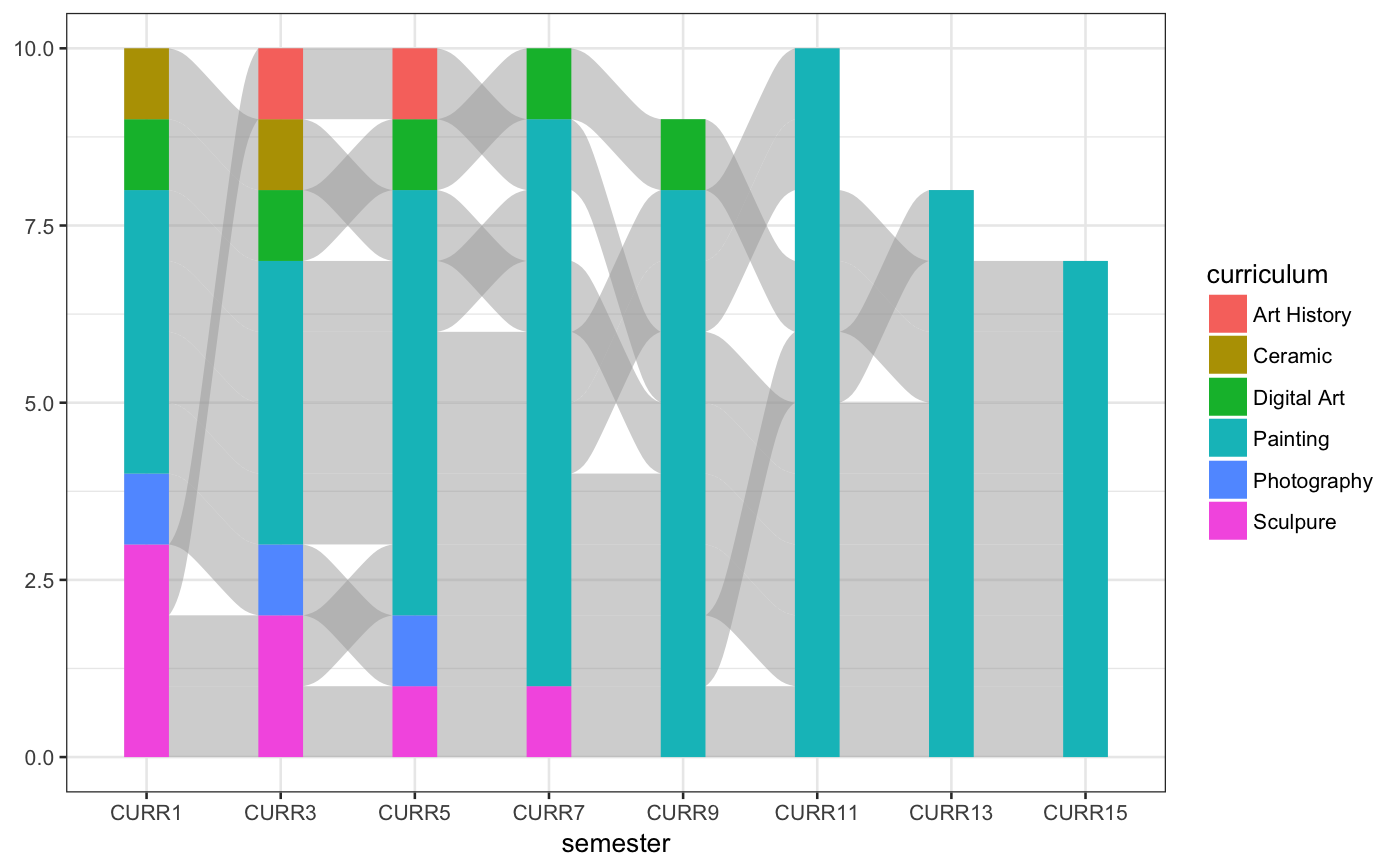
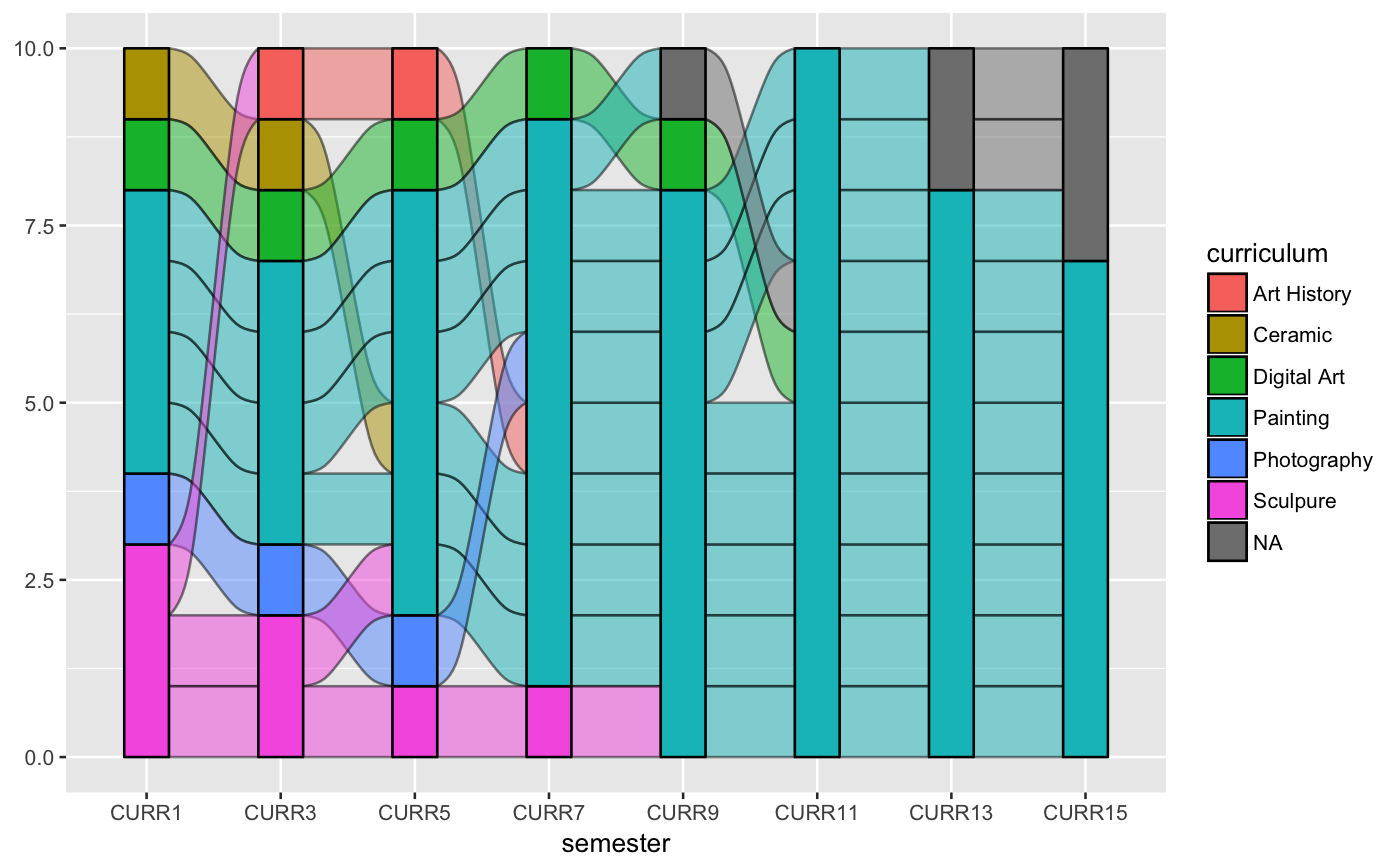
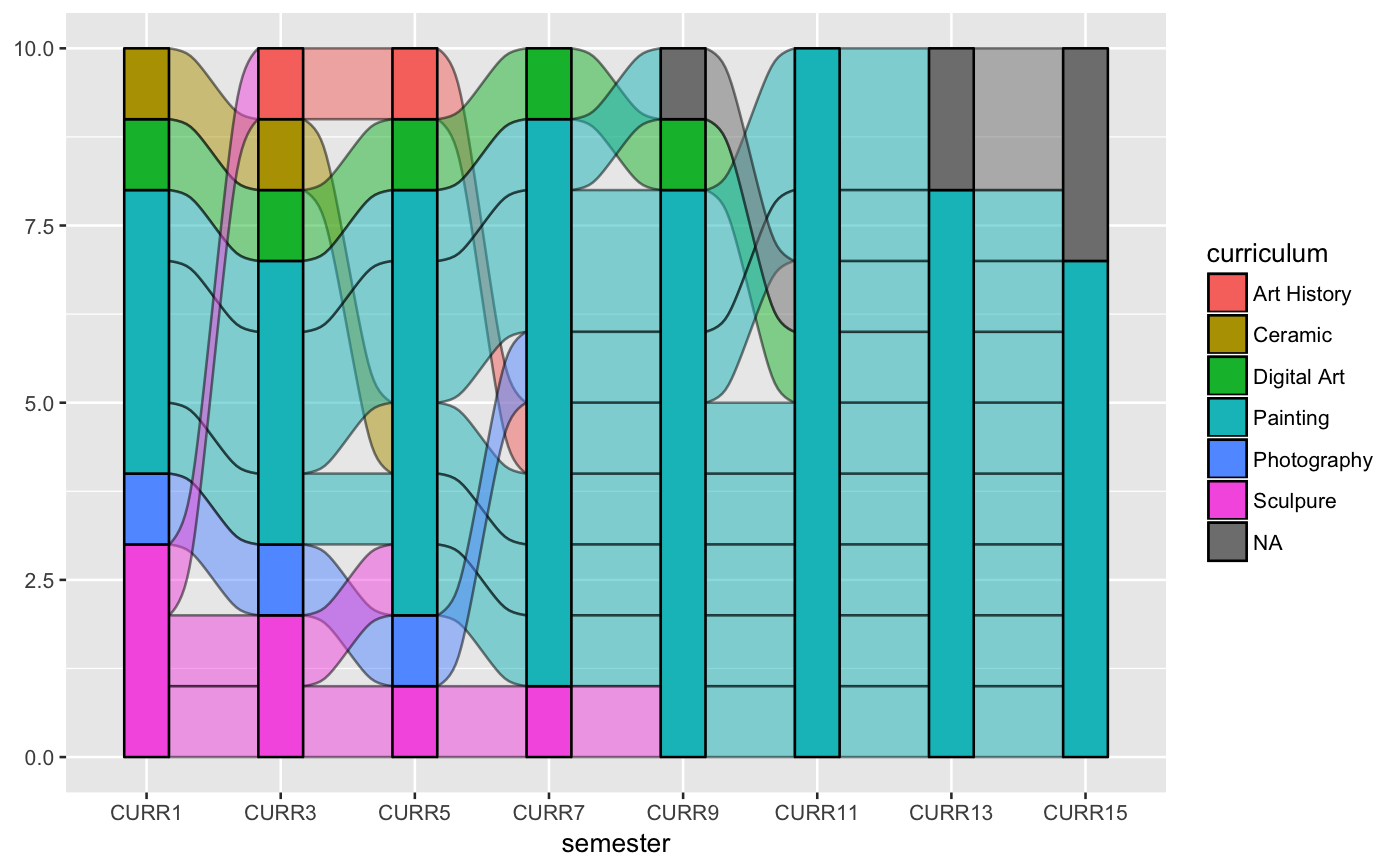
# illustrate positioning ggplot(as.data.frame(Titanic), aes(weight = Freq, axis1 = Class, axis2 = Sex, axis3 = Age, color = Survived)) + stat_stratum(geom = "errorbar") + geom_line(stat = "alluvium") + stat_alluvium(geom = "pointrange") + geom_text(stat = "stratum", label.strata = TRUE) + scale_x_continuous(breaks = 1:3, labels = c("Class", "Sex", "Age"))# use of lode controls ggplot(as.data.frame(Titanic), aes(weight = Freq, axis1 = Class, axis2 = Sex, axis3 = Age)) + geom_flow(aes(fill = Survived), stat = "alluvium", aes.bind = TRUE, lode.guidance = "rightward") + geom_stratum() + geom_text(stat = "stratum", label.strata = TRUE) + scale_x_continuous(breaks = 1:3, labels = c("Class", "Sex", "Age"))# use of lode ordering lode_ord <- replicate(n = 3, expr = sample(x = 32), simplify = FALSE) ggplot(as.data.frame(Titanic), aes(weight = Freq, axis1 = Class, axis2 = Sex, axis3 = Age)) + geom_flow(aes(fill = Survived), stat = "alluvium", lode.ordering = lode_ord) + geom_stratum() + geom_text(stat = "stratum", label.strata = TRUE) + scale_x_continuous(breaks = 1:3, labels = c("Class", "Sex", "Age"))data(majors) # omit missing lodes and incident flows ggplot(majors, aes(x = semester, stratum = curriculum, alluvium = student, label = curriculum)) + geom_alluvium(fill = "darkgrey", na.rm = TRUE) + geom_stratum(aes(fill = curriculum), color = NA, na.rm = TRUE) + theme_bw()# diagram with outlined alluvia and forward-colored flows ggplot(majors, aes(x = semester, stratum = curriculum, alluvium = student, fill = curriculum, label = curriculum)) + geom_flow(stat = "alluvium", lode.guidance = "rightleft", color = "black") + geom_stratum()# same diagram with alluvium aggregation enabled, # so that students are aggregated into cohorts ggplot(majors, aes(x = semester, stratum = curriculum, alluvium = student, fill = curriculum, label = curriculum)) + geom_flow(stat = "alluvium", lode.guidance = "rightleft", color = "black", aggregate.wts = TRUE) + geom_stratum()# NOT RUN { data(babynames, package = "babynames") # a discontiguous alluvium bn <- dplyr::filter(babynames, prop >= .01 & sex == "F" & year > 1962 & year < 1968) ggplot(data = bn, aes(x = year, alluvium = name, weight = prop)) + geom_alluvium(aes(fill = name, color = name == "Tammy"), decreasing = TRUE, show.legend = FALSE) + scale_color_manual(values = c("#00000000", "#000000")) # filling in missing zeros bn2 <- merge(bn, expand.grid(year = unique(bn$year), name = unique(bn$name)), all = TRUE) bn2$prop[is.na(bn2$prop)] <- 0 ggplot(data = bn2, aes(x = year, alluvium = name, weight = prop)) + geom_alluvium(aes(fill = name, color = name == "Tammy"), decreasing = TRUE, show.legend = FALSE) + scale_color_manual(values = c("#00000000", "#000000")) # }
