Step by step
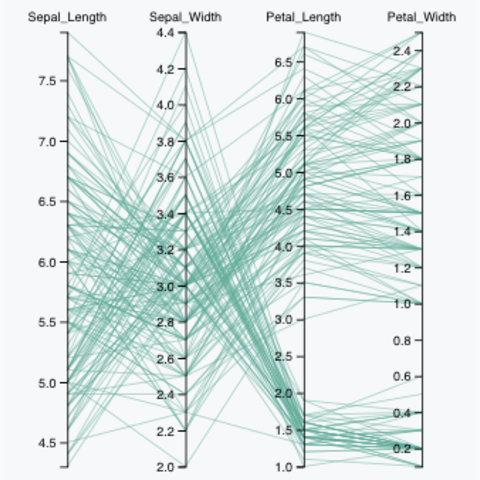
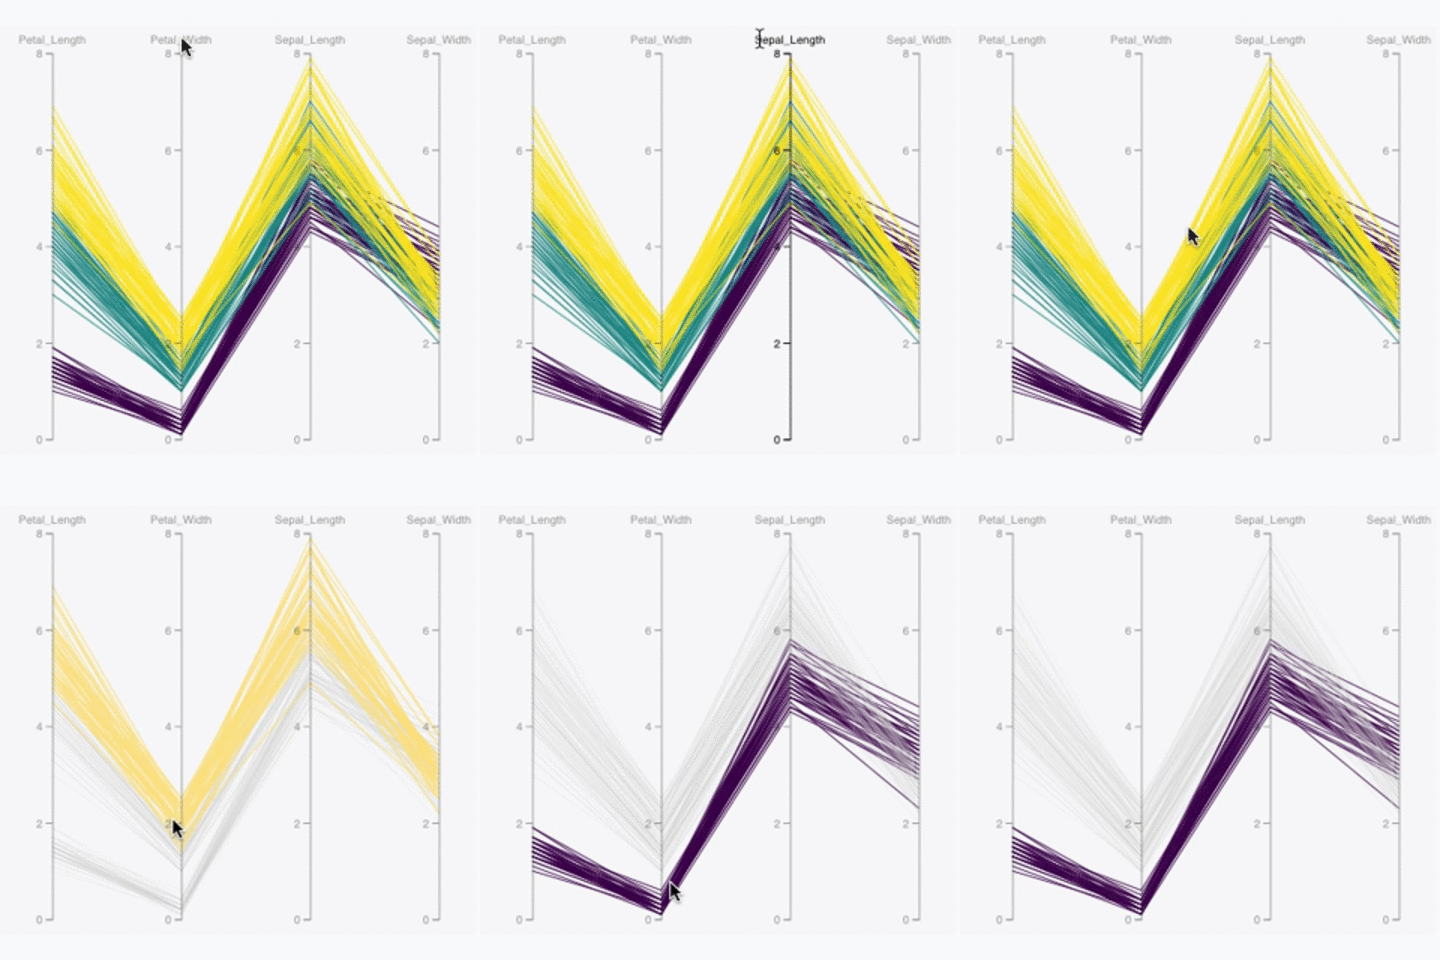
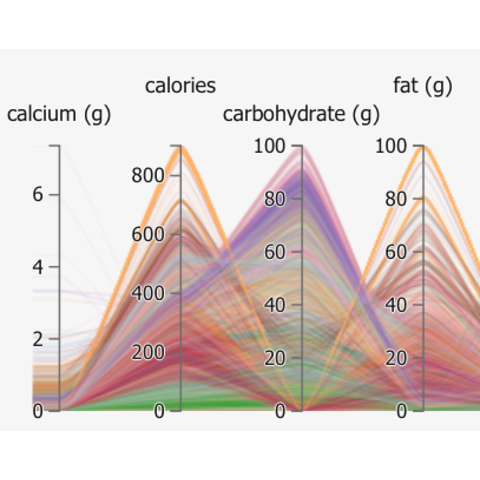
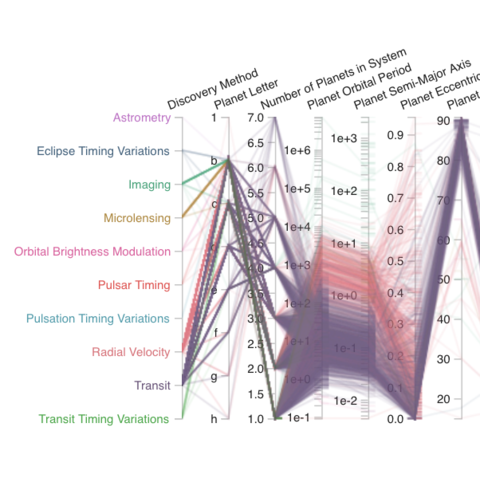
The trickiest part of the parallel coordinate chart is to build one axis per group automatically. This concept is described in the first example below. Then, it is easy to add hover and color effect to highlight group differences, and to custom axis ranges.
Selection of blocks


