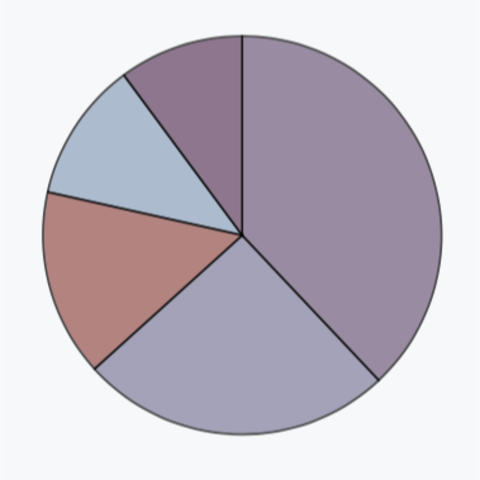
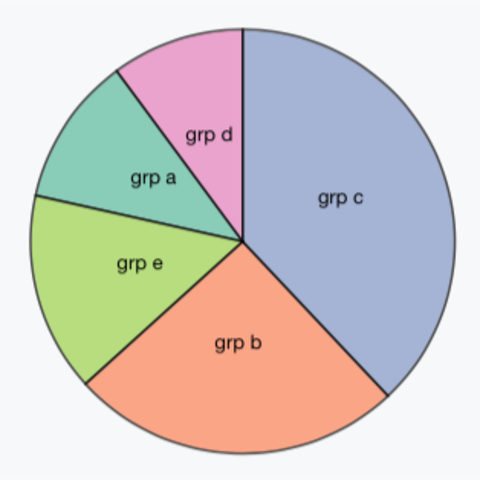
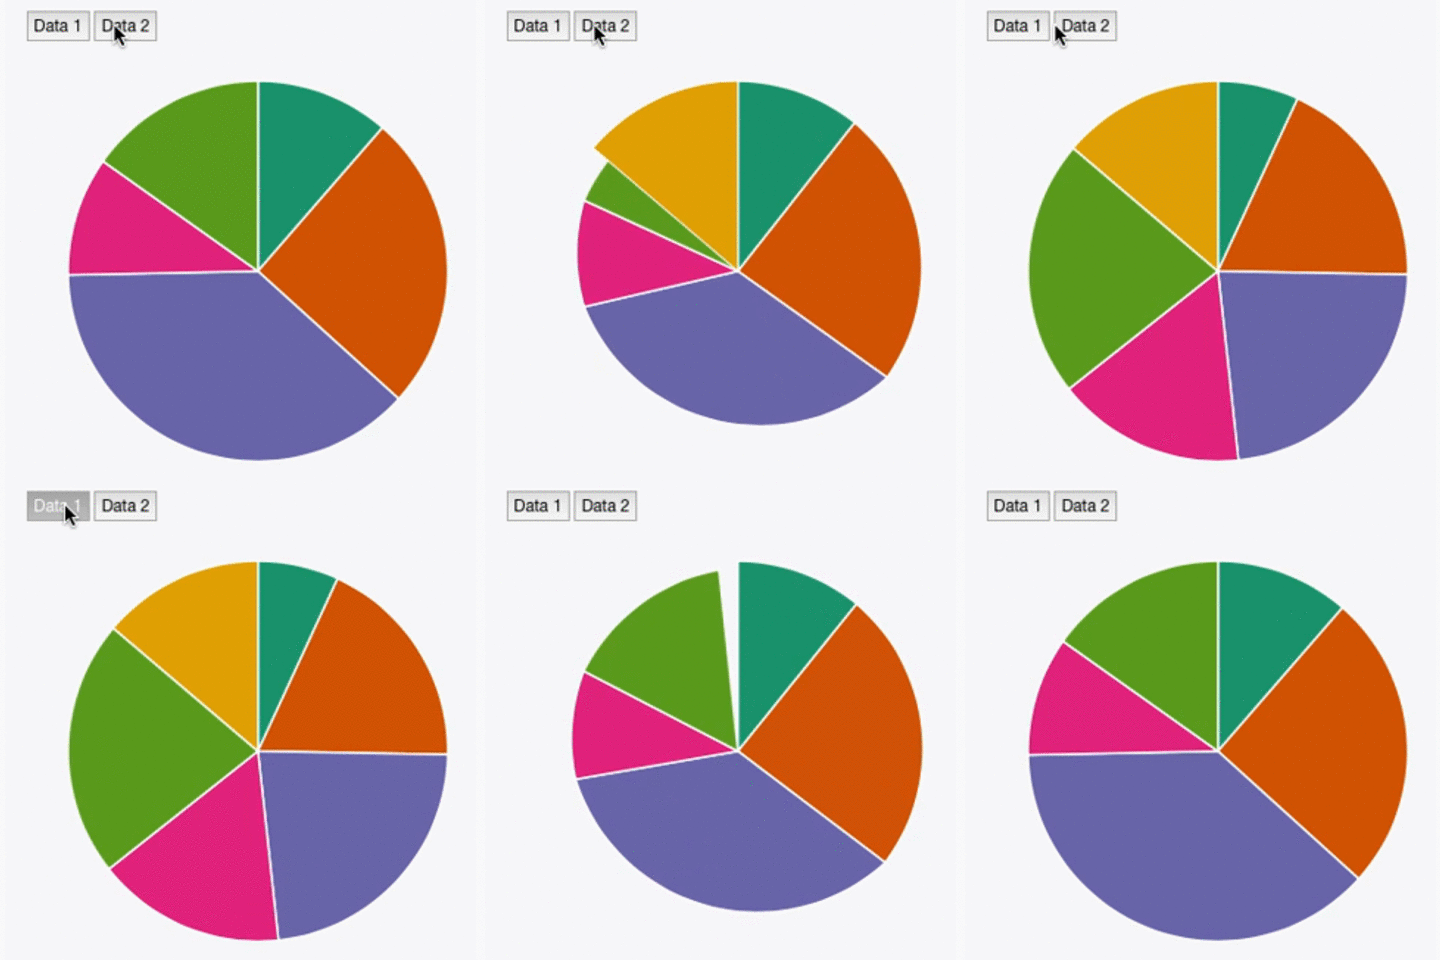
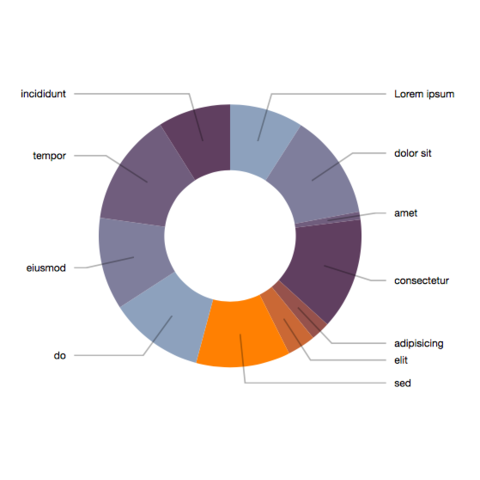
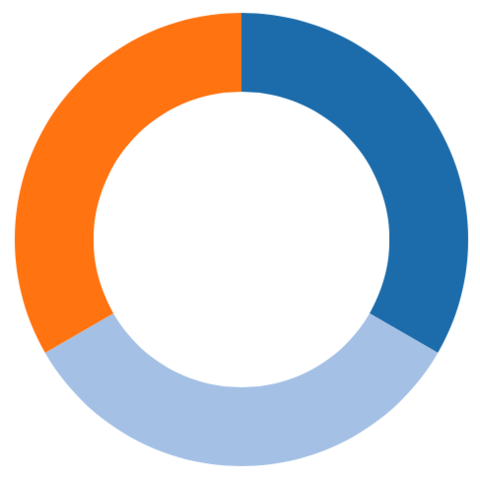
It is of interest to note that pie chart and donut chart are built using exactly the same process in d3.js. Thus, you probably want to visit the donut section for more examples
Donut chart sectionBuilding a pie chart in d3.js always start by using the d3.pie() function. This function transform the value of each group to a radius that will be displayed on the chart. This radius is then provided to the d3.arc() function that draws on arc per group.
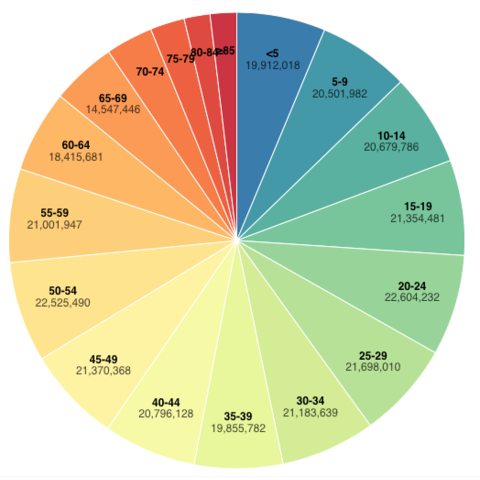
A selection of examples showing the application of the basic concept to real life dataset.
