Ggplot2 boxplot parameters


A boxplot summarizes the distribution of a continuous variable. The ggplot2 library allows to build it thanks to the geom_boxplot function. This function offers several options to custom its appearance and this post is dedicated to them.

Boxplot Section Boxplot pitfalls

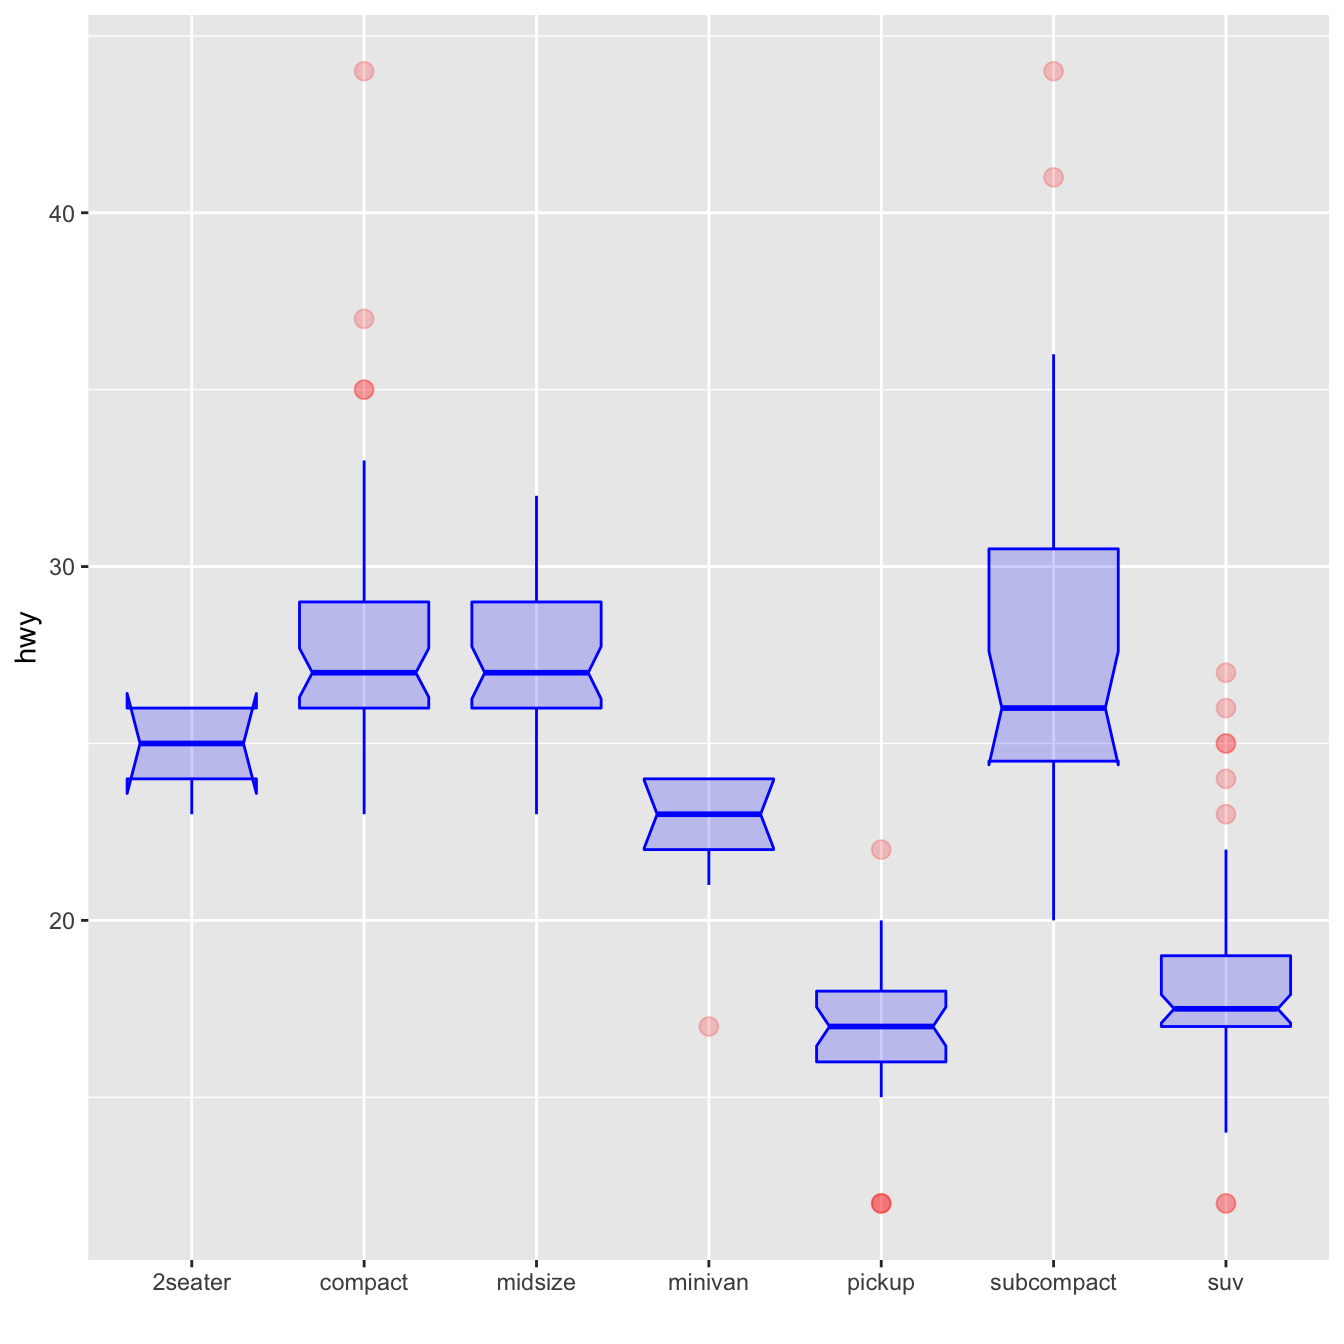
This chart extends the previous most basic boxplot described in graph #262.

It describes the option you can apply to the geom_boxplot() function to custom the general chart appearance.

Note on notches: useful to compare groups: if no overlap between 2 groups, medians are significantly different.

# Load ggplot2
library(ggplot2)
 
# The mpg dataset is natively available
#head(mpg)
 
# geom_boxplot proposes several arguments to custom appearance
ggplot(mpg, aes(x=class, y=hwy)) + 
    geom_boxplot(
        
        # custom boxes
        color="blue",
        fill="blue",
        alpha=0.2,
        
        # Notch?
        notch=TRUE,
        notchwidth = 0.8,
        
        # custom outliers
        outlier.colour="red",
        outlier.fill="red",
        outlier.size=3
    
    )

Related chart types


Violin
Density
Histogram
Boxplot
Ridgeline


❤️ 10 best R tricks ❤️

👋 After crafting hundreds of R charts over 12 years, I've distilled my top 10 tips and tricks. Receive them via email! One insight per day for the next 10 days! 🔥