Basic scatterplot with R and ggplot2


This post provides reproducible code and explanation for the most basic scatterplot you can build with R and ggplot2.

Scatter Section About Scatter

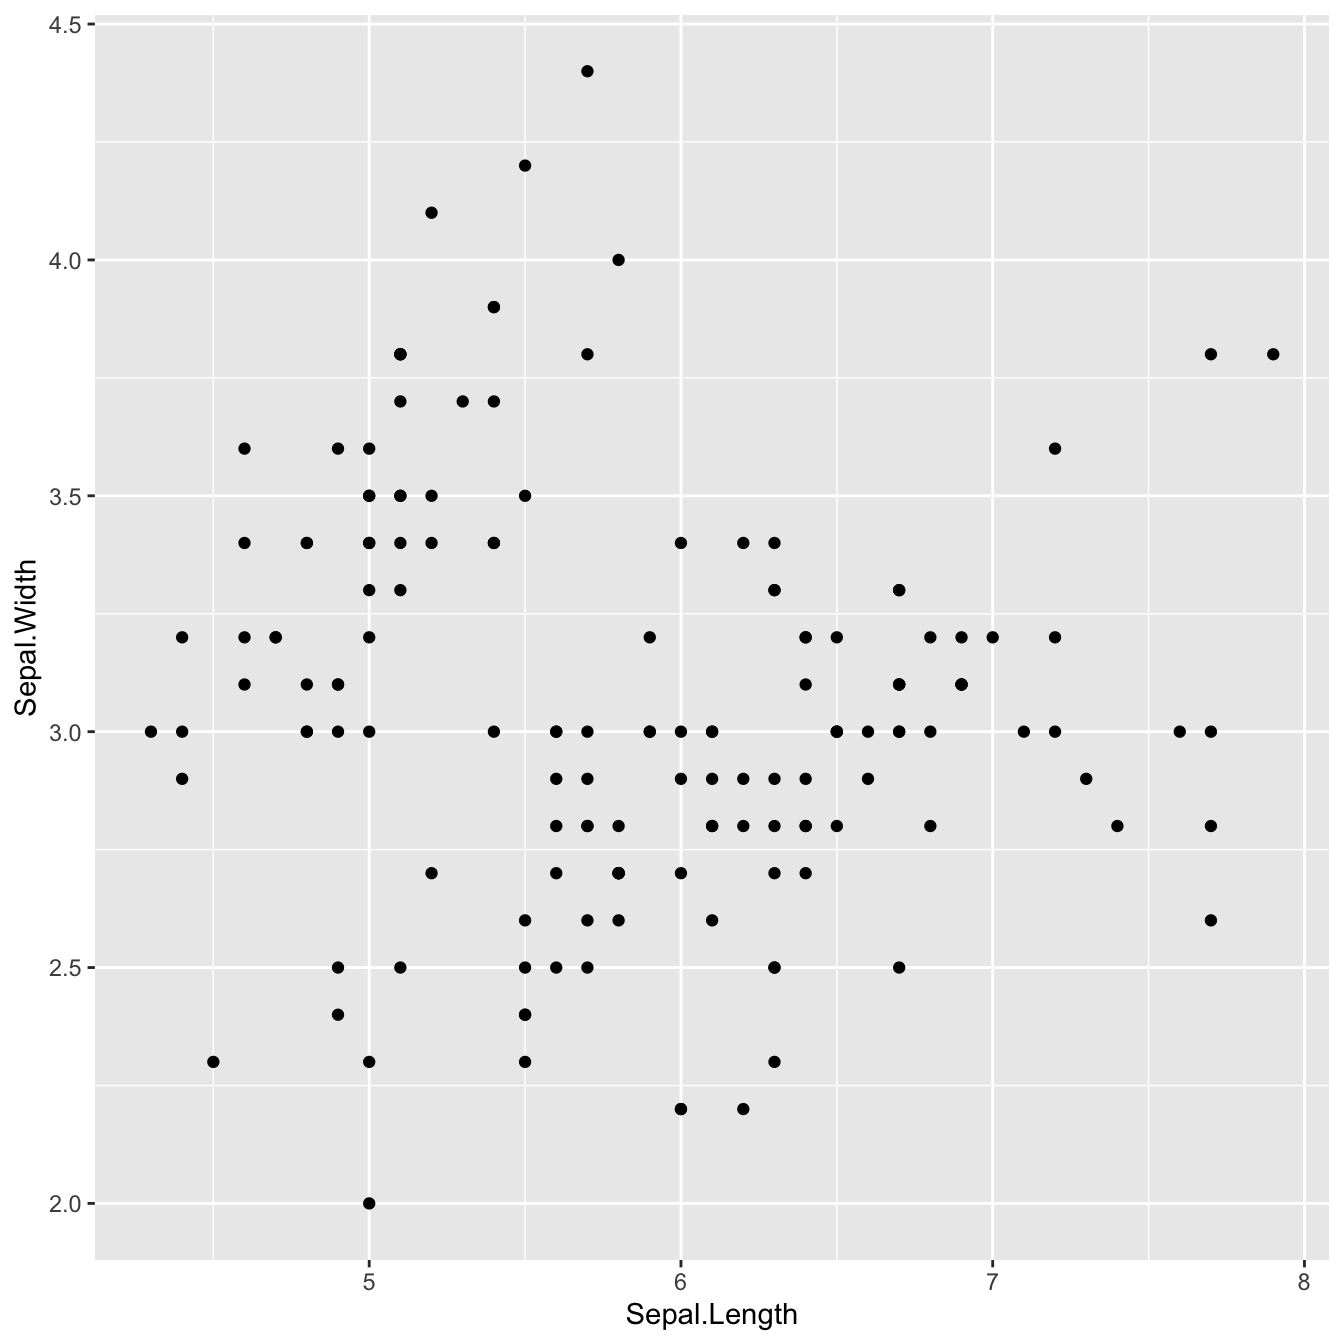
A scatterplot displays the values of two variables along two axes. It shows the relationship between them, eventually revealing a correlation.

Here the relationship between Sepal width and Sepal length of several plants is shown.

It illustrates the basic utilization of ggplot2 for scatterplots:

  • 1 - provide a dataframe
  • 2 - tell which variable to show on x and y axis
  • 3 - add a geom_point() to show points.

# library
library(ggplot2)
 
# The iris dataset is provided natively by R
#head(iris)
 
# basic scatterplot
ggplot(iris, aes(x=Sepal.Length, y=Sepal.Width)) + 
    geom_point()

Related chart types


Scatter
Heatmap
Correlogram
Bubble
Connected scatter
Density 2d


❤️ 10 best R tricks ❤️

👋 After crafting hundreds of R charts over 12 years, I've distilled my top 10 tips and tricks. Receive them via email! One insight per day for the next 10 days! 🔥