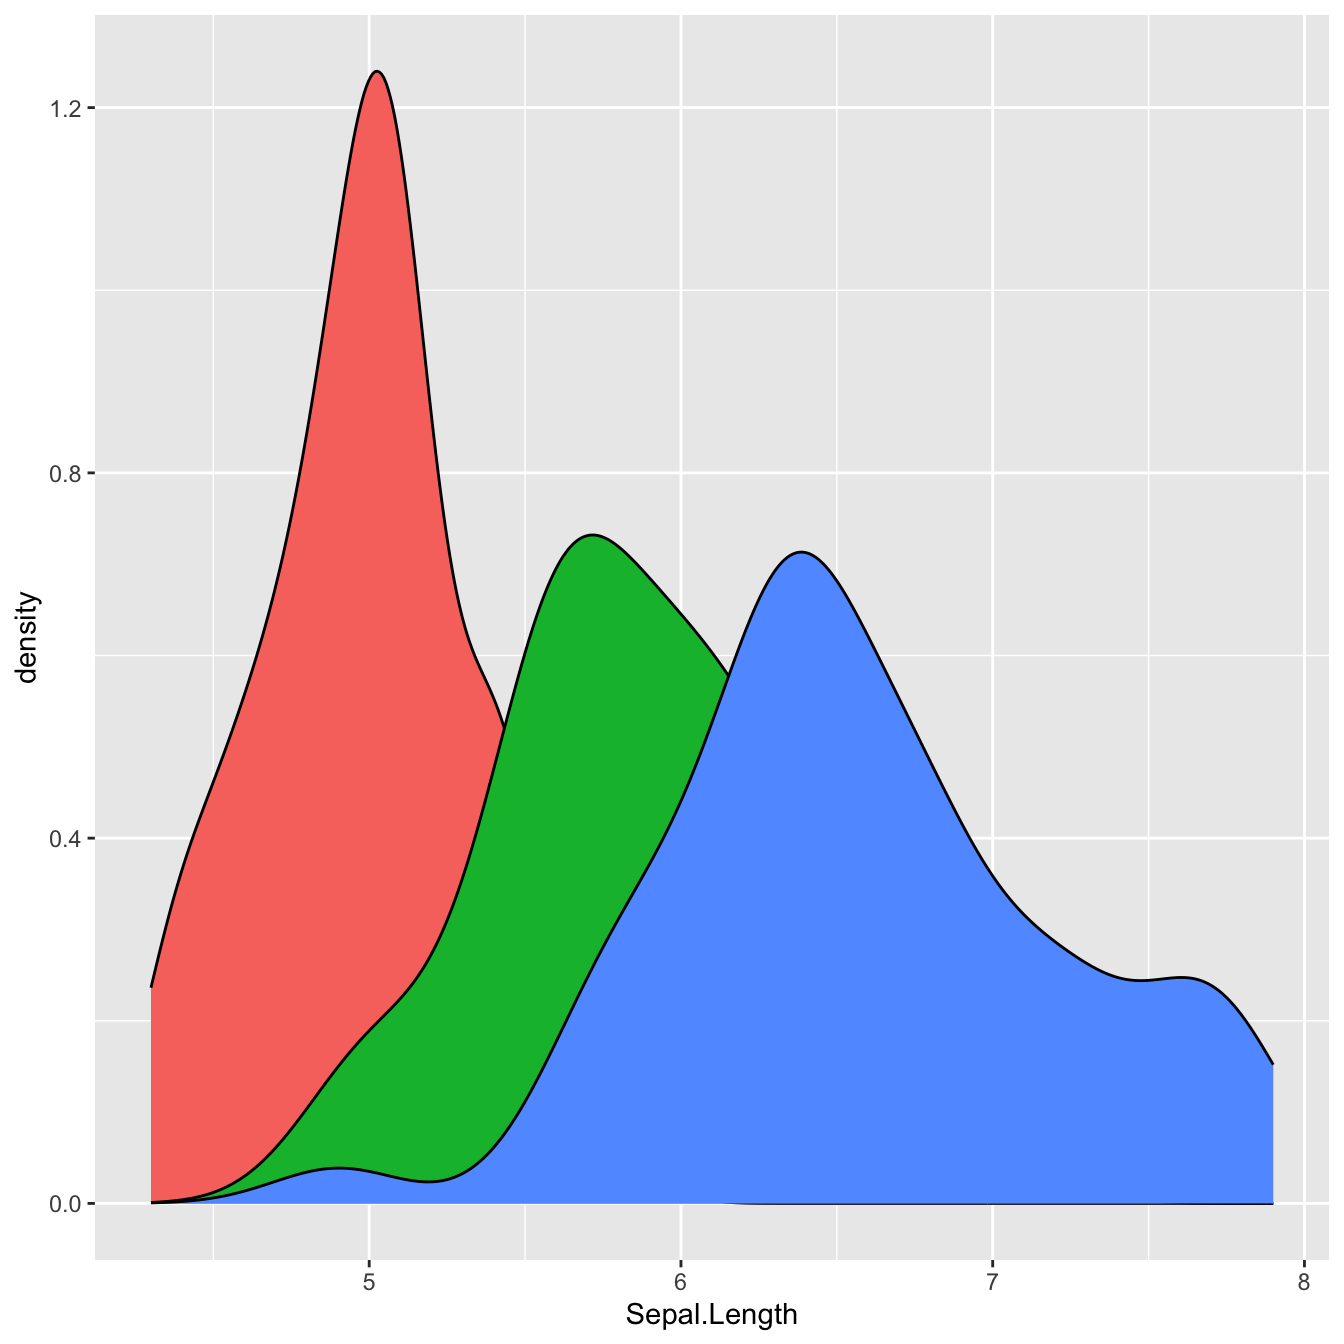
Default density chart in ggplot2
Here’s what the default density chart output looks like with
ggplot2:
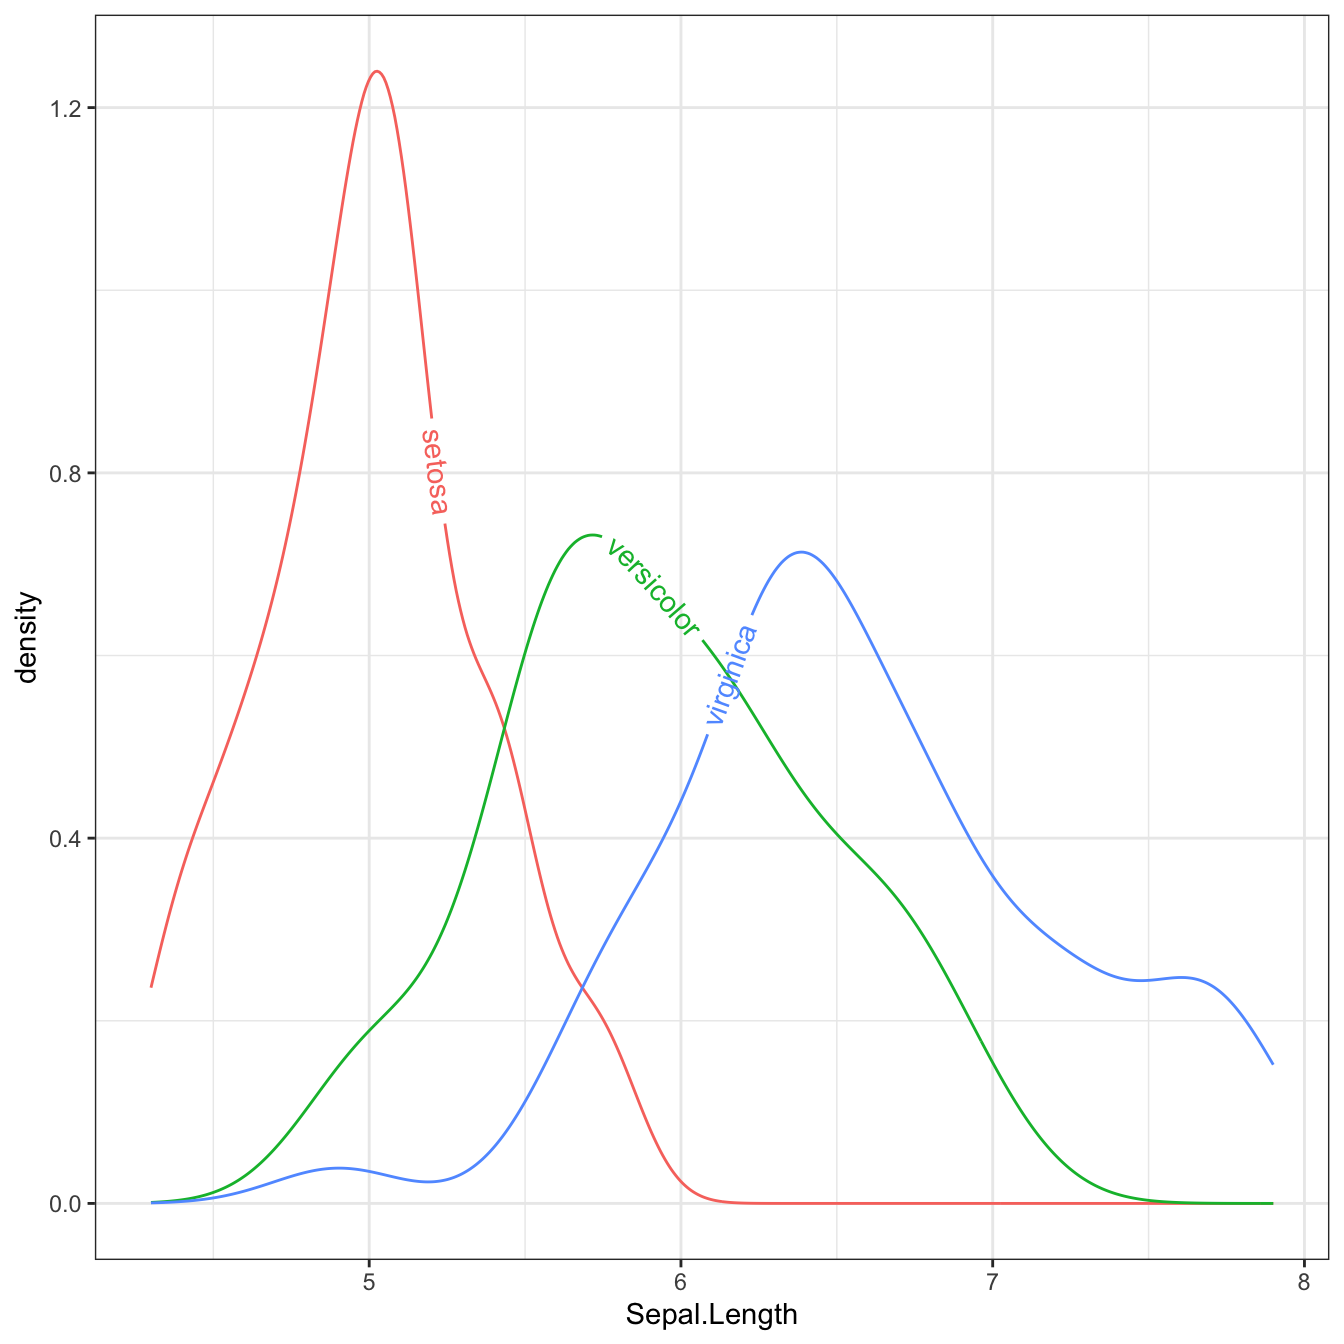
Add labels
With the geom_textdensity() function (inspired from
the geom_density() func from
ggplot2), we can add the label of species directly on each density line.
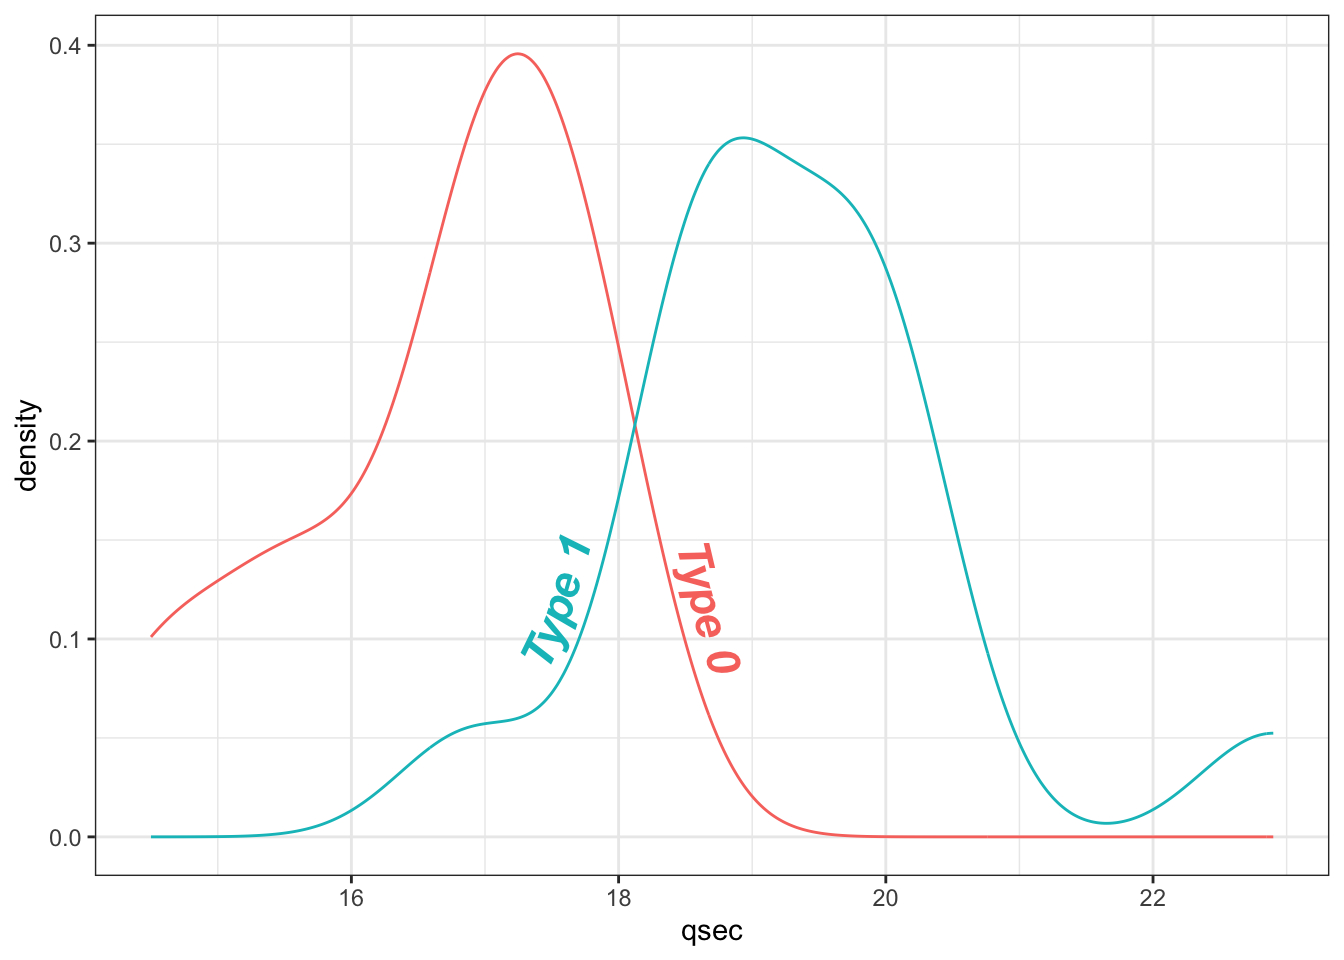
Change texts properties
The geom_textdensity() can take multiple arguments in
order to change the properties of the labels:
-
size: size of the text -
fontface: style of the font -
vjust: vertical adjustment -
hjust: horizontal adjustment
The 2 last arguments can either be float (generally
between -1 and 1) or string such as
xmid (or ymid), xmax (or
ymax) and auto (default).
library(hrbrthemes)
data(mtcars)

mtcars$labels = ifelse(mtcars$vs==0, "Type 0", "Type 1")
ggplot(mtcars, aes(x = qsec, colour = as.factor(labels), label = as.factor(labels))) +
  geom_textdensity(size = 6, fontface = 4, # size of 6, bold italic
                   vjust = -0.4, hjust = "ymid") +
  theme_bw() + guides(color = 'none')
Conclusion
In this post, we look at how to use the geomtexpath package to create density plot with text. To find out more about how to customize a density plot, see the dedicated section.


