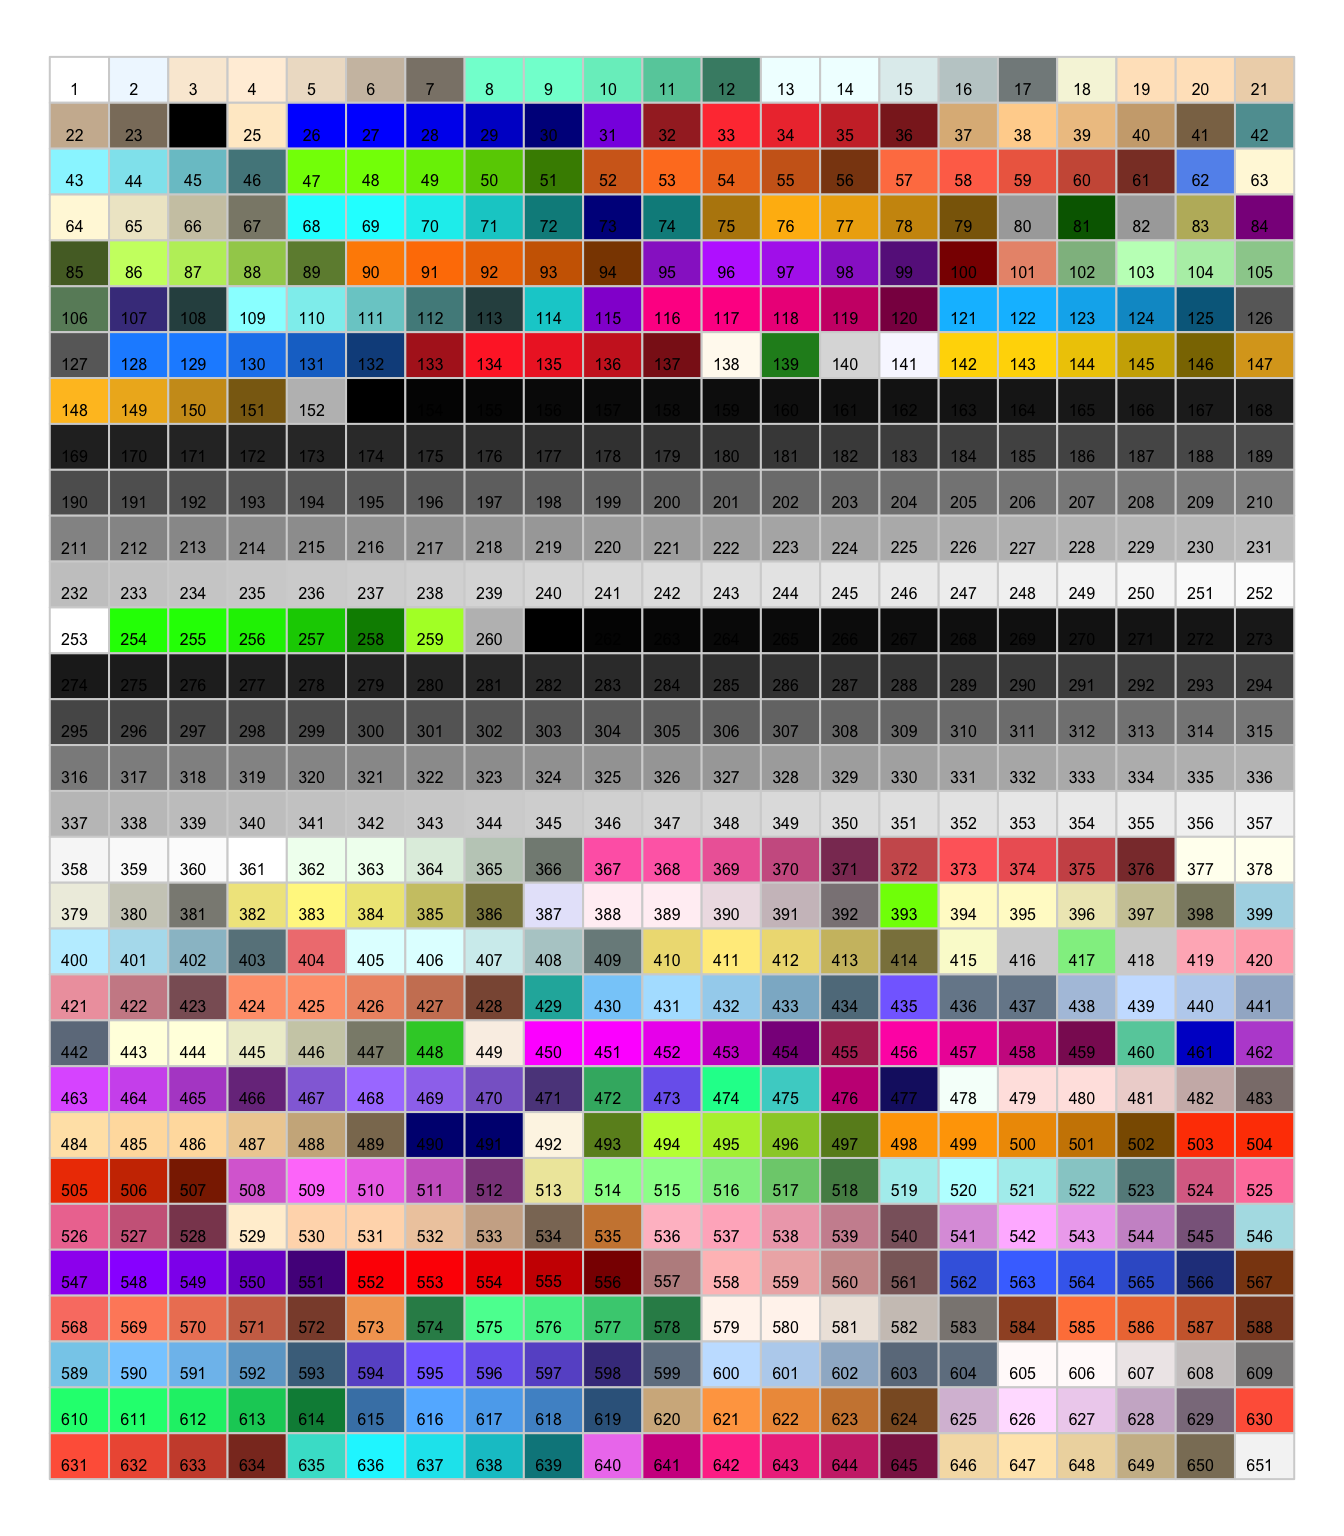
In R you can call colors by their numbers. This picture
shows corespondances between numbers and colors.
For example, if you call col=colors()[143], You will
get a kind of yellow.
par(mar=c(0,0,0,0))
plot(0, 0, type = "n", xlim = c(0, 1), ylim = c(0, 1), axes = FALSE, xlab = "", ylab = "")

# Parameters
line <- 31
col <- 21

# Rectangles
rect( rep((0:(col - 1)/col),line) ,  sort(rep((0:(line - 1)/line),col),decreasing=T) , rep((1:col/col),line) , sort(rep((1:line/line),col),decreasing=T),
       border = "light gray" , col=colors()[seq(1,651)])

# Text
text( rep((0:(col - 1)/col),line)+0.02 ,  sort(rep((0:(line - 1)/line),col),decreasing=T)+0.01 , seq(1,651)  , cex=0.5)