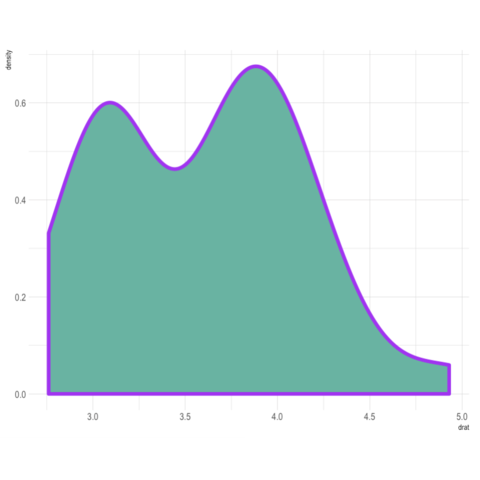
ggplot2 natively supports several methods to
customize the color palette:
ggplot2 natively supports several methods to
customize the color palette:
ggplot2 natively supports several methods to
customize the color palette:
ggplot2 natively supports several methods to
customize the color palette:
ggplot2 natively supports several methods to
customize the color palette:
ggplot2 natively supports several methods to
customize the color palette:
ggplot2 natively supports several methods to
customize the color palette:
ggplot2 natively supports several methods to
customize the color palette:
ggplot2 natively supports several methods to
customize the color palette:
ggplot2 natively supports several methods to
customize the color palette:
ggplot2 natively supports several methods to
customize the color palette:
ggplot2 natively supports several methods to
customize the color palette:
ggplot2 natively supports several methods to
customize the color palette:
ggplot2 natively supports several methods to
customize the color palette:
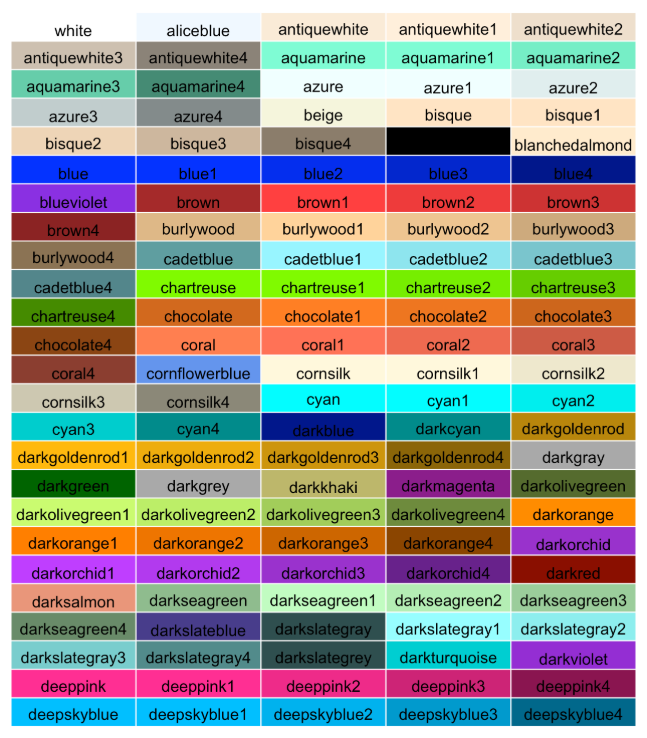
All the existing color palettes are available in
Paletteer. Just specify the package and palette
names to use!
All the existing color palettes are available in
Paletteer. Just specify the package and palette
names to use!
All the existing color palettes are available in
Paletteer. Just specify the package and palette
names to use!
All the existing color palettes are available in
Paletteer. Just specify the package and palette
names to use!
All the existing color palettes are available in
Paletteer. Just specify the package and palette
names to use!
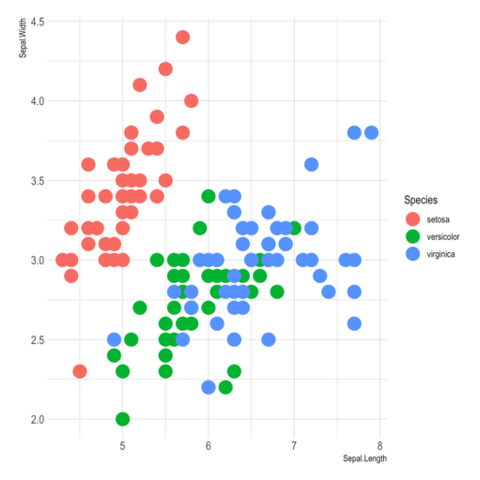
p <- ggplot(iris,
  aes(x=Sepal.Length, y=Sepal.Width, color=Species)) +
  geom_point(size=6)
p + scale_color_hue(h = c(180, 300))
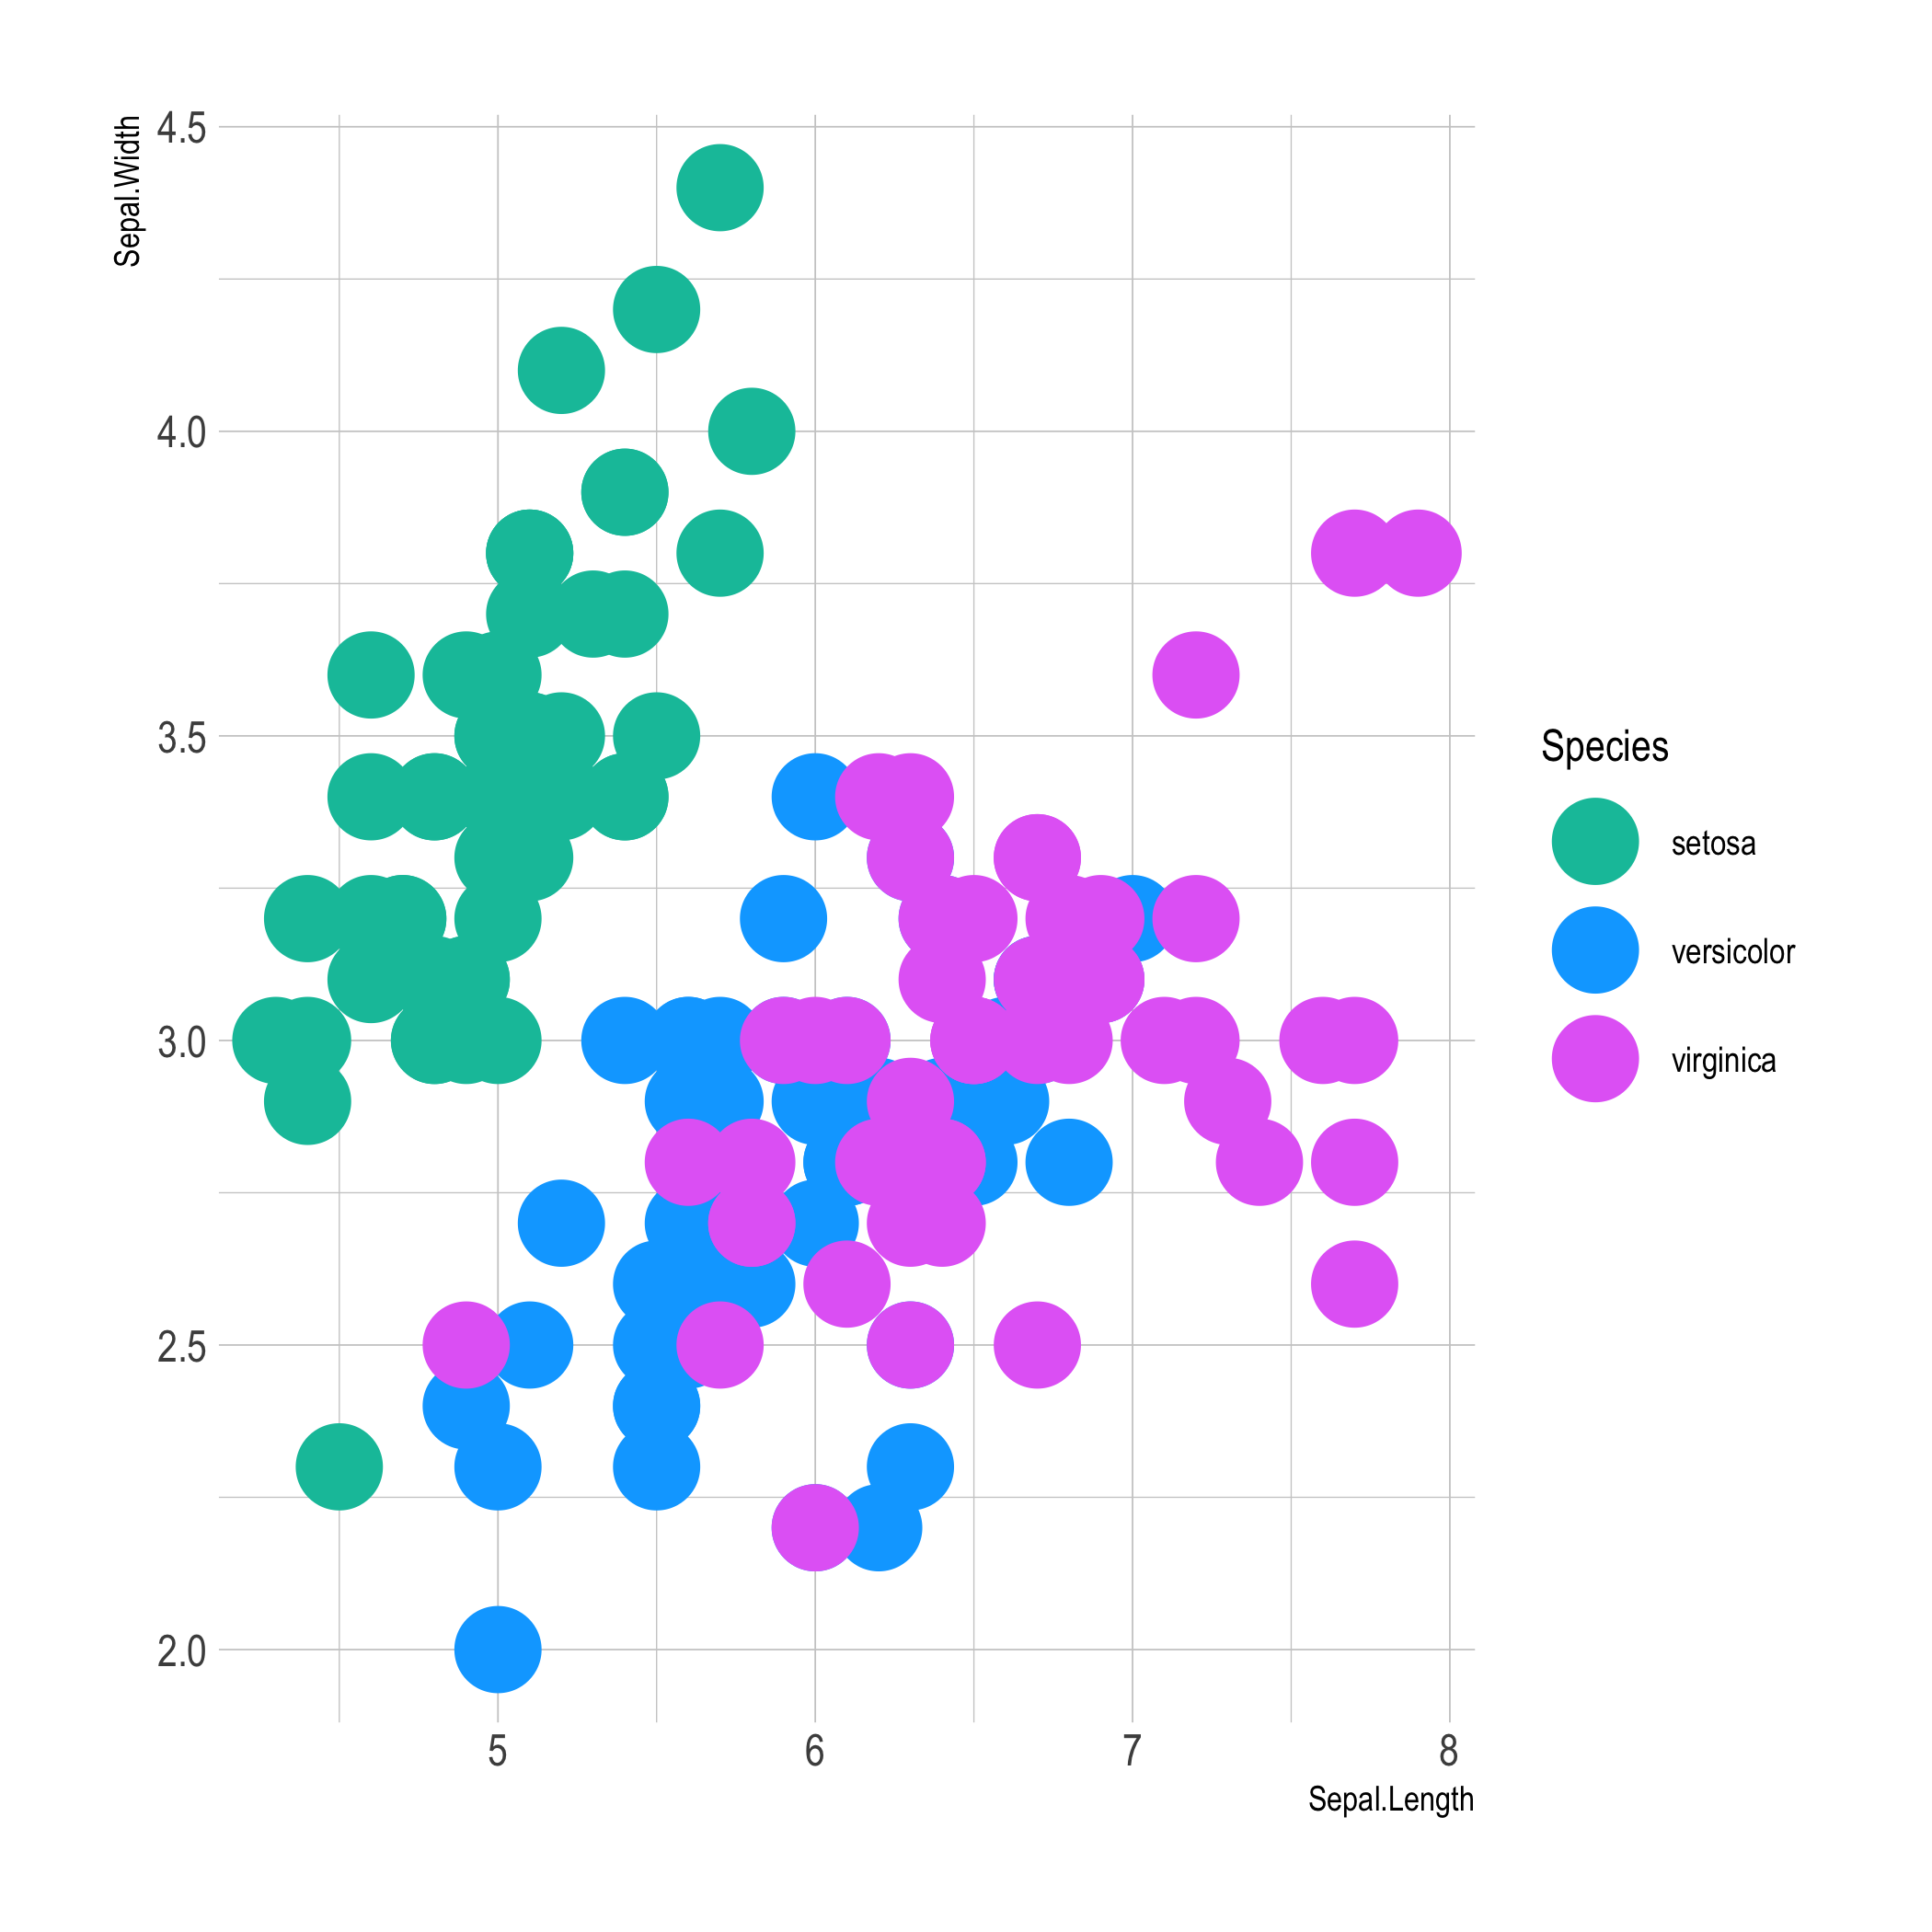
p + scale_color_manual(values=c("#69b3a2", "purple", "black"))
p + scale_color_grey()
p + scale_color_brewer(palette = "BuPu")
p + scale_color_brewer(palette = "RdYlBu")
p + scale_color_brewer(palette = "Paired")
p + scale_color_brewer(palette = "PuOr")
p + scale_color_brewer(palette = "Spectral")
p + scale_color_brewer(palette = "Pastel1")
p + scale_color_viridis(discrete=TRUE, option="magma")
p + scale_color_viridis(discrete=TRUE, option="inferno")
p + scale_color_viridis(discrete=TRUE, option="plasma")
p + scale_color_viridis(discrete=TRUE, option="viridis")
p + scale_color_viridis(discrete=TRUE, option="cividis")
p + scale_color_paletteer_d(nord, aurora)
p + scale_color_paletteer_d(awtools, a_palette)
p + scale_color_paletteer_d(dutchmasters, milkmaid)
scale_color_paletteer_d(ggsci, nrc_npg)
p + scale_color_paletteer_d(ggthemes, calc)
p + scale_color_hue(h = c(180, 300))
See all
See all
See all
See all
See all
See all
See all
See all
See all
See all
See all