Use par mfrow to split screen


The par() function allows to set the mfrow() parameters to cut the charting window in several section.

Scatter section Data to Viz

Most basic scatterplot


The par() function allows to set parameters to the 
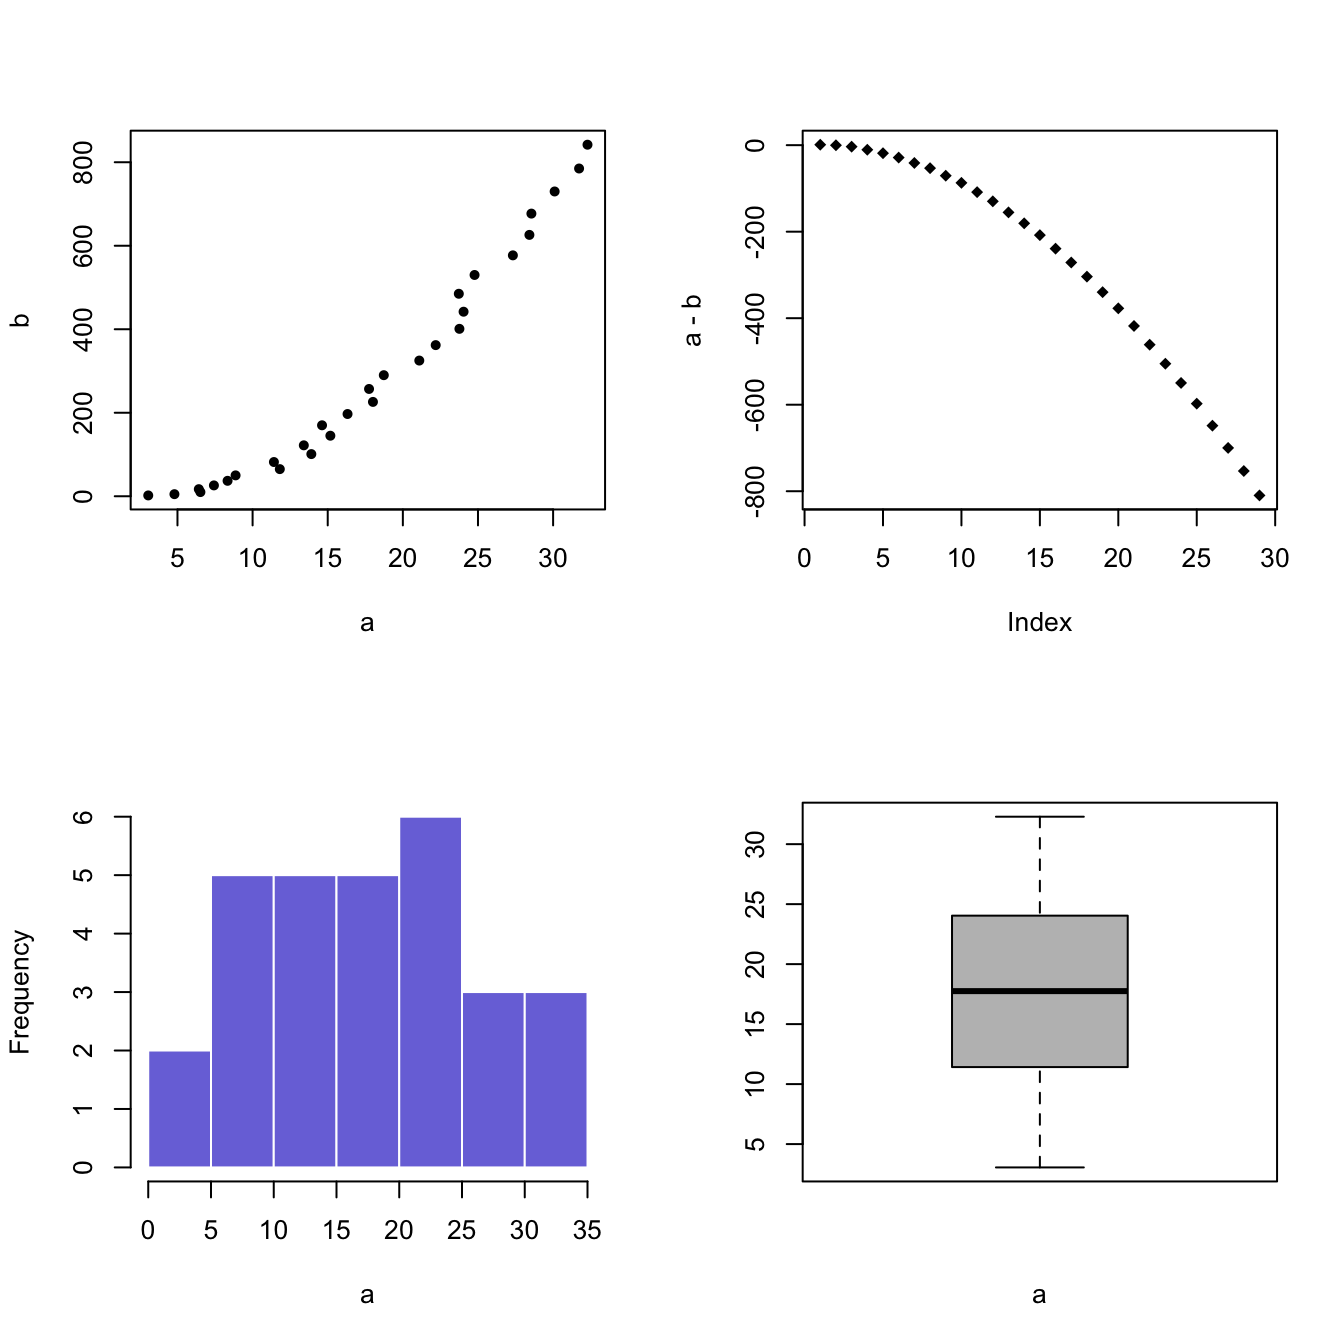
plot. The mfrow() parameter allows to split the screen in several panels. Subsequent charts will be drawn in panels.

You have to provide a vector of length 2 to mfrow(): number of rows and number of columns.

Note: mfcol() does the same job but draws figure by columns instead of by row.

Alternative: see the layout() function for more complex layout creation.

#Create data
a <- seq(1,29)+4*runif(29,0.4)
b <- seq(1,29)^2+runif(29,0.98)
 
#Divide the screen in 2 columns and 2 lines
par(mfrow=c(2,2))
 
#Add a plot in each sub-screen !
plot( a,b , pch=20)
plot(a-b , pch=18)
hist(a, border=F , col=rgb(0.2,0.2,0.8,0.7) , main="")
boxplot(a , col="grey" , xlab="a")

Related chart types


Scatter
Heatmap
Correlogram
Bubble
Connected scatter
Density 2d


❤️ 10 best R tricks ❤️

👋 After crafting hundreds of R charts over 12 years, I've distilled my top 10 tips and tricks. Receive them via email! One insight per day for the next 10 days! 🔥