Make ggplot2 dynamic and interactive with ggiraph


The ggiraph package in R is an extension of the ggplot2 package, designed to simplify the process of creating interactive and dynamic graphs. It’s an htmlwidget, which means it’s highly compatible with RMarkdown/Quarto document and Shiny application.

This post showcases the key features of ggiraph and provides a set of graph examples using the package.

Documentation

{ggiraph}

Quick start


The ggiraph package in R is an extension of the ggplot2 package, designed to simplify the process of creating interactive charts.

Try to hover over the chart below:

It offers a set of function to add interactivity such as geom_point_interactive() for an interactive version of geom_point(), geom_sf_interactive() for an interactive version of geom_sf() etc.

✍️ author → David Gohel

📘 documentationgithub

⭐️ more than 500 stars on github

Installation


To get started with ggiraph, you can install it directly from CRAN using the install.packages function:

install.packages("ggiraph")

Basic usage


Here’s an example using the geom_point_interactive() function that “replaces” the original geom_point() from ggplot2. It will also draw circles on the chart, but those circle will be interactive.

This geom has some new arguments like hover_nearest = TRUE that makes sure we always consider the nearest point to be hovered.

library(ggiraph)
library(tidyverse)

mtcars_db <- rownames_to_column(mtcars, var = "carname")

myplot <- ggplot(
  data = mtcars_db,
  mapping = aes(
    x = disp, y = qsec,
    # here we add interactive aesthetics
    tooltip = carname, data_id = carname
  )
) +
  geom_point_interactive(
    size = 3, hover_nearest = TRUE
  )

interactive_plot <- girafe(ggobj = myplot)
htmltools::save_html(interactive_plot, "../HtmlWidget/ggiraph-2.html")

Note: the tooltip property of the aes function is used to control the information to be displayed in the tooltip.

Key features


→ Combining Plots

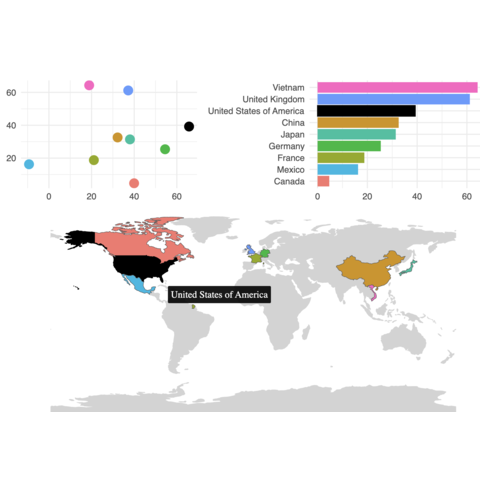
ggiraph becomes very powerful when multiple plots are displayed in the same charts. Due to its efficient mapping, we can easily create “connected” plots with cool hover effects!

Note: check the dedicated post on how to combine plots in ggiraph to learn more about it.

Combine 2 charts

library(ggiraph)
library(tidyverse)
library(patchwork)

mtcars_db <- rownames_to_column(mtcars, var = "carname")

# First plot: Scatter plot
scatter <- ggplot(
  data = mtcars_db,
  mapping = aes(
    x = disp, y = qsec,
    tooltip = carname, data_id = carname
  )
) +
  geom_point_interactive(
    size = 3, hover_nearest = TRUE
  ) +
  labs(
    title = "Displacement vs Quarter Mile",
    x = "Displacement", y = "Quarter Mile"
  ) +
  theme_bw()

# Second plot: Bar plot
bar <- ggplot(
  data = mtcars_db,
  mapping = aes(
    x = reorder(carname, mpg), y = mpg,
    tooltip = paste("Car:", carname, "<br>MPG:", mpg),
    data_id = carname
  )
) +
  geom_col_interactive(fill = "skyblue") +
  coord_flip() +
  labs(
    title = "Miles per Gallon by Car",
    x = "Car", y = "Miles per Gallon"
  ) +
  theme_bw()

# Combine the plots using patchwork
combined_plot <- scatter + bar +
  plot_layout(ncol = 2)

# Create a single interactive plot with both subplots
interactive_plot <- girafe(ggobj = combined_plot)

# Set options for the interactive plot
interactive_plot <- girafe_options(
  interactive_plot,
  opts_hover(css = "fill:cyan;stroke:black;cursor:pointer;"),
  opts_selection(type = "single", css = "fill:red;stroke:black;")
)

htmltools::save_html(interactive_plot, "../HtmlWidget/ggiraph-3.html")

Combine 3 charts

It is even possible to create more complex examples by adding, for example, a map:

Code


→ Use your own CSS for better styling

Although CSS is primarily used for styling web pages, it can also be relevant in customizing visuals in R, especially when dealing with web-based outputs like interactive charts or Shiny applications.

CSS code has the following structure: a property named (such as font-size), a colon (:), and the value of that property (14px). Each element is then separated by a ;.

Note: If you haven’t already, check the posts on how to use CSS in ggiraph and how to combine multiple plots and use CSS in ggiraph.

In this example, we’ll use the girafe_options() function and pass it several arguments:

  • opts_hover() for passing the CSS when hovering
  • opts_tooltip() for passing the CSS of the tooltip
library(ggiraph)
library(tidyverse)
library(ggplot2)
library(hrbrthemes)
library(viridis)
library(scales)

# Prepare data
mtcars_db <- rownames_to_column(mtcars, var = "carname") %>%
  mutate(efficiency = ifelse(mpg > mean(mpg), "Above Average", "Below Average"))

# Create the plot
barplot <- ggplot(
  data = mtcars_db,
  mapping = aes(
    x = reorder(carname, mpg),
    y = mpg,
    tooltip = paste(
      "<strong>Car:</strong>", carname,
      "<br><strong>MPG:</strong>", round(mpg, 1),
      "<br><strong>Horsepower:</strong>", hp,
      "<br><strong>Weight:</strong>", wt, "tons"
    ),
    data_id = carname,
    fill = mpg,
    color = efficiency
  )
) +
  geom_col_interactive(width = 0.7) +
  coord_flip() +
  scale_fill_viridis(option = "C") +
  scale_y_continuous(expand = expansion(mult = c(0, 0.1))) +
  labs(title = "Miles per Gallon by Car") +
  theme_ipsum(base_size = 14, plot_title_size = 22) +
  theme(
    legend.position = "none",
    panel.grid.major.y = element_blank(),
    axis.text.y = element_text(size = 10),
    panel.background = element_rect(fill = "white")
  )

# Create interactive plot
interactive_plot <- girafe(
  ggobj = barplot,
  width_svg = 10,
  height_svg = 8,
  options = list(
    opts_hover(css = "fill:#6f1d1b;"),
    opts_hover_inv(css = "opacity:0.3;"),
    opts_selection(type = "multiple", css = "fill:#FF851B;stroke:black;"),
    opts_toolbar(saveaspng = FALSE, position = "topright", delay_mouseout = 10000),
    opts_tooltip(
      css = "background-color:black;color:white;padding:30px;border-radius:10px;box-shadow:10px 10px 10px rgba(0,0,0,0.3);font-family:Arial;font-size:20px;",
      opacity = 0.9,
      use_fill = TRUE
    ),
    opts_sizing(rescale = TRUE),
    opts_zoom(max = 2)
  )
)

# Save the plot
htmltools::save_html(interactive_plot, "../HtmlWidget/ggiraph-4.html")


onclick effects with JavaScript

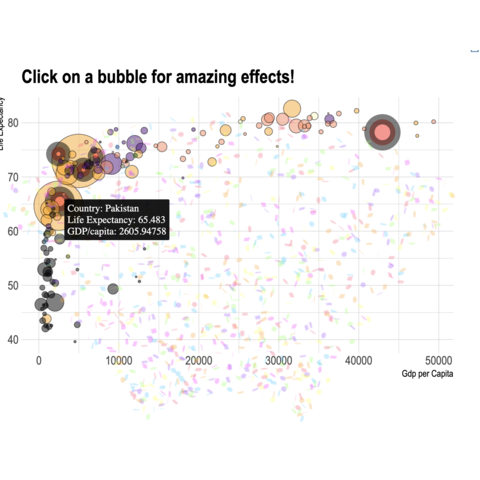
Using the onclick argument, you can define actions to be performed when the user clicks on certain parameters using JavaScript (JS).

Note: If you haven’t already, check the post on how to use JavaScript in ggiraph.

In the following example, we use JS to make the rectangles change colour and display confetti when the user clicks.

Note: check the post on how to use Javascript in ggiraph.

library(ggplot2)
library(ggiraph)
library(htmltools)

my_text <- "the R-Graph-Gallery"
p1 <- ggplot(
  data = diamonds,
  mapping = aes(x = color, fill = cut, data_id = cut)
) +
  geom_bar_interactive(
    aes(tooltip = sprintf("%s: %.0f", fill, after_stat(count))),
    size = 10,
    `data-blah` = my_text,
    extra_interactive_params = c("data-blah"),
    onclick = paste0(
      "this.style.fill = this.style.fill === \"red\" ? this.getAttribute(\"original-fill\") : \"red\";",
      "this.classList.toggle(\"highlighted\");",
      "var tooltip = document.getElementById(\"custom-tooltip\");",
      "tooltip.innerHTML = \"A chart by: \" + this.getAttribute(\"data-blah\");",
      "tooltip.style.display = \"block\";",
      "tooltip.style.left = (event.pageX + 10) + \"px\";",
      "tooltip.style.top = (event.pageY + 10) + \"px\";",
      "setTimeout(function() { tooltip.style.display = \"none\"; }, 1500);",
      "confetti({
        particleCount: 1000,
        spread: 70,
        origin: { y: 0.6 }
      });"
    )
  ) +
  theme_classic()

interactive_plot <- girafe(ggobj = p1)

html_content <- htmltools::tags$html(
  htmltools::tags$head(
    htmltools::tags$script(src = "https://cdn.jsdelivr.net/npm/canvas-confetti@1.5.1/dist/confetti.browser.min.js"),
    htmltools::tags$style("
      .highlighted {
        stroke: black;
        stroke-width: 2px;
      }
      #custom-tooltip {
        position: absolute;
        background: white;
        border: 1px solid black;
        padding: 5px;
        display: none;
        pointer-events: none;
      }
    ")
  ),
  htmltools::tags$body(
    interactive_plot,
    htmltools::tags$div(id = "custom-tooltip")
  )
)

htmltools::save_html(html_content, "../HtmlWidget/ggiraph-5.html")


→ Interactive maps

Interactivity is a very interesting feature, especially for choropleth maps, as it is very intuitive to fly over a specific region and want to know more.

In the following example, we see how to use ggiraph with sf to create an interactive choropleth map with additional information:

library(ggplot2)
library(ggthemes)
library(sf)
library(ggiraph)
library(dplyr)

atlas <- readr::read_rds(
  "https://github.com/viniciusoike/restateinsight/raw/main/static/data/atlas_sp_hdi.rds"
)

pop_hdi <- atlas |>
  st_drop_geometry() |>
  mutate(
    group_hdi = findInterval(HDI, seq(0.65, 0.95, 0.05), left.open = FALSE),
    group_hdi = factor(group_hdi)
  ) |>
  group_by(group_hdi) |>
  summarise(score = sum(pop, na.rm = TRUE)) |>
  ungroup() |>
  mutate(share = score / sum(score) * 100) |>
  na.omit() |>
  mutate(
    y_text = if_else(group_hdi %in% c(0, 7), share + 3, share - 3),
    label = paste0(round(share, 1), "%"),
    data_id = as.character(group_hdi) # Add data_id to pop_hdi
  )

atlas <- atlas |>
  mutate(group_hdi = findInterval(HDI, seq(0.65, 0.95, 0.05), left.open = FALSE))

pmap <- ggplot(atlas) +
  geom_sf_interactive(aes(fill = HDI, data_id = group_hdi, tooltip = paste("HDI:", HDI)), lwd = 0.05, color = "white") +
  scale_fill_fermenter(
    name = "",
    breaks = seq(0.65, 0.95, 0.05),
    direction = 1,
    palette = "YlGnBu"
  ) +
  labs(
    title = "HDI in Sao Paulo, BR (2010)",
    subtitle = "Microregion HDI in Sao Paulo",
    caption = "Source: Atlas Brasil"
  ) +
  theme_map() +
  theme(
    legend.position = "none",
    plot.title = element_text(size = 16, hjust = 0.5),
    plot.subtitle = element_text(hjust = 0.5)
  )

x_labels <- c(
  "0.650 or less", "0.650 to 0.699", "0.700 to 0.749", "0.750 to 0.799",
  "0.800 to 0.849", "0.850 to 0.899", "0.900 to 0.949", "0.950 or more"
)

pcol <- ggplot(pop_hdi, aes(group_hdi, share, fill = group_hdi)) +
  geom_col_interactive(aes(data_id = data_id, tooltip = paste("Share:", label))) +
  geom_hline(yintercept = 0) +
  geom_text_interactive(
    aes(y = y_text, label = label, color = group_hdi, data_id = data_id),
    size = 2
  ) +
  coord_flip() +
  scale_x_discrete(labels = x_labels) +
  scale_fill_brewer(palette = "YlGnBu") +
  scale_color_manual(values = c(rep("black", 5), rep("white", 2), "black")) +
  guides(fill = "none", color = "none") +
  labs(
    title = "",
    x = NULL,
    y = NULL
  ) +
  theme_void() +
  theme(
    panel.grid = element_blank(),
    plot.title = element_text(size = 8), # Reduced title size
    axis.text.y = element_text(size = 5), # Reduced y-axis text size
    axis.text.x = element_blank(),
    aspect.ratio = 1.5
  )

p_hdi_atlas <- pmap + pcol + plot_layout(widths = c(3, 1))
p_hdi_atlas <- pmap + inset_element(pcol, left = 0.5, bottom = 0, right = 1, top = 0.5)

interactive_plot <- girafe(
  ggobj = p_hdi_atlas,
  options = list(
    opts_hover(css = "fill:orange;"),
    opts_hover_inv(css = "opacity:0.5;"),
    opts_selection(type = "single", only_shiny = FALSE)
  )
)

htmltools::save_html(interactive_plot, "../HtmlWidget/ggiraph-6.html")


❤️ 10 best R tricks ❤️

👋 After crafting hundreds of R charts over 12 years, I've distilled my top 10 tips and tricks. Receive them via email! One insight per day for the next 10 days! 🔥